R SCRIPTING BASICS
RossWickham
Senior Hydraulic Engineer
NWW, Hydrology Branch
Date: 17 March 2022
2.
2
OUTLINE
• R Background
•Basic Syntax and Scripting
• Key Packages
• Example Applications
• Demo
• Summary
• Resources
3.
3
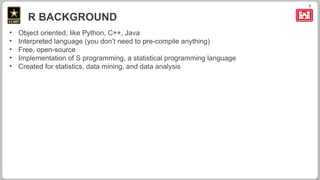
R BACKGROUND
• Objectoriented, like Python, C++, Java
• Interpreted language (you don’t need to pre-compile anything)
• Free, open-source
• Implementation of S programming, a statistical programming language
• Created for statistics, data mining, and data analysis
4.
4
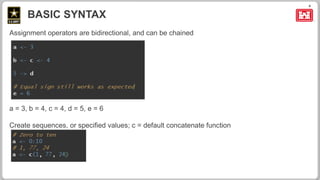
Assignment operators arebidirectional, and can be chained
a = 3, b = 4, c = 4, d = 5, e = 6
Create sequences, or specified values; c = default concatenate function
BASIC SYNTAX
5.
5
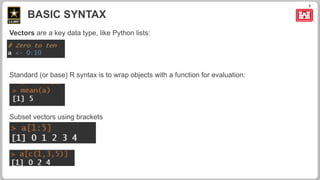
Vectors are akey data type, like Python lists:
Standard (or base) R syntax is to wrap objects with a function for evaluation:
Subset vectors using brackets
BASIC SYNTAX
6.
6
Data.frames are anessential data storage type for any tabular/paired data (e.g., time series),
like pandas dataframe in Python:
Data.frames are easily plotted:
BASIC SYNTAX
8
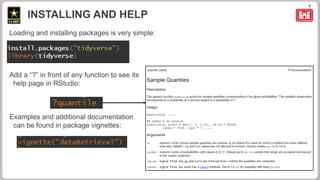
Loading and installingpackages is very simple:
Add a “?” in front of any function to see its
help page in RStudio:
Examples and additional documentation
can be found in package vignettes:
INSTALLING AND HELP
9.
9
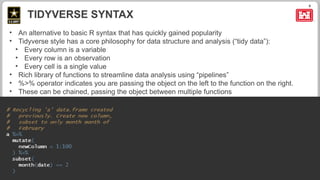
• An alternativeto basic R syntax that has quickly gained popularity
• Tidyverse style has a core philosophy for data structure and analysis (“tidy data”):
• Every column is a variable
• Every row is an observation
• Every cell is a single value
• Rich library of functions to streamline data analysis using “pipelines”
• %>% operator indicates you are passing the object on the left to the function on the right.
• These can be chained, passing the object between multiple functions
TIDYVERSE SYNTAX
10.
10
My preferred method:use RStudio, an Integrated Developer Environment (IDE)
• See your code
• Test evaluations
• View errors
• See plots
• Get help
• See current objects being used (your “environment”)
• See history
• Customize the user interface
• Configure R version
• Available on App Portal
SCRIPTING IN R
11.
11
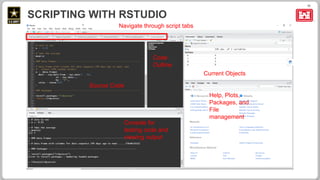
SCRIPTING WITH RSTUDIO
SourceCode
Current Objects
Help, Plots,
Packages, and
File
management
Console for
testing code and
viewing output
Navigate through script tabs
Code
Outline
12.
12
Able to controlwhich version of R is being used: Tools > Global Options
SCRIPTING WITH RSTUDIO – CONFIGURING R
*Use 64-bit unless
you have a good
reason to use 32-bit
13.
13
R VS PYTHON
•Use what you know and are comfortable with – both are great
• R is more portable
• Python is generally considered easier to learn
• R is better for statistics
• R considered easier for plotting
• Python typically faster, better for machine learning
14.
14
KEY PACKAGES (FORH&H)
• tidyverse – set of packages designed to work together for data analysis under a core philosophy
– ggplot2 – plotting library
– dplyr – data manipulation
– purrr – create complex data pipelines
– readr – fast, user-friendly way to read rectangular data
– tidyr – consistently organize tabular data
– and others…
• reshape2 – data.frame manipulation
• lubridate – parse and manipulate dates
• rgdal, sp, raster – read, write, and manipulate geospatial objects
• plotly – interactive plots
• dataRetrieval - USGS data web retrieval
Specific to the Corps:
• cwms_read – read publicly available NWD CWMS data, Jeff Tilton (NWD)
• dssrip – read, manipulate, write DSS data, Evan Heisman (HEC)
Advanced Users:
• shiny, shinydashboard – develop web app user interfaces; dynamically interact with data
• leaflet – interactive maps, with interactive content
16
RESOURCES
Simple R cheatsheet
Cheat sheets for multiple packages
Portable version of R and RStudio with example code:
<HEC share drive>
The R Manuals (written by R development core team)
The Little Book of R for Time Series
Code Academy tutorials
Translation between Python pandas and R data.frame
Stackoverflow: help forum
dssrip package: read and write DSS in R
cwms_read package: read NWW CWMS data in Python and R
Editor's Notes
#9 %>% implies the first argument of the following function will be the object to the left: mutate function’s first argument is the ‘a’ data.frame, and outputs the modified data.frame to be passed to the subset function


![[DSC Europe 25] Ivan Lukovic & Marija Djukic - From Data to Value: Why Maturi...](https://cdn.slidesharecdn.com/ss_thumbnails/ahrfps8xr6knowwhacxh-1-ivan-marija-dsc-2025-ld-v1-presentation-260115093812-be21adfc-thumbnail.jpg?width=640&height=640&fit=bounds)
![[DSC Europe 25] Srba Markovic - From Pilot to Production: Overcoming AI Deplo...](https://cdn.slidesharecdn.com/ss_thumbnails/yjjmrtytmwbalxlba7px-4-srba-markovic-from-pilot-to-production-overcoming-ai-deployment-blockers-with-260114111931-4a892d44-thumbnail.jpg?width=640&height=640&fit=bounds)


![[DSC Europe 25] Danilo Djukanovic - From Vibes to KPIs: Turning Culture Into ...](https://cdn.slidesharecdn.com/ss_thumbnails/inqestws5wf0cik2glgv-3-danilo-djukanovic-from-vibes-to-kpis-presentation-260114111931-dacff81f-thumbnail.jpg?width=640&height=640&fit=bounds)


