Introduction to RStudio
R Studio is an integrated development environment(IDE) for R. IDE is a
GUI, where we can write your quotes, see the results and also see the
variables that are generated during the course of programming.
R Studio is available as both Open source and Commercial software.
R Studio is also available as both Desktop and Server versions.
R Studio is also available for various platforms such as Windows,
Linux, and macOS.
Getting Started with R Studio
Rstudio is an open-source tool that provides Ide to use R language, and
enterprise-ready professional software for data science teams to develop
share the work with their team.
R Studio can be downloaded from its official Website (https://posit.co/)
and instructions for installation are available on How to Install RStudio for
R programming in Windows?
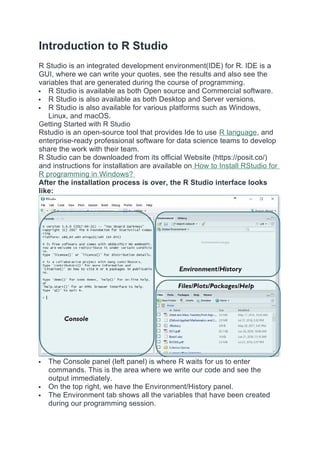
After the installation process is over, the R Studio interface looks
like:
The Console panel (left panel) is where R waits for us to enter
commands. This is the area where we write our code and see the
output immediately.
On the top right, we have the Environment/History panel.
The Environment tab shows all the variables that have been created
during our programming session.
2.
The Historytab keeps track of all the commands we’ve used so far in
our current session.
On the bottom right, there is another panel that contains several useful
tabs.
The Files tab displays the files and folders in the current working
directory.
The Plots tab is used to display graphs and plots that we generate
through our R scripts.
The Packages tab shows all the installed packages and allows us to
install new ones.
The Help tab provides documentation and support for R functions.
The Viewer tab is used to view local web content generated within R.
Features of R Studio
A friendly user interface
writing and storing reusable programmes
All imported data and newly created objects (such as variables,
functions, etc.) are easily accessible.
Comprehensive assistance for any item Code autocompletion
The capacity to organise and share your work with your partners more
effectively through the creation of projects.
Plot snippets
Simple terminal and console switching
Tracking of operational history
There are numerous articles from RStudio Support on using the IDE.
Set the working directory in R Studio
R is always pointed at a directory on our computer. We can find out which
directory by running the getwd() function. Note: this function has no
arguments. We can set the working directory manually in two ways:
The first way is to use the console and using the command
setwd("directorypath").
You can use this function setwd() and give the path of the directory
which you want to be the working directory for R studio, in the double
codes.
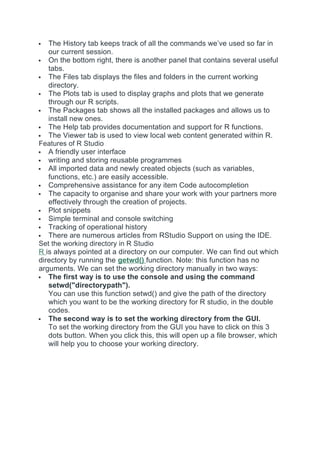
The second way is to set the working directory from the GUI.
To set the working directory from the GUI you have to click on this 3
dots button. When you click this, this will open up a file browser, which
will help you to choose your working directory.
3.
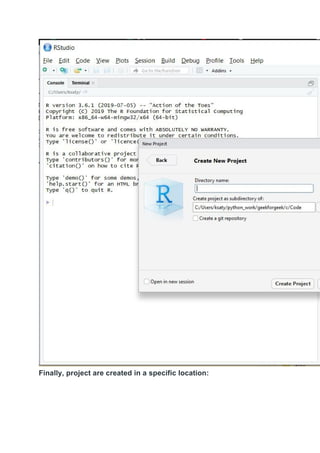
Once you chooseyour working directory, you need to use this setting
button in the more tab and click it and then you get a popup menu,
where you need to select "Set as working directory".
This will select the current directory, which you have chosen using this
file browser as your working directory. Once you set the working
directory, you are ready to program in R Studio.
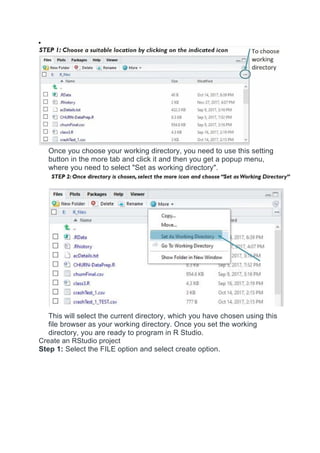
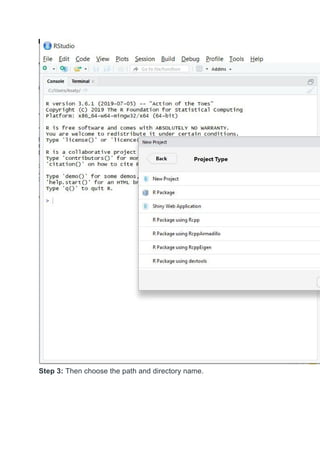
Create an RStudio project
Step 1: Select the FILE option and select create option.
4.
Step 2: Thenselect the New Project option.
Step 2: Then select the New Project option.
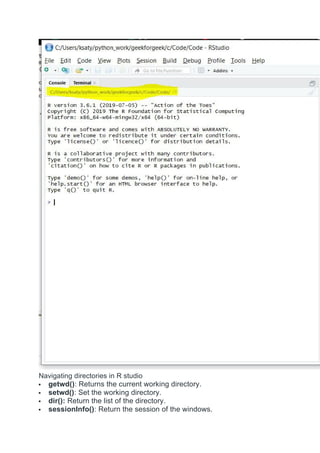
Navigating directories inR studio
getwd(): Returns the current working directory.
setwd(): Set the working directory.
dir(): Return the list of the directory.
sessionInfo(): Return the session of the windows.
8.
date(): Returnthe current date.
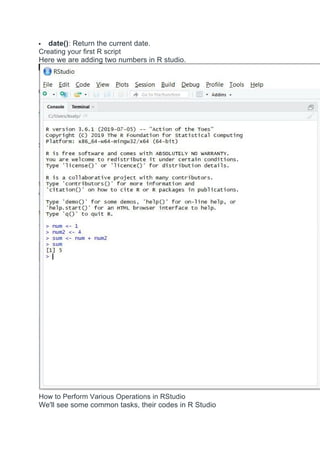
Creating your first R script
Here we are adding two numbers in R studio.
How to Perform Various Operations in RStudio
We'll see some common tasks, their codes in R Studio
9.
Installing R packages
Syntax:
install.packages('package_name')
LoadingR package
Syntax:
library(package_name)
Help on an R package
help(package_name)
R Studio, a versatile R IDE, supports open-source and commercial usage
on various platforms. It streamlines data science tasks, from project
creation to package management, with a user-friendly interface.
R is an interpreted programming language widely used for statistical
computing, data analysis and visualization. R language is open-source with
large community support. R provides structured approach to data
manipulation, along with decent libraries and packages like Dplyr, Ggplot2,
shiny, Janitor and more.
Hello World Program in R Language
Here is an example of the first Hello World program in R Programming
Language. To print in R language you just need to use a Print function.
# Code
print("Hello World!")
Output
Hello World!
Why Learn R?
Lists
Matrices
Data Frames
Arrays
Factors
Strings
Control Flow
In this section, we will learn about control flow mechanisms in R, including
conditional statements (if, else) and looping structures (for, while). These
concepts allow you to control the flow of execution in your programs.
Decision Making
Loops (for, while, repeat)
Functions and Object Oriented Programming
In this section, we will discuss the creation and use of functions in R for
modular and reusable code. Additionally, we will touch on Object-Oriented
Programming (OOP) in R, exploring the basics of class creation and
inheritance.
Functions
10.
Object-Oriented Programming
Classes
Objects
Encapsulation
Polymorphism
Inheritance
Abstraction
File and Error HandlingApplications of R Programming Language
R is widely used across many industries due to its strong capabilities in
data analysis and visualization. Some key applications include:
Data Analysis and Statistics: R is widely used for statistical analysis
and modeling with built-in functions and packages that simplify complex
computations.
Data Visualization: With libraries like ggplot2 and lattice, R enables
creation of detailed and customizable charts and graphs for effective
data presentation.
Data Cleaning and Preparation: R provides tools to import, clean, and
transform data from various sources, making it ready for analysis.
Machine Learning and Data Science: R supports machine learning
through packages such as caret, randomForest, and xgboost, helping
build predictive models.
Reporting and Reproducible Research: Tools like R Markdown
and knitr allow dynamic report generation and sharing of reproducible
data analyses.
Bioinformatics and Healthcare: R is commonly used to analyze
biological and clinical data in genomics and medical research.
Finance and Insurance: R is used for risk analysis, portfolio
management, and actuarial modeling in financial industries.
Interactive Web Applications: Frameworks like Shiny enable building
interactive web apps directly from R for data visualization and
dashboards.
R is a programming language and software environment that has become
the first choice for statistical computing and data analysis. Developed in the
early 1990s by Ross Ihaka and Robert Gentleman, R was built to simplify
complex data manipulation and create clear, customizable visualizations.
Over time, it has gained popularity among statisticians, data scientists and
researchers because of its capabilities and the vast array of packages
11.
available.
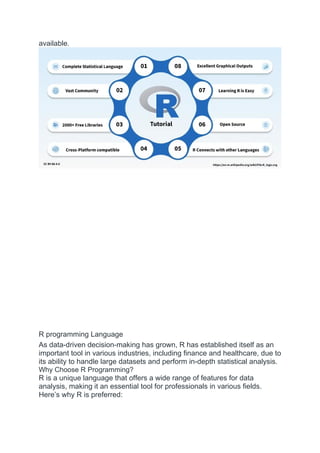
R programming Language
Asdata-driven decision-making has grown, R has established itself as an
important tool in various industries, including finance and healthcare, due to
its ability to handle large datasets and perform in-depth statistical analysis.
Why Choose R Programming?
R is a unique language that offers a wide range of features for data
analysis, making it an essential tool for professionals in various fields.
Here’s why R is preferred:
12.
Free andOpen-Source: R is open to everyone, meaning users can
modify, share and distribute their work freely.
Designed for Data: R is built for data analysis, offering a
comprehensive set of tools for statistical computing and graphics.
Large Package Repository: The Comprehensive R Archive Network
(CRAN) offers thousands of add-on packages for specialized tasks.
Cross-Platform Compatibility: R can work on Windows, Mac and
Linux operating systems.
Great for Visualization: With packages like ggplot2, R makes it easy
to create informative, interactive charts and plots.
Key Features of R
Cross-Platform Support: R works on multiple operating systems,
making it versatile for different environments.
Interactive Development: R allows users to interactively experiment
with data and see the results immediately.
Data Wrangling: Tools like dplyr and tidyr help simplify data cleaning
and transformation.
Statistical Modeling: R has built-in support for various statistical
models like regression, time-series analysis and clustering.
Reproducible Research: With R Markdown, users can combine code,
output and narrative in one document, ensuring their analysis is
reproducible.
Example Program in R
To understand how R works, here’s a basic example where we calculate
the mean and standard deviation of a dataset:
We first create a vector data that contains numerical values.
We use the mean() function to calculate the mean of the dataset.
The sd() function calculates the standard deviation.
data <- c(5, 10, 15, 20, 25, 30, 35, 40, 45, 50)
mean_data <- mean(data)
print(paste("Mean: ", mean_data))
std_dev <- sd(data)
print(paste("Standard Deviation: ", std_dev))
Output:
[1] "Mean: 27.5"
[1] "Standard Deviation: 15.1382517704875"
Applications of R
R is used in a variety of fields, including:
Data Science and Machine Learning: R is widely used for data
analysis, statistical modeling and machine learning tasks.
Finance: Financial analysts use R for quantitative modeling and risk
analysis.
13.
Healthcare: Inclinical research, R helps analyze medical data and test
hypotheses.
Academia: Researchers and statisticians use R for data analysis and
publishing reproducible research.
Advantages of R Programming
Comprehensive Statistical Tools: R includes many statistical
functions and models, making it the ideal choice for data analysis.
Customizable Visualizations: R’s visualization tools allows for
customizations for a simple bar chart or a detailed heatmap.
Extensive Community Support: R has a large user base and there are
countless resources, forums and tutorials available.
Highly Extendable: The availability of over 15,000 R packages means
we can extend R's functionality to suit any project or need.
Disadvantages of R Programming
Memory Intensive: R can be slow with very large datasets, consuming
a lot of memory.
Limited Support for Error Handling: Unlike some other programming
languages, R has less robust error handling features.
Steeper Learning Curve: Beginners might face challenges with some
of R’s complex features and syntax.
Performance: R’s performance can lag behind languages like Python or
C++ when it comes to speed, especially for large-scale operations.
In this article, we’ve seen how R is an tool for data analysis, statistical
computing and visualization. Its open-source nature, comprehensive
feature set and active community make it an excellent choice for both
beginners and seasoned professionals.
Interesting Facts about R Programming
Language
R is an open-source programming language that is widely used as a
statistical software and data analysis tool. R generally comes with the
Command-line interface. R is available across widely used platforms like
Windows, Linux, and macOS. Also, the R programming language is the
latest cutting-edge tool. It was designed by Ross Ihaka and Robert
Gentleman at the University of Auckland, New Zealand, and is currently
developed by the R Development Core Team
14.
Here are someinteresting facts about the R programming language:
R programming language is an implementation of the S programming
language. It also combines with lexical scoping semantics inspired by
Scheme. It is named partly after the first names of the first two R
authors and partly as a play on the name of S.
R supports both procedural programming and object-oriented
programming. Procedural programming includes the procedure,
records, modules, and procedure calls. While object-oriented
programming language includes class, objects, and generic functions.
R language is an interpreted language instead of a compiled language.
Therefore, it doesn't need a compiler to compile code into an
executable program. This makes running an R script much less time-
consuming.
The number of R packages available either through CRAN or GitHub is
1, 00, 000 and they do epic stuff with just one line of code. It could
range from Regression to Bayesian analysis.
R is growing faster than any other data science language. It's the most-
used data science language after SQL. It is used by 70% of data
miners.
One of the packages in R namely rmarkdown package helps you
create reproducible Word documents and reproducible Powerpoint
Presentations from your R markdown code just by changing one line in
the YAML! ("YAML Ain't Markup Language!")
It is really very easy in R to connect to almost any database using the
dbplyr package. This makes possible for an R user to work
independently and pulling data from almost all common database
15.
types. You canalso use packages like bigquery to work directly with
BigQuery and other high-performance data stores.
You can build and host interactive web apps in just a few lines of code
in R. Using the flexdashboard package in R you can create interactive
web apps with a few lines of code. And using the rsconnect package
you can also host your web apps on your own server or, even easier,
host them on a cloud server.
You can not only deploy web apps but also can make them into
awesome video games in R. The nessy package helps you create
NES(The Nintendo Entertainment System) looking Shiny apps and
deploy them just like you would any other Shiny app.
You can build APIs and serve them from R. The plumber package in R
helps you convert R functions to web APIs that can be integrated into
downstream applications.
According to PYPL PopularitY of Programming Language R is #7 of all
programming languages. R is the #1 Google Search for Advanced
Analytics software. It has more than 3 million users worldwide make a
huge community for R programming language.
The origin of R programming language can be traced back to 1993
when Ross Ihaka and Robert Gentleman at the University of Auckland,
New Zealand introduced it.
R is an open-source language and it is available for free for everyone
to use for statistical and graphical purposes.
The R programming language has a supportive and enthusiastic user
community, providing ample resources and assistance to users.
The widespread usage of R in fields such as data science, machine
learning, and statistical modeling has made it one of the most sought-
after programming languages.
R has a wealth of packages and libraries, allowing users to perform
complex tasks easily and extend its functionality.
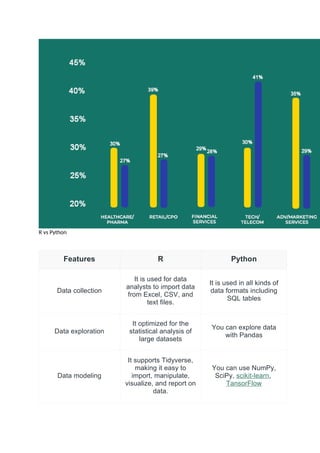
Industries such as finance, healthcare, pharmaceuticals, and marketing
make use of R for data analysis and modeling.
In academic research, R has become a crucial tool across various
disciplines such as biology, psychology, and economics.
R operates seamlessly on different platforms like Windows, macOS,
and Linux, making it easily accessible to users regardless of the
operating system they use.
R vs Python
R Programming Language and Python are both used extensively for
Data Science. Both are very useful and open-source languages as well.
16.
For data analysis,statistical computing, and machine learning Both
languages are strong tools with sizable communities and huge libraries for
data science jobs. A theoretical comparison between R and Python is
provided below:
R Programming Language
R Programming Language is used for machine learning algorithms,
linear regression, time series, statistical inference, etc. It was designed by
Ross Ihaka and Robert Gentleman in 1993. R is an open-source
programming language that is widely used as a statistical software and
data analysis tool. R generally comes with the Command-line interface. R
is available across widely used platforms like Windows, Linux, and
macOS. Also, the R programming language is the latest cutting-edge tool.
Python Programming Language
Python is a widely-used general-purpose, high-level programming
language. It was created by Guido van Rossum in 1991 and further
developed by the Python Software Foundation. It was designed with an
emphasis on code readability, and its syntax allows programmers to
express their concepts in fewer lines of code.
Difference between R Programming and Python Programming
Below are some major differences between R and Python:
Feature R Python
Introduction R is a language and
environment for
statistical programming
which includes
statistical computing
Python is a general-
purpose programming
language for data analysis
and scientific computing
17.
Feature R Python
andgraphics.
Objective
It has many features
which are useful for
statistical analysis and
representation.
It can be used to develop
GUI applications and web
applications as well as with
embedded systems
Workability
It has many easy-to-
use packages for
performing tasks
It can easily perform matrix
computation as well as
optimization
Integrated
development
environment
Various popular R IDEs
are Rstudio, RKward, R
commander, etc.
Various popular Python
IDEs are Spyder,
Eclipse+Pydev, Atom, etc.
Libraries and
packages
There are many
packages and libraries
like ggplot2, caret, etc.
Some essential packages
and libraries
are Pandas, Numpy, Scipy,
etc.
Scope
It is mainly used for
complex data analysis
in data science.
It takes a more streamlined
approach for data science
projects.
Ecosystem in R Programming and Python Programming
Python supports a very large community of general-purpose data
science. One of the most basic uses for data analysis, primarily because
of the fantastic ecosystem of data-centric Python packages. Pandas and
NumPy are one of those packages that make importing and analyzing,
and visualization of data much easier.
R Programming has a rich ecosystem to use in standard machine
learning and data mining techniques. It works in statistical analysis of
large datasets, and it offers a number of different options for exploring
data and It makes it easier to use probability distributions, apply different
statistical tests.
18.
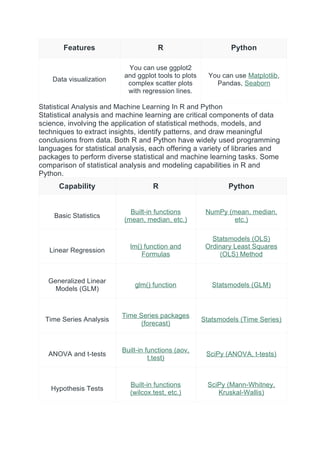
R vs Python
FeaturesR Python
Data collection
It is used for data
analysts to import data
from Excel, CSV, and
text files.
It is used in all kinds of
data formats including
SQL tables
Data exploration
It optimized for the
statistical analysis of
large datasets
You can explore data
with Pandas
Data modeling
It supports Tidyverse,
making it easy to
import, manipulate,
visualize, and report on
data.
You can use NumPy,
SciPy, scikit-learn,
TansorFlow
19.
Features R Python
Datavisualization
You can use ggplot2
and ggplot tools to plots
complex scatter plots
with regression lines.
You can use Matplotlib,
Pandas, Seaborn
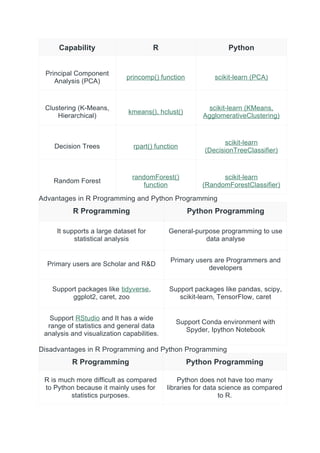
Statistical Analysis and Machine Learning In R and Python
Statistical analysis and machine learning are critical components of data
science, involving the application of statistical methods, models, and
techniques to extract insights, identify patterns, and draw meaningful
conclusions from data. Both R and Python have widely used programming
languages for statistical analysis, each offering a variety of libraries and
packages to perform diverse statistical and machine learning tasks. Some
comparison of statistical analysis and modeling capabilities in R and
Python.
Capability R Python
Basic Statistics
Built-in functions
(mean, median, etc.)
NumPy (mean, median,
etc.)
Linear Regression
lm() function and
Formulas
Statsmodels (OLS)
Ordinary Least Squares
(OLS) Method
Generalized Linear
Models (GLM)
glm() function Statsmodels (GLM)
Time Series Analysis
Time Series packages
(forecast)
Statsmodels (Time Series)
ANOVA and t-tests
Built-in functions (aov,
t.test)
SciPy (ANOVA, t-tests)
Hypothesis Tests
Built-in functions
(wilcox.test, etc.)
SciPy (Mann-Whitney,
Kruskal-Wallis)
20.
Capability R Python
PrincipalComponent
Analysis (PCA)
princomp() function scikit-learn (PCA)
Clustering (K-Means,
Hierarchical)
kmeans(), hclust()
scikit-learn (KMeans,
AgglomerativeClustering)
Decision Trees rpart() function
scikit-learn
(DecisionTreeClassifier)
Random Forest
randomForest()
function
scikit-learn
(RandomForestClassifier)
Advantages in R Programming and Python Programming
R Programming Python Programming
It supports a large dataset for
statistical analysis
General-purpose programming to use
data analyse
Primary users are Scholar and R&D
Primary users are Programmers and
developers
Support packages like tidyverse,
ggplot2, caret, zoo
Support packages like pandas, scipy,
scikit-learn, TensorFlow, caret
Support RStudio and It has a wide
range of statistics and general data
analysis and visualization capabilities.
Support Conda environment with
Spyder, Ipython Notebook
Disadvantages in R Programming and Python Programming
R Programming Python Programming
R is much more difficult as compared
to Python because it mainly uses for
statistics purposes.
Python does not have too many
libraries for data science as compared
to R.
21.
R Programming PythonProgramming
R might not be as fast as languages
like Python, especially for
computationally intensive tasks and
large-scale data processing.
Python might not be as specialized for
statistics and data analysis as R.
Some statistical functions and
visualization capabilities might be
more streamlined in R.
Memory management in R might not
be as efficient as in some other
languages, which can lead to
performance issues and memory-
related errors
Python visualization capabilities might
not be as polished and streamlined as
those offered by R's ggplot2.
R and Python usages in Data Science
Python and R programming language is most useful in data science and it
deals with identifying, representing, and extracting meaningful information
from data sources to be used to perform some business logic with these
languages. It has a popular package for Data collection, Data exploration,
Data modeling, Data visualization, and statical analysis.
Example in R and Python
Program for the addition of two numbers
# Python program to add two numbers
numb1 = 8
numb2 = 4
# Adding two numbers
sum = numb1 + numb2
# Printing the result
print("The sum is", sum)
Output
The sum is 12
![ Free and Open-Source: R is open to everyone, meaning users can
modify, share and distribute their work freely.
Designed for Data: R is built for data analysis, offering a
comprehensive set of tools for statistical computing and graphics.
Large Package Repository: The Comprehensive R Archive Network
(CRAN) offers thousands of add-on packages for specialized tasks.
Cross-Platform Compatibility: R can work on Windows, Mac and
Linux operating systems.
Great for Visualization: With packages like ggplot2, R makes it easy
to create informative, interactive charts and plots.
Key Features of R
Cross-Platform Support: R works on multiple operating systems,
making it versatile for different environments.
Interactive Development: R allows users to interactively experiment
with data and see the results immediately.
Data Wrangling: Tools like dplyr and tidyr help simplify data cleaning
and transformation.
Statistical Modeling: R has built-in support for various statistical
models like regression, time-series analysis and clustering.
Reproducible Research: With R Markdown, users can combine code,
output and narrative in one document, ensuring their analysis is
reproducible.
Example Program in R
To understand how R works, here’s a basic example where we calculate
the mean and standard deviation of a dataset:
We first create a vector data that contains numerical values.
We use the mean() function to calculate the mean of the dataset.
The sd() function calculates the standard deviation.
data <- c(5, 10, 15, 20, 25, 30, 35, 40, 45, 50)
mean_data <- mean(data)
print(paste("Mean: ", mean_data))
std_dev <- sd(data)
print(paste("Standard Deviation: ", std_dev))
Output:
[1] "Mean: 27.5"
[1] "Standard Deviation: 15.1382517704875"
Applications of R
R is used in a variety of fields, including:
Data Science and Machine Learning: R is widely used for data
analysis, statistical modeling and machine learning tasks.
Finance: Financial analysts use R for quantitative modeling and risk
analysis.](https://image.slidesharecdn.com/introductiontorstudio-250915190446-a8821623/85/Introduction-to-R-Studio-installation-R-studio-12-320.jpg)


![5G Explained! A High Level Overview [Introduction]](https://cdn.slidesharecdn.com/ss_thumbnails/5gexplainedahighleveloverview-260119165306-cc137a3e-thumbnail.jpg?width=640&height=640&fit=bounds)


