Download to read offline
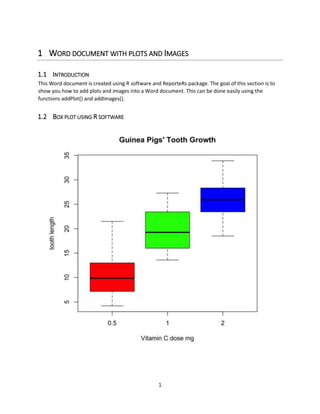

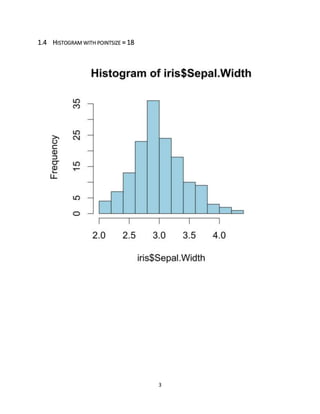

This Word document demonstrates how to add plots and images from R software using the ReporteRs package. It includes a box plot, histogram, and histogram with increased point size generated from R, as well as an image imported from an online source. The goal is to show users how to easily insert visualizations and pictures into Word documents directly from R.


