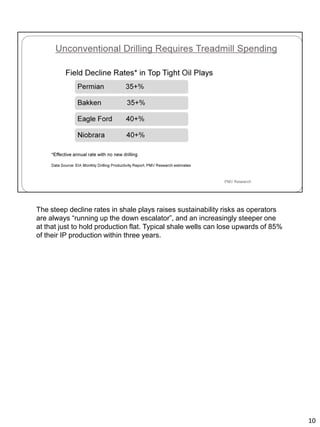
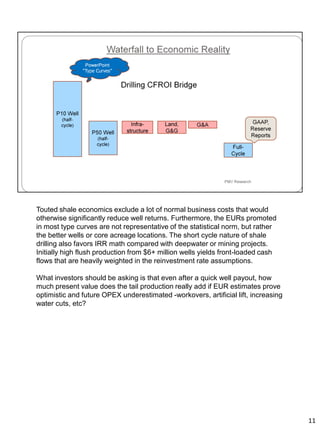
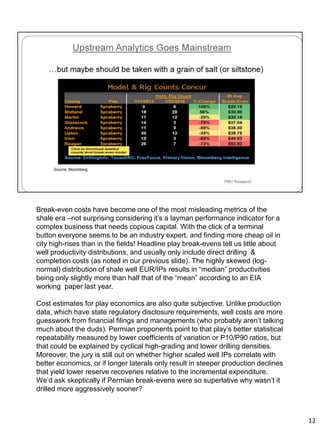
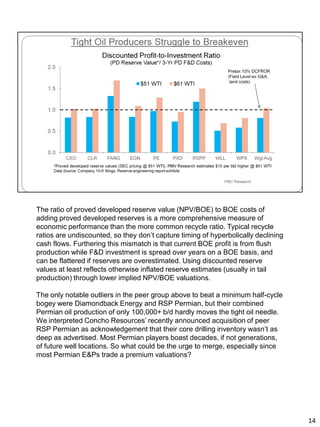
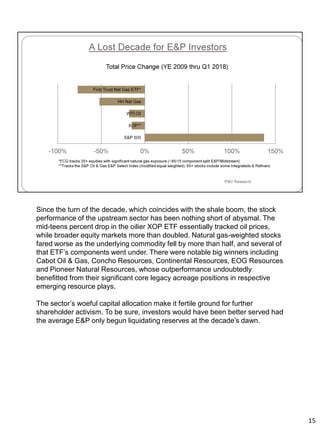
Our view on shale (namely tight oil) isn’t consensus in that we question its
sustainability and true economics. But having a variant view can be the right
call. Consider the mainstream narrative (heavily scripted by talking heads in
the financial media) over past few years of “lower for long” oil prices, because
the Permian had usurped OPEC as the new low cost swing supplier. Well, in
less than two years the price of the world’s most important and widely followed
commodity more than doubled.
In this presentation I’ll be using the terms “shale”, “tight oil” and
“unconventional” interchangeably. Unconventional oil & gas reserves require
horizontal drilling and intensive multi-stage fracturing to commercially access
very low permeability reservoirs, which are also often the source rock.
Unconventional oil is technically tight oil, and not a true shale since the
reservoir rock includes other sedimentary rocks such as sandstones and
carbonates, unlike the Marcellus gas play which is true shale.
1
Because I’m presenting at a mining focused conference, I’d like to put US
shale in context with other resource commodities competing for capital.
Domestic unconventional oil & gas alone is on par with the largest non-energy
global commodity markets, but much bigger in terms of annual capital
allocation given its natural depletion and consumable demand. The bubble
size of the global oil market would fill most of the chart if shown.
2
While growth in tight oil over past several years has been nothing short of
remarkable, it largely occurred during a period of high prices, with WTI north of
$90 per barrel.
3
Many pundits (often the same who thought oil wouldn’t breach $50) believe
that domestic resource plays are upending historic supply dynamics, and
rendering OPEC irrelevant. But consider that horizontal Permian oil production
is barely 2% and 6% of global and OPEC output, respectively. The collapse of
despotic Venezuela output alone largely offset the 1 mm bb/d increase in
Permian tight oil over the past three years. A recent EIA (notable shale
optimists) report on future global supply growth projects that the Middle East
will be increasingly more relevant, not less.
4
Shale gas production also had impressive growth in recent years, led by the
Marcellus/Utica and associated gas from tight oil plays. Collectively “other”
areas remained flattish with any production gains more than offset by secular
declines in the Barnett and Fayetteville shale. Conventional production (not
shown in chart) dropped from 42 Bcf/d to barely 20 Bcf/d, a shortfall that was
essentially replaced by the Marcellus over this period.
Note that associated natural gas production figures often cited (erroneously)
from the EIA’s Monthly DPR report are two-stream, and include NGLs. In the
Permian this can account for 20% of total equivalent production, or half of the
non-oil (two) stream output.
5
Over the past seven years, the combined production of leading natural gas
producers remained essentially flat despite a one-third increase in industry
output. Meanwhile, large gas consumer industries (utilities, power
generatation, chemicals) have been consolidating, and long-haul gas pipelines
remain near monopolies. It’s obvious that gas producers, especially those in
Canada, need more bargaining power with transporters considering that
moving gas out of basin is often their single largest cost, and where any
resource rents seem to be mostly accruing.
During this period of strong production growth led by new shale sources,
natural gas prices declined significantly from near $4.50 /Mcf for both the
Henry Hub and Appalachian (Dominion South Point) benchmarks to barely
$3/Mcf and $2/Mcf, respectively. The shares of most gas-weighted E&Ps
followed suit, with the better performers barely appreciating despite solid
underlying production growth (COG being a notable exception). Clearly, the
market has weighed in that the marginal cost of supply hasn’t fallen nearly as
much as implied by prices, making a strong argument for rationalizing
overproduction.
6
7
Many attribute the surge in Permian drilling during the oil price downturn to its
inherently lower break-evens. While the Permian was less horizontally drilled
than the Bakken and Eagle Ford, plummeting fracking costs significantly
enhanced the economics in microdarcy reservoirs. We estimate the
exogenous one-third decline in oil service costs was equivalent to a nearly $20
per barrel revenue uplift: $40 oil suddenly became the new $60, with eager
investors unfazed by the carnage around them in yesteryear shale plays.
Hydraulic sand prices are a decent proxy of service cost trends as proppants
account for ~15% of total well costs, and one-third of the usually larger
completion portion.
8
The consensus holds that shale has lowered and flattened oil & gas supply
cost curves. So with unconventional production increasing from only a fraction
to more than half of equivalent domestic output over the past decade, one
would expect depletion rates (a reasonable F&D cost proxy) to decline rather
than rise.
GAAP-based metrics at some point must be correlative with underlying
economics, even for exhaustive industries which often get a bye from investors
and analysts because of their specialized accounting. Note that the slight
DD&A improvement in 2016 was due to $140 billion in impairment charges
taken in 2015, which lowered the amortization cost pool for subsequent years.
9
The steep decline rates in shale plays raises sustainability risks as operators
are always “running up the down escalator”, and an increasingly steeper one
at that just to hold production flat. Typical shale wells can lose upwards of 85%
of their IP production within three years.
10
Touted shale economics exclude a lot of normal business costs that would
otherwise significantly reduce well returns. Furthermore, the EURs promoted
in most type curves are not representative of the statistical norm, but rather
the better wells or core acreage locations. The short cycle nature of shale
drilling also favors IRR math compared with deepwater or mining projects.
Initially high flush production from $6+ million wells yields front-loaded cash
flows that are heavily weighted in the reinvestment rate assumptions.
What investors should be asking is that even after a quick well payout, how
much present value does the tail production really add if EUR estimates prove
optimistic and future OPEX underestimated -workovers, artificial lift, increasing
water cuts, etc?
11
Break-even costs have become one of the most misleading metrics of the
shale era –not surprising considering it’s a layman performance indicator for a
complex business that needs copious capital. With the click of a terminal
button everyone seems to be an industry expert, and finding more cheap oil in
city high-rises than in the fields! Headline play break-evens tell us little about
well productivity distributions, and usually only include direct drilling &
completion costs (as noted in our previous slide). The highly skewed (log-
normal) distribution of shale well EUR/IPs results in “median” productivities
being only slightly more than half that of the “mean” according to an EIA
working paper last year.
Cost estimates for play economics are also quite subjective. Unlike production
data, which have state regulatory disclosure requirements, well costs are more
guesswork from financial filings and managements (who probably aren‘t talking
much about the duds). Permian proponents point to that play’s better statistical
repeatability measured by lower coefficients of variation or P10/P90 ratios, but
that could be explained by cyclical high-grading and lower drilling densities.
Moreover, the jury is still out on whether higher scaled well IPs correlate with
better economics, or if longer laterals only result in steeper production declines
that yield lower reserve recoveries relative to the incremental expenditure.
We’d ask skeptically if Permian break-evens were so superlative why wasn’t it
drilled more aggressively sooner?
12
Shale wells are characterized by high IP rates that decline very steeply during
the transient flow regime, when traditional decline curve analysis isn’t
appropriate. If lawyers and reserve engineers are warning us in public filings
that oil & gas bookings are less certain in unconventional plays with limited
production history, then resource claims should hardly be conflated with the
more restrictive reserve category, as done in many investor presentations and
analyst reports.
Even the hyped USGS assessment of the Permian Wolfcamp potential a
couple years ago had bigger than fine print that said while these yet to be
discovered resources are “technically recoverable” given new drilling and
completion technologies, their commerciality (the only thing investors should
care about!) “has not been evaluated.” The agency made a similar magnitude
resource proclamation of California’s Monterey shale oil in 2011, only to slash
their estimates by a whopping 99% a few years later.
13
The ratio of proved developed reserve value (NPV/BOE) to BOE costs of
adding proved developed reserves is a more comprehensive measure of
economic performance than the more common recycle ratio. Typical recycle
ratios are undiscounted, so they don’t capture timing of hyperbolically declining
cash flows. Furthering this mismatch is that current BOE profit is from flush
production while F&D investment is spread over years on a BOE basis, and
can be flattered if reserves are overestimated. Using discounted reserve
values at least reflects otherwise inflated reserve estimates (usually in tail
production) through lower implied NPV/BOE valuations.
The only notable outliers in the peer group above to beat a minimum half-cycle
bogey were Diamondback Energy and RSP Permian, but their combined
Permian oil production of only 100,000+ b/d hardly moves the tight oil needle.
We interpreted Concho Resources’ recently announced acquisition of peer
RSP Permian as acknowledgement that their core drilling inventory wasn’t as
deep as advertised. Most Permian players boast decades, if not generations,
of future well locations. So what could be the urge to merge, especially since
most Permian E&Ps trade a premium valuations?
14
Since the turn of the decade, which coincides with the shale boom, the stock
performance of the upstream sector has been nothing short of abysmal. The
mid-teens percent drop in the oilier XOP ETF essentially tracked oil prices,
while broader equity markets more than doubled. Natural gas-weighted stocks
fared worse as the underlying commodity fell by more than half, and several of
that ETF’s components went under. There were notable big winners including
Cabot Oil & Gas, Concho Resources, Continental Resources, EOG Resources
and Pioneer Natural Resources, whose outperformance undoubtedly
benefitted from their significant core legacy acreage positions in respective
emerging resource plays.
The sector’s woeful capital allocation make it fertile ground for further
shareholder activism. To be sure, investors would have been better served had
the average E&P only begun liquidating reserves at the decade’s dawn.
15
16

High on Frack: Outlook for US Shale

  • 1.
    Our view onshale (namely tight oil) isn’t consensus in that we question its sustainability and true economics. But having a variant view can be the right call. Consider the mainstream narrative (heavily scripted by talking heads in the financial media) over past few years of “lower for long” oil prices, because the Permian had usurped OPEC as the new low cost swing supplier. Well, in less than two years the price of the world’s most important and widely followed commodity more than doubled. In this presentation I’ll be using the terms “shale”, “tight oil” and “unconventional” interchangeably. Unconventional oil & gas reserves require horizontal drilling and intensive multi-stage fracturing to commercially access very low permeability reservoirs, which are also often the source rock. Unconventional oil is technically tight oil, and not a true shale since the reservoir rock includes other sedimentary rocks such as sandstones and carbonates, unlike the Marcellus gas play which is true shale. 1
  • 2.
    Because I’m presentingat a mining focused conference, I’d like to put US shale in context with other resource commodities competing for capital. Domestic unconventional oil & gas alone is on par with the largest non-energy global commodity markets, but much bigger in terms of annual capital allocation given its natural depletion and consumable demand. The bubble size of the global oil market would fill most of the chart if shown. 2
  • 3.
    While growth intight oil over past several years has been nothing short of remarkable, it largely occurred during a period of high prices, with WTI north of $90 per barrel. 3
  • 4.
    Many pundits (oftenthe same who thought oil wouldn’t breach $50) believe that domestic resource plays are upending historic supply dynamics, and rendering OPEC irrelevant. But consider that horizontal Permian oil production is barely 2% and 6% of global and OPEC output, respectively. The collapse of despotic Venezuela output alone largely offset the 1 mm bb/d increase in Permian tight oil over the past three years. A recent EIA (notable shale optimists) report on future global supply growth projects that the Middle East will be increasingly more relevant, not less. 4
  • 5.
    Shale gas productionalso had impressive growth in recent years, led by the Marcellus/Utica and associated gas from tight oil plays. Collectively “other” areas remained flattish with any production gains more than offset by secular declines in the Barnett and Fayetteville shale. Conventional production (not shown in chart) dropped from 42 Bcf/d to barely 20 Bcf/d, a shortfall that was essentially replaced by the Marcellus over this period. Note that associated natural gas production figures often cited (erroneously) from the EIA’s Monthly DPR report are two-stream, and include NGLs. In the Permian this can account for 20% of total equivalent production, or half of the non-oil (two) stream output. 5
  • 6.
    Over the pastseven years, the combined production of leading natural gas producers remained essentially flat despite a one-third increase in industry output. Meanwhile, large gas consumer industries (utilities, power generatation, chemicals) have been consolidating, and long-haul gas pipelines remain near monopolies. It’s obvious that gas producers, especially those in Canada, need more bargaining power with transporters considering that moving gas out of basin is often their single largest cost, and where any resource rents seem to be mostly accruing. During this period of strong production growth led by new shale sources, natural gas prices declined significantly from near $4.50 /Mcf for both the Henry Hub and Appalachian (Dominion South Point) benchmarks to barely $3/Mcf and $2/Mcf, respectively. The shares of most gas-weighted E&Ps followed suit, with the better performers barely appreciating despite solid underlying production growth (COG being a notable exception). Clearly, the market has weighed in that the marginal cost of supply hasn’t fallen nearly as much as implied by prices, making a strong argument for rationalizing overproduction. 6
  • 7.
  • 8.
    Many attribute thesurge in Permian drilling during the oil price downturn to its inherently lower break-evens. While the Permian was less horizontally drilled than the Bakken and Eagle Ford, plummeting fracking costs significantly enhanced the economics in microdarcy reservoirs. We estimate the exogenous one-third decline in oil service costs was equivalent to a nearly $20 per barrel revenue uplift: $40 oil suddenly became the new $60, with eager investors unfazed by the carnage around them in yesteryear shale plays. Hydraulic sand prices are a decent proxy of service cost trends as proppants account for ~15% of total well costs, and one-third of the usually larger completion portion. 8
  • 9.
    The consensus holdsthat shale has lowered and flattened oil & gas supply cost curves. So with unconventional production increasing from only a fraction to more than half of equivalent domestic output over the past decade, one would expect depletion rates (a reasonable F&D cost proxy) to decline rather than rise. GAAP-based metrics at some point must be correlative with underlying economics, even for exhaustive industries which often get a bye from investors and analysts because of their specialized accounting. Note that the slight DD&A improvement in 2016 was due to $140 billion in impairment charges taken in 2015, which lowered the amortization cost pool for subsequent years. 9
  • 10.
    The steep declinerates in shale plays raises sustainability risks as operators are always “running up the down escalator”, and an increasingly steeper one at that just to hold production flat. Typical shale wells can lose upwards of 85% of their IP production within three years. 10
  • 11.
    Touted shale economicsexclude a lot of normal business costs that would otherwise significantly reduce well returns. Furthermore, the EURs promoted in most type curves are not representative of the statistical norm, but rather the better wells or core acreage locations. The short cycle nature of shale drilling also favors IRR math compared with deepwater or mining projects. Initially high flush production from $6+ million wells yields front-loaded cash flows that are heavily weighted in the reinvestment rate assumptions. What investors should be asking is that even after a quick well payout, how much present value does the tail production really add if EUR estimates prove optimistic and future OPEX underestimated -workovers, artificial lift, increasing water cuts, etc? 11
  • 12.
    Break-even costs havebecome one of the most misleading metrics of the shale era –not surprising considering it’s a layman performance indicator for a complex business that needs copious capital. With the click of a terminal button everyone seems to be an industry expert, and finding more cheap oil in city high-rises than in the fields! Headline play break-evens tell us little about well productivity distributions, and usually only include direct drilling & completion costs (as noted in our previous slide). The highly skewed (log- normal) distribution of shale well EUR/IPs results in “median” productivities being only slightly more than half that of the “mean” according to an EIA working paper last year. Cost estimates for play economics are also quite subjective. Unlike production data, which have state regulatory disclosure requirements, well costs are more guesswork from financial filings and managements (who probably aren‘t talking much about the duds). Permian proponents point to that play’s better statistical repeatability measured by lower coefficients of variation or P10/P90 ratios, but that could be explained by cyclical high-grading and lower drilling densities. Moreover, the jury is still out on whether higher scaled well IPs correlate with better economics, or if longer laterals only result in steeper production declines that yield lower reserve recoveries relative to the incremental expenditure. We’d ask skeptically if Permian break-evens were so superlative why wasn’t it drilled more aggressively sooner? 12
  • 13.
    Shale wells arecharacterized by high IP rates that decline very steeply during the transient flow regime, when traditional decline curve analysis isn’t appropriate. If lawyers and reserve engineers are warning us in public filings that oil & gas bookings are less certain in unconventional plays with limited production history, then resource claims should hardly be conflated with the more restrictive reserve category, as done in many investor presentations and analyst reports. Even the hyped USGS assessment of the Permian Wolfcamp potential a couple years ago had bigger than fine print that said while these yet to be discovered resources are “technically recoverable” given new drilling and completion technologies, their commerciality (the only thing investors should care about!) “has not been evaluated.” The agency made a similar magnitude resource proclamation of California’s Monterey shale oil in 2011, only to slash their estimates by a whopping 99% a few years later. 13
  • 14.
    The ratio ofproved developed reserve value (NPV/BOE) to BOE costs of adding proved developed reserves is a more comprehensive measure of economic performance than the more common recycle ratio. Typical recycle ratios are undiscounted, so they don’t capture timing of hyperbolically declining cash flows. Furthering this mismatch is that current BOE profit is from flush production while F&D investment is spread over years on a BOE basis, and can be flattered if reserves are overestimated. Using discounted reserve values at least reflects otherwise inflated reserve estimates (usually in tail production) through lower implied NPV/BOE valuations. The only notable outliers in the peer group above to beat a minimum half-cycle bogey were Diamondback Energy and RSP Permian, but their combined Permian oil production of only 100,000+ b/d hardly moves the tight oil needle. We interpreted Concho Resources’ recently announced acquisition of peer RSP Permian as acknowledgement that their core drilling inventory wasn’t as deep as advertised. Most Permian players boast decades, if not generations, of future well locations. So what could be the urge to merge, especially since most Permian E&Ps trade a premium valuations? 14
  • 15.
    Since the turnof the decade, which coincides with the shale boom, the stock performance of the upstream sector has been nothing short of abysmal. The mid-teens percent drop in the oilier XOP ETF essentially tracked oil prices, while broader equity markets more than doubled. Natural gas-weighted stocks fared worse as the underlying commodity fell by more than half, and several of that ETF’s components went under. There were notable big winners including Cabot Oil & Gas, Concho Resources, Continental Resources, EOG Resources and Pioneer Natural Resources, whose outperformance undoubtedly benefitted from their significant core legacy acreage positions in respective emerging resource plays. The sector’s woeful capital allocation make it fertile ground for further shareholder activism. To be sure, investors would have been better served had the average E&P only begun liquidating reserves at the decade’s dawn. 15
  • 16.