Downloaded 1,289 times

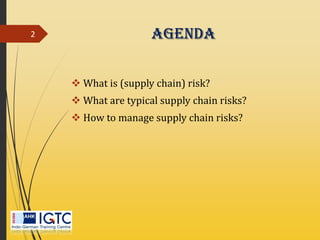
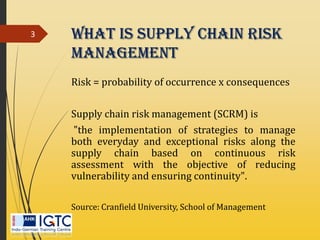


The document discusses supply chain risk management (SCRM), defining it as the implementation of strategies to manage everyday and exceptional risks within supply chains to ensure continuity. It outlines various types of supply chain risks, such as supply, process, demand, network, control, and environmental risks, while emphasizing the importance of risk assessment and management practices. Additionally, the document highlights agile practices and globalization as key components in building robust and resilient supply chains capable of responding to disruptions.