Downloaded 294 times


![(2)Coefficient of Variation(V)
Relative measure of risk
Ratio of S.D(σ) to Expected Profit [E(∏)]
Lower the V better the risk-return trade off](https://image.slidesharecdn.com/riskanalysischapter-130816025016-phpapp01/85/Risk-analysis-Chapter-30-320.jpg)
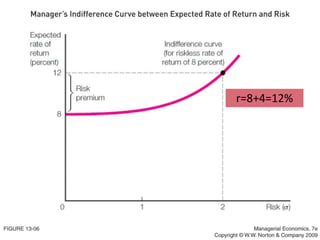


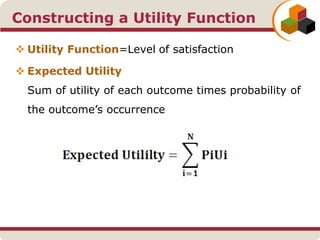
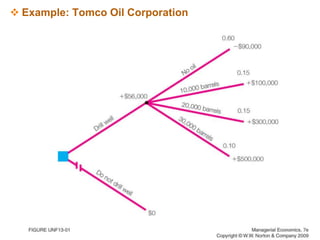
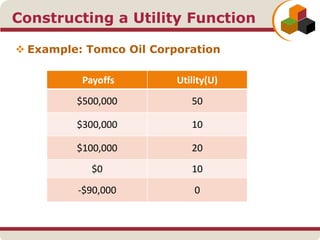
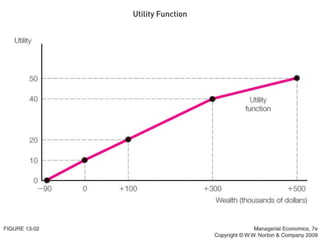
The document discusses risk analysis and decision-making tools for managers, focusing on concepts such as expected value, probability distributions, and techniques to reduce uncertainty. It covers the definition and measurement of risk, including standard deviation and coefficient of variation, as well as the expected value of perfect information (EVPI). The text also explores attitudes toward risk using utility functions and the certainty equivalent approach to assess investment decisions.