Downloaded 1,645 times
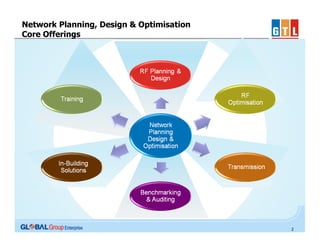
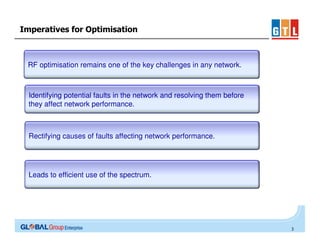
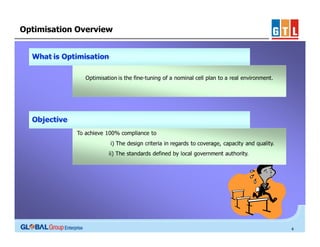
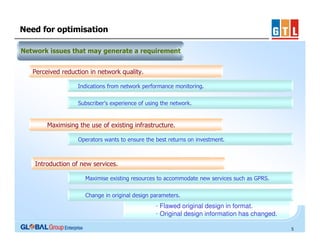
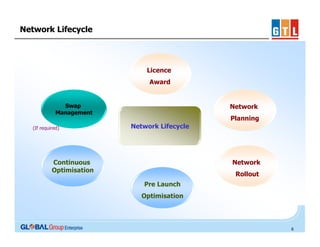
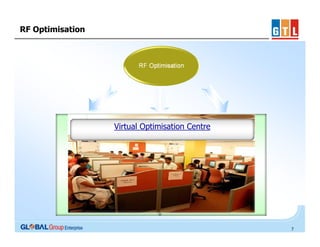
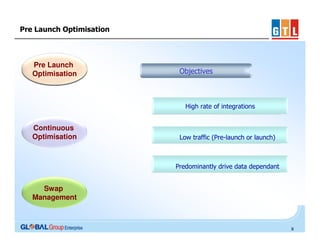
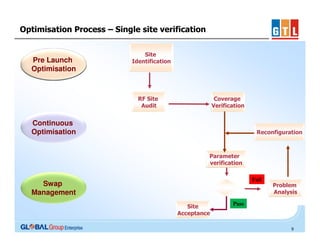
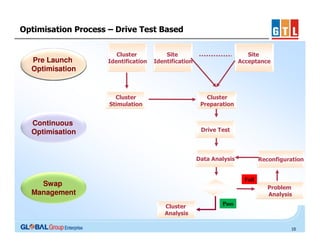
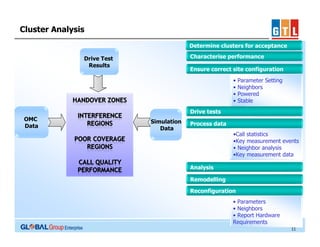
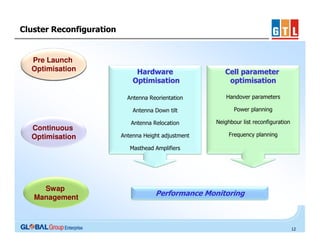
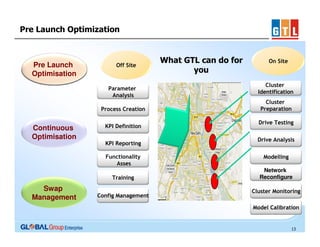
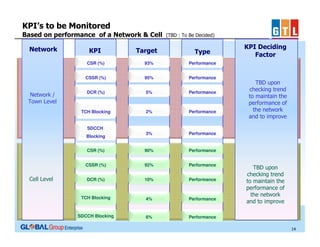
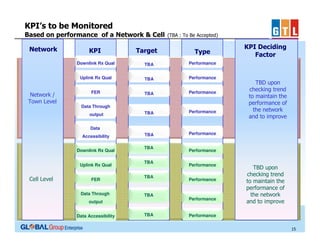
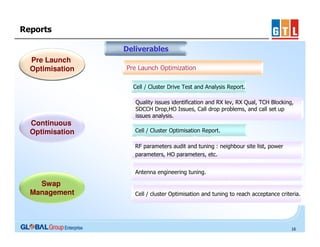
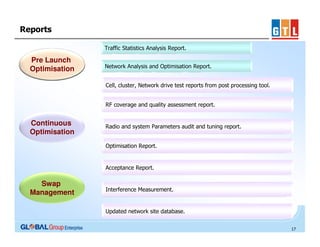
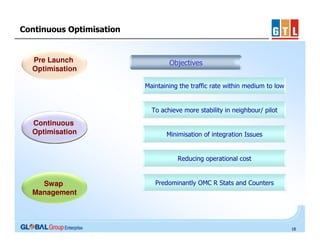
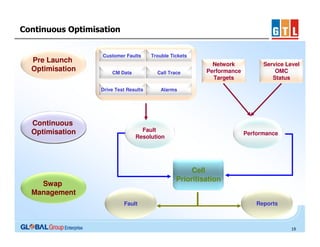
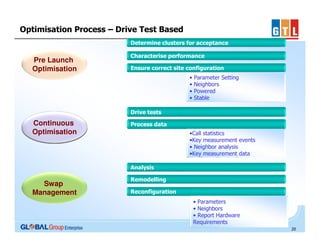
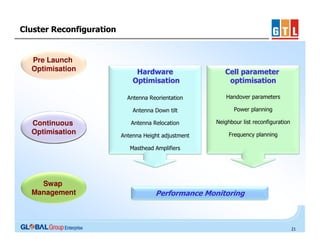
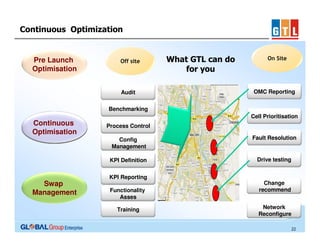
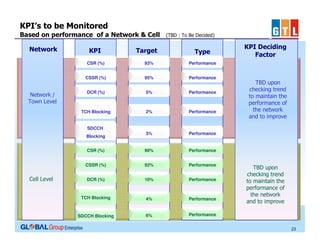
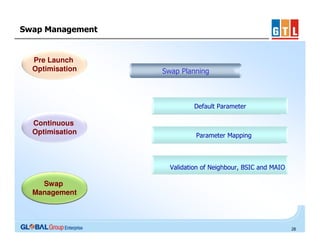
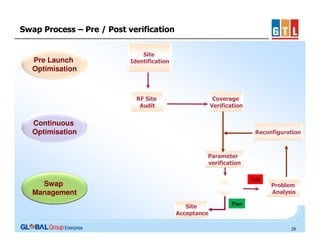
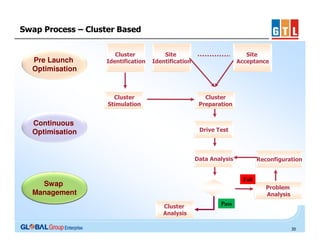
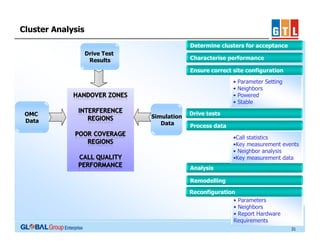
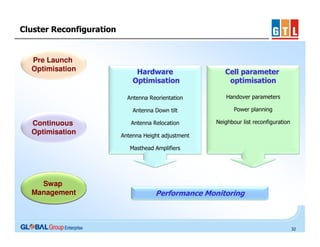
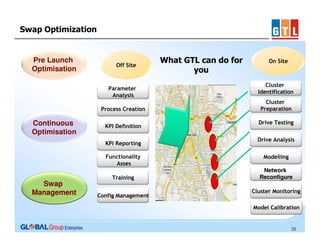

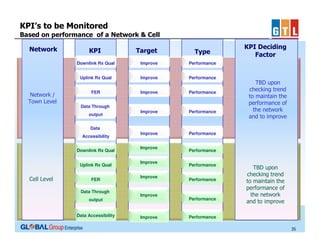
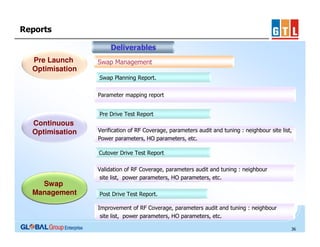
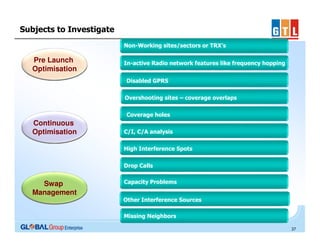
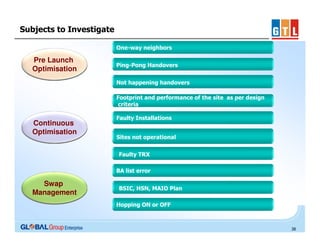
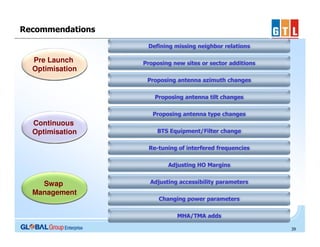
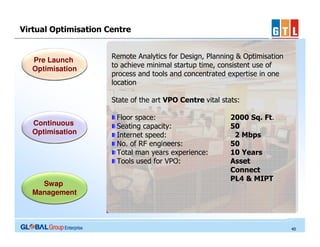
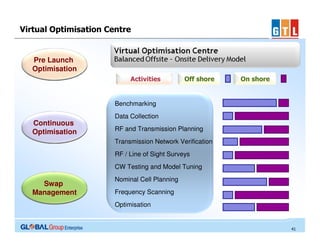
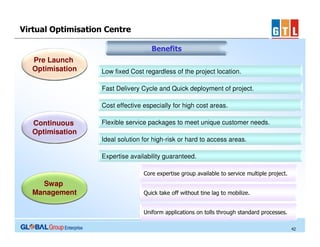


RF optimisation aims to identify and resolve potential faults in the network before they affect performance through activities like pre-launch optimisation, continuous optimisation, and swap management. Key aspects of optimisation include drive testing, parameter tuning, antenna adjustments, and monitoring KPIs to maintain network quality. GTL provides end-to-end optimisation services both on-site and through a virtual optimisation centre with remote analytics, tools, and concentrated RF expertise.


![13 gsm bss network kpi (network interference) optimization manual[1].doc](https://cdn.slidesharecdn.com/ss_thumbnails/13gsmbssnetworkkpinetworkinterferenceoptimizationmanual1-140618022430-phpapp01-thumbnail.jpg?width=640&height=640&fit=bounds)


