Download as PDF, PPTX

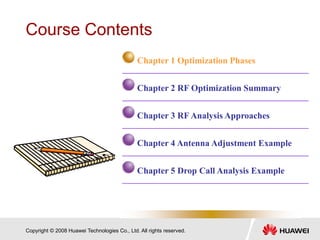
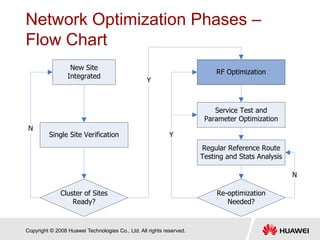
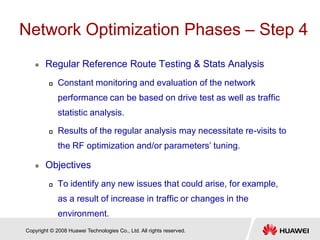
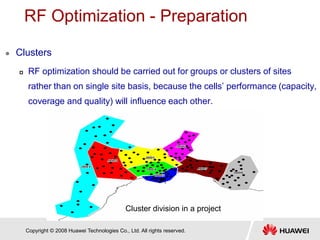
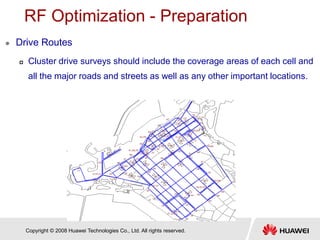
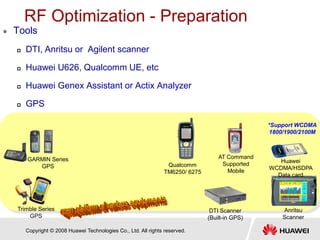
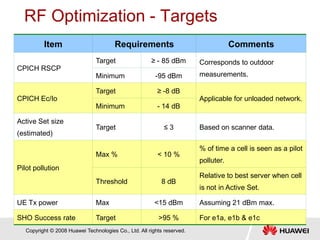
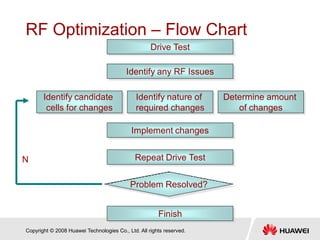
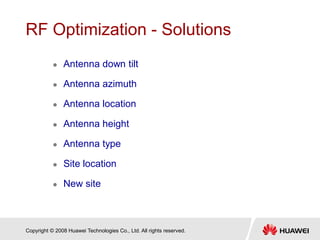
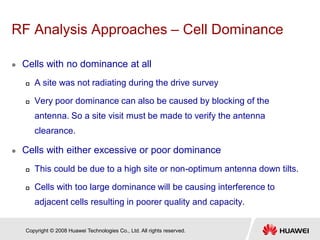
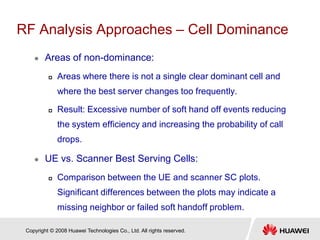
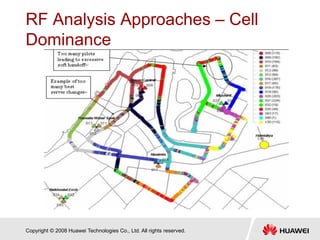
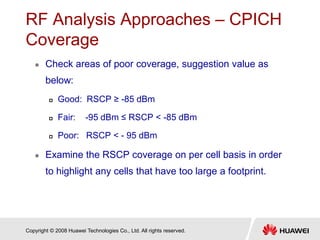
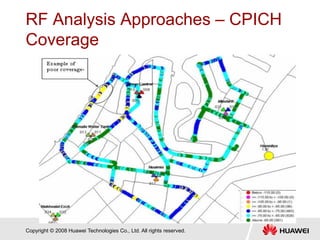
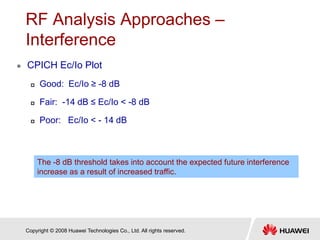
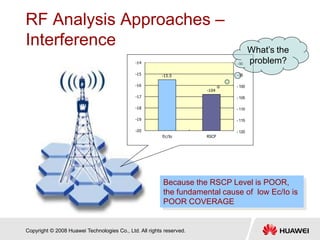
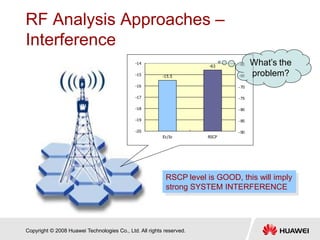
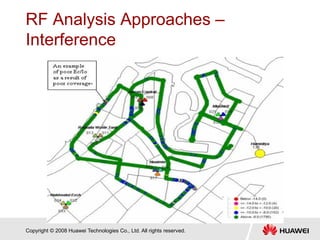
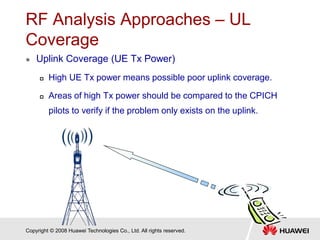
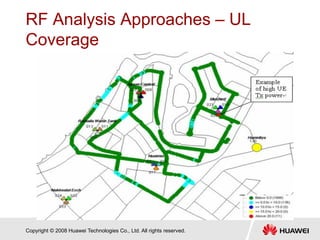
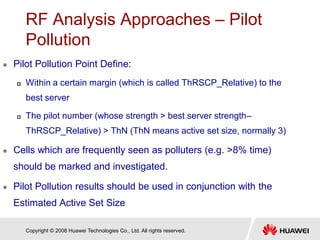
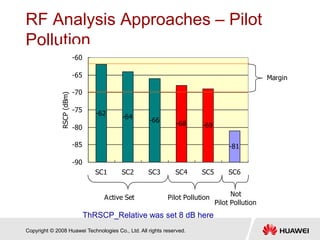
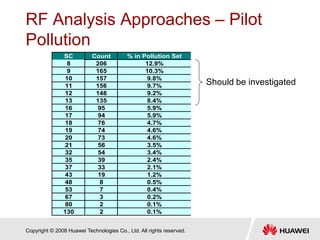
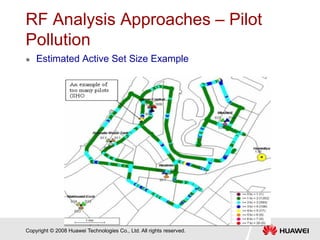
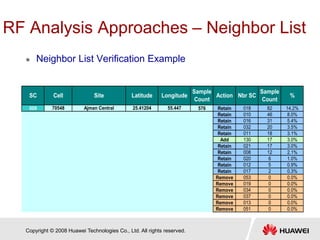
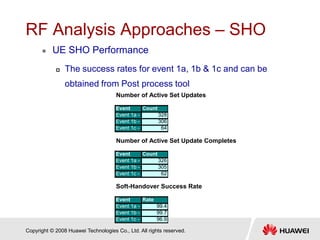
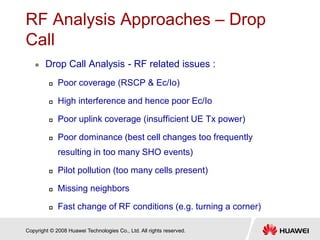
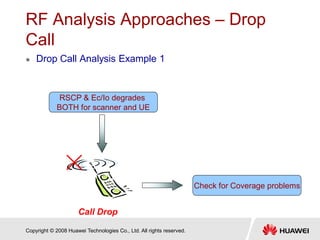
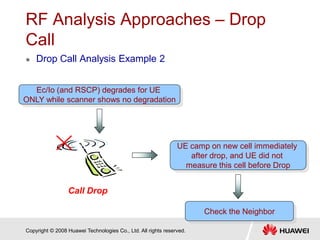
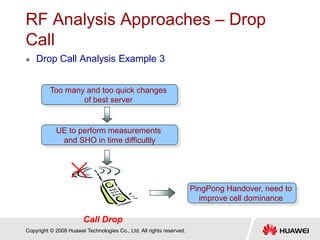
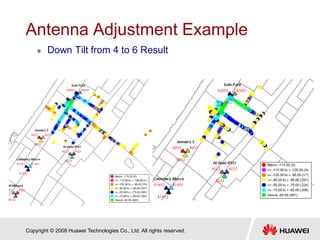
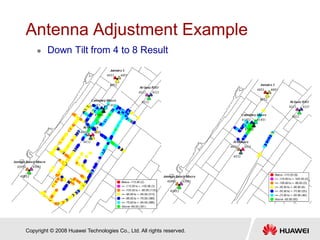
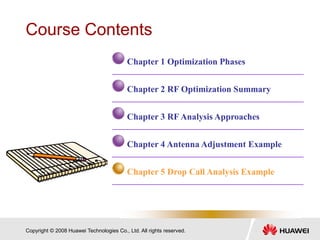
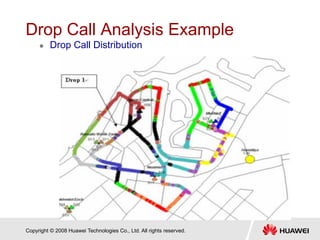
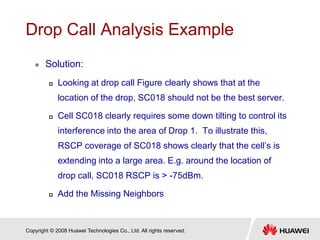


The document discusses optimization of 3G radio networks, focusing on the RF Optimization phase. It describes the various stages of network optimization including single site verification, RF optimization of clusters of sites, parameter optimization testing, and ongoing reference route testing and analysis. The RF Optimization process involves preparing clusters and drive routes, analyzing data to identify issues, determining solutions such as antenna adjustments, implementing changes, and retesting. Analysis approaches discussed include examining cell dominance, coverage, interference, uplink coverage, pilot pollution, neighbor lists, soft handover performance, and drop calls.


![W(level3) wcdma rno rf optimization-20041217-a-1[1].0](https://cdn.slidesharecdn.com/ss_thumbnails/wlevel3-wcdmarnorfoptimization-20041217-a-11-0-120122084046-phpapp01-thumbnail.jpg?width=640&height=640&fit=bounds)


![Getting Started with Apache Spark: Big Data Made Simple [Free Meetup]](https://cdn.slidesharecdn.com/ss_thumbnails/apachesparkgettingstarted-260203175547-8361bcc3-thumbnail.jpg?width=640&height=640&fit=bounds)


