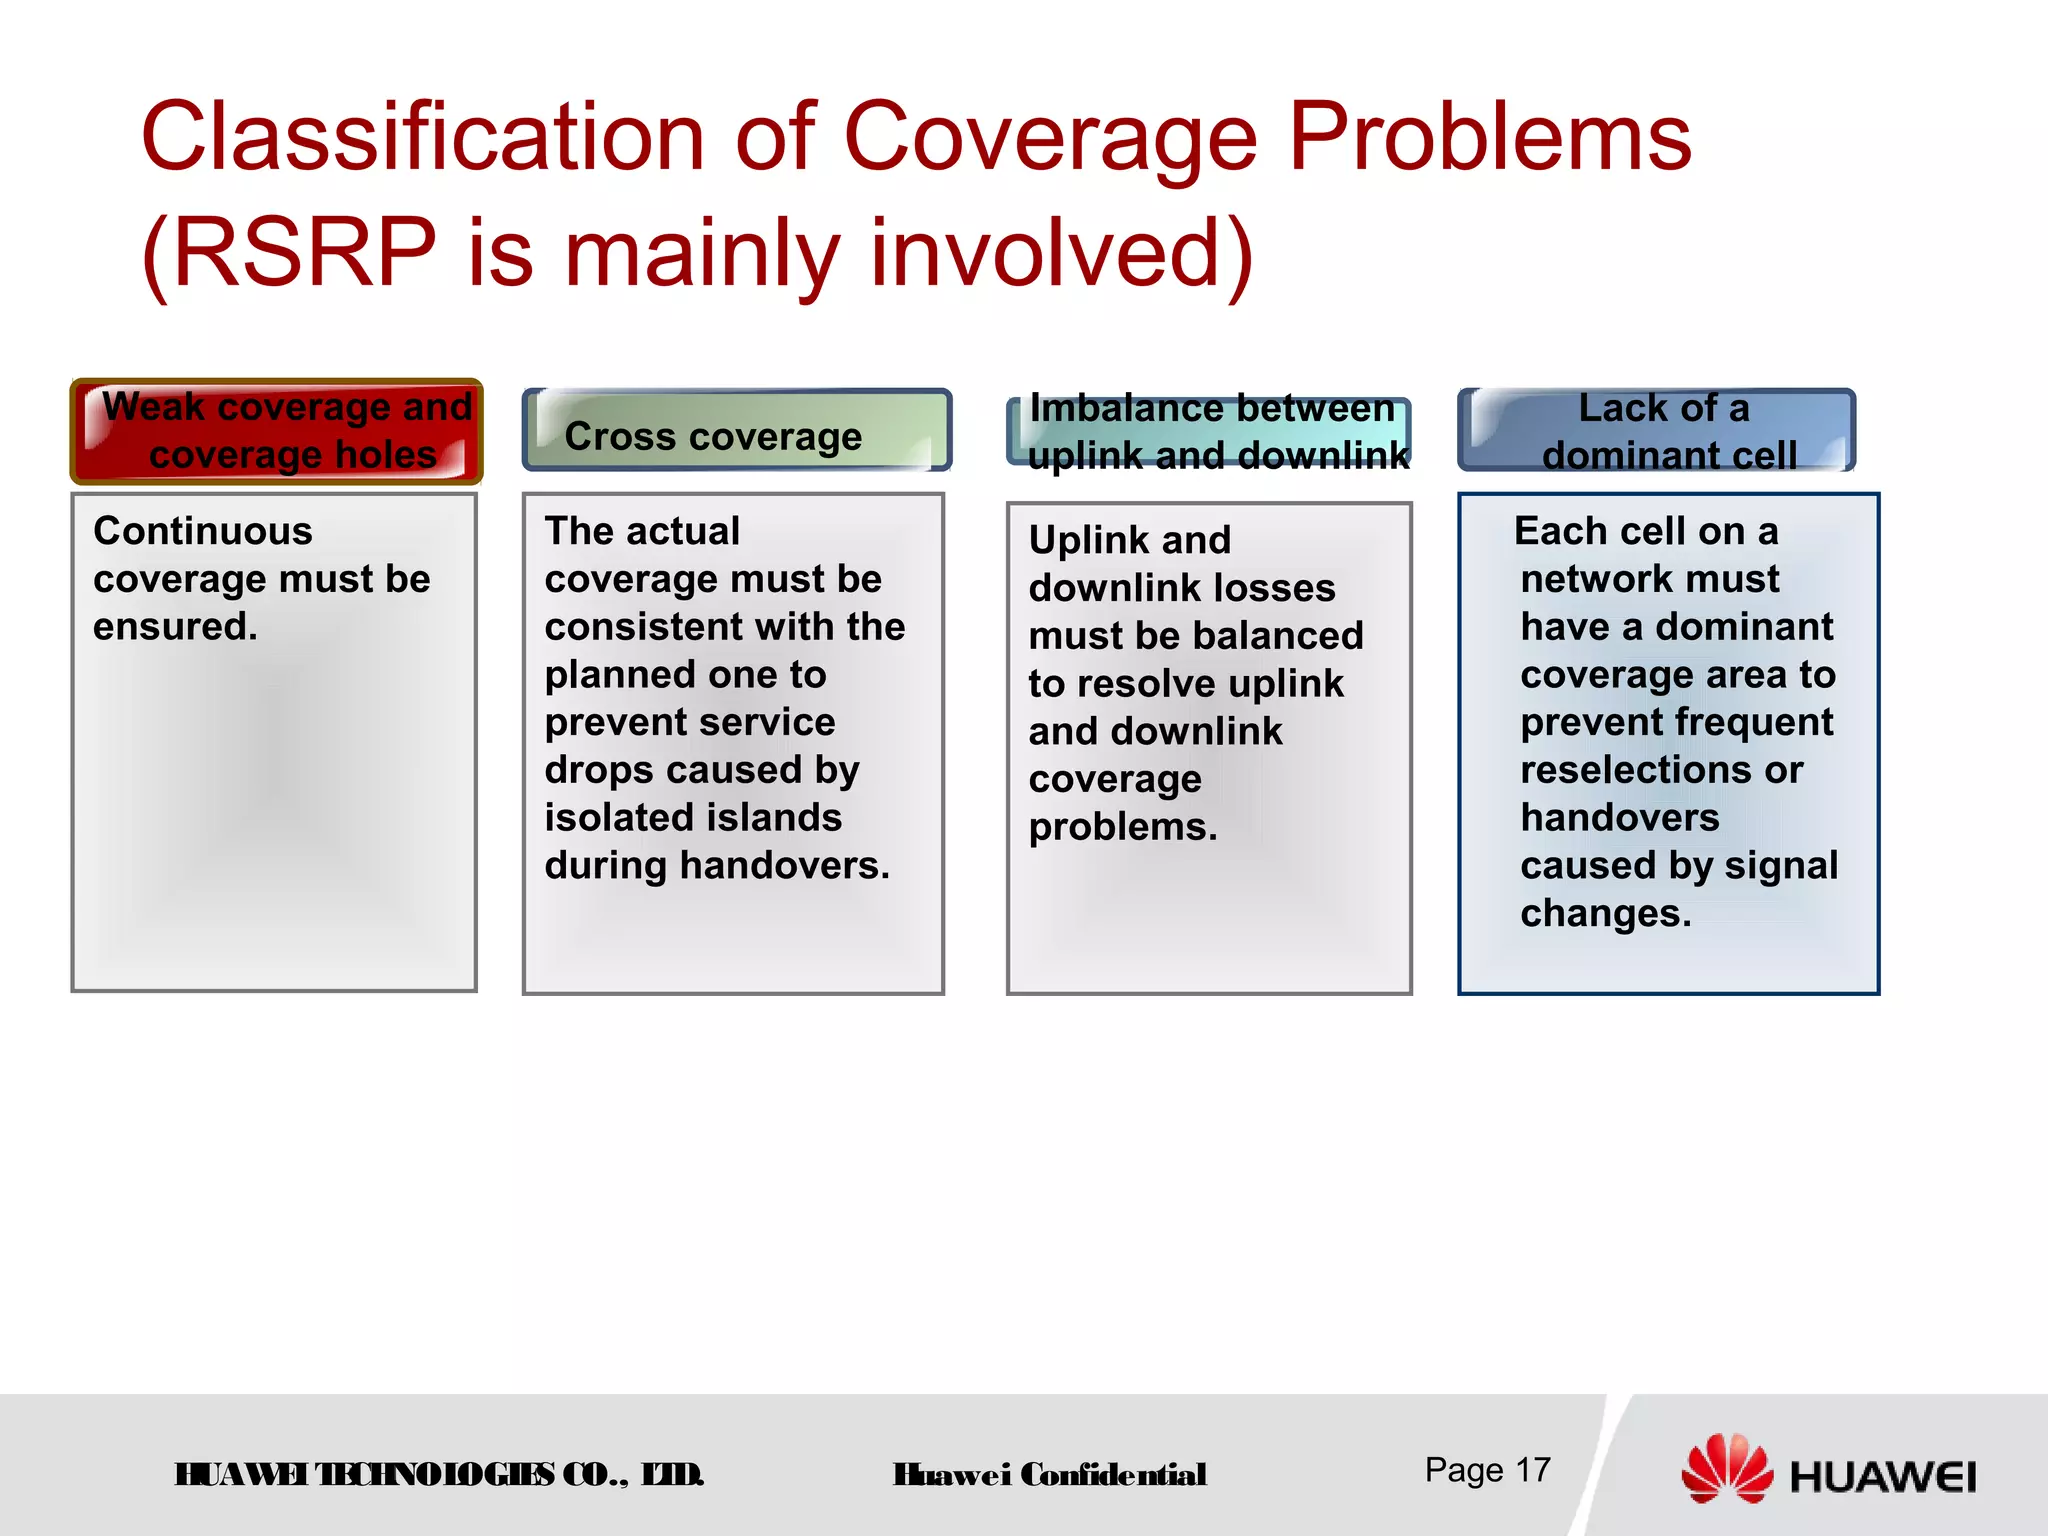
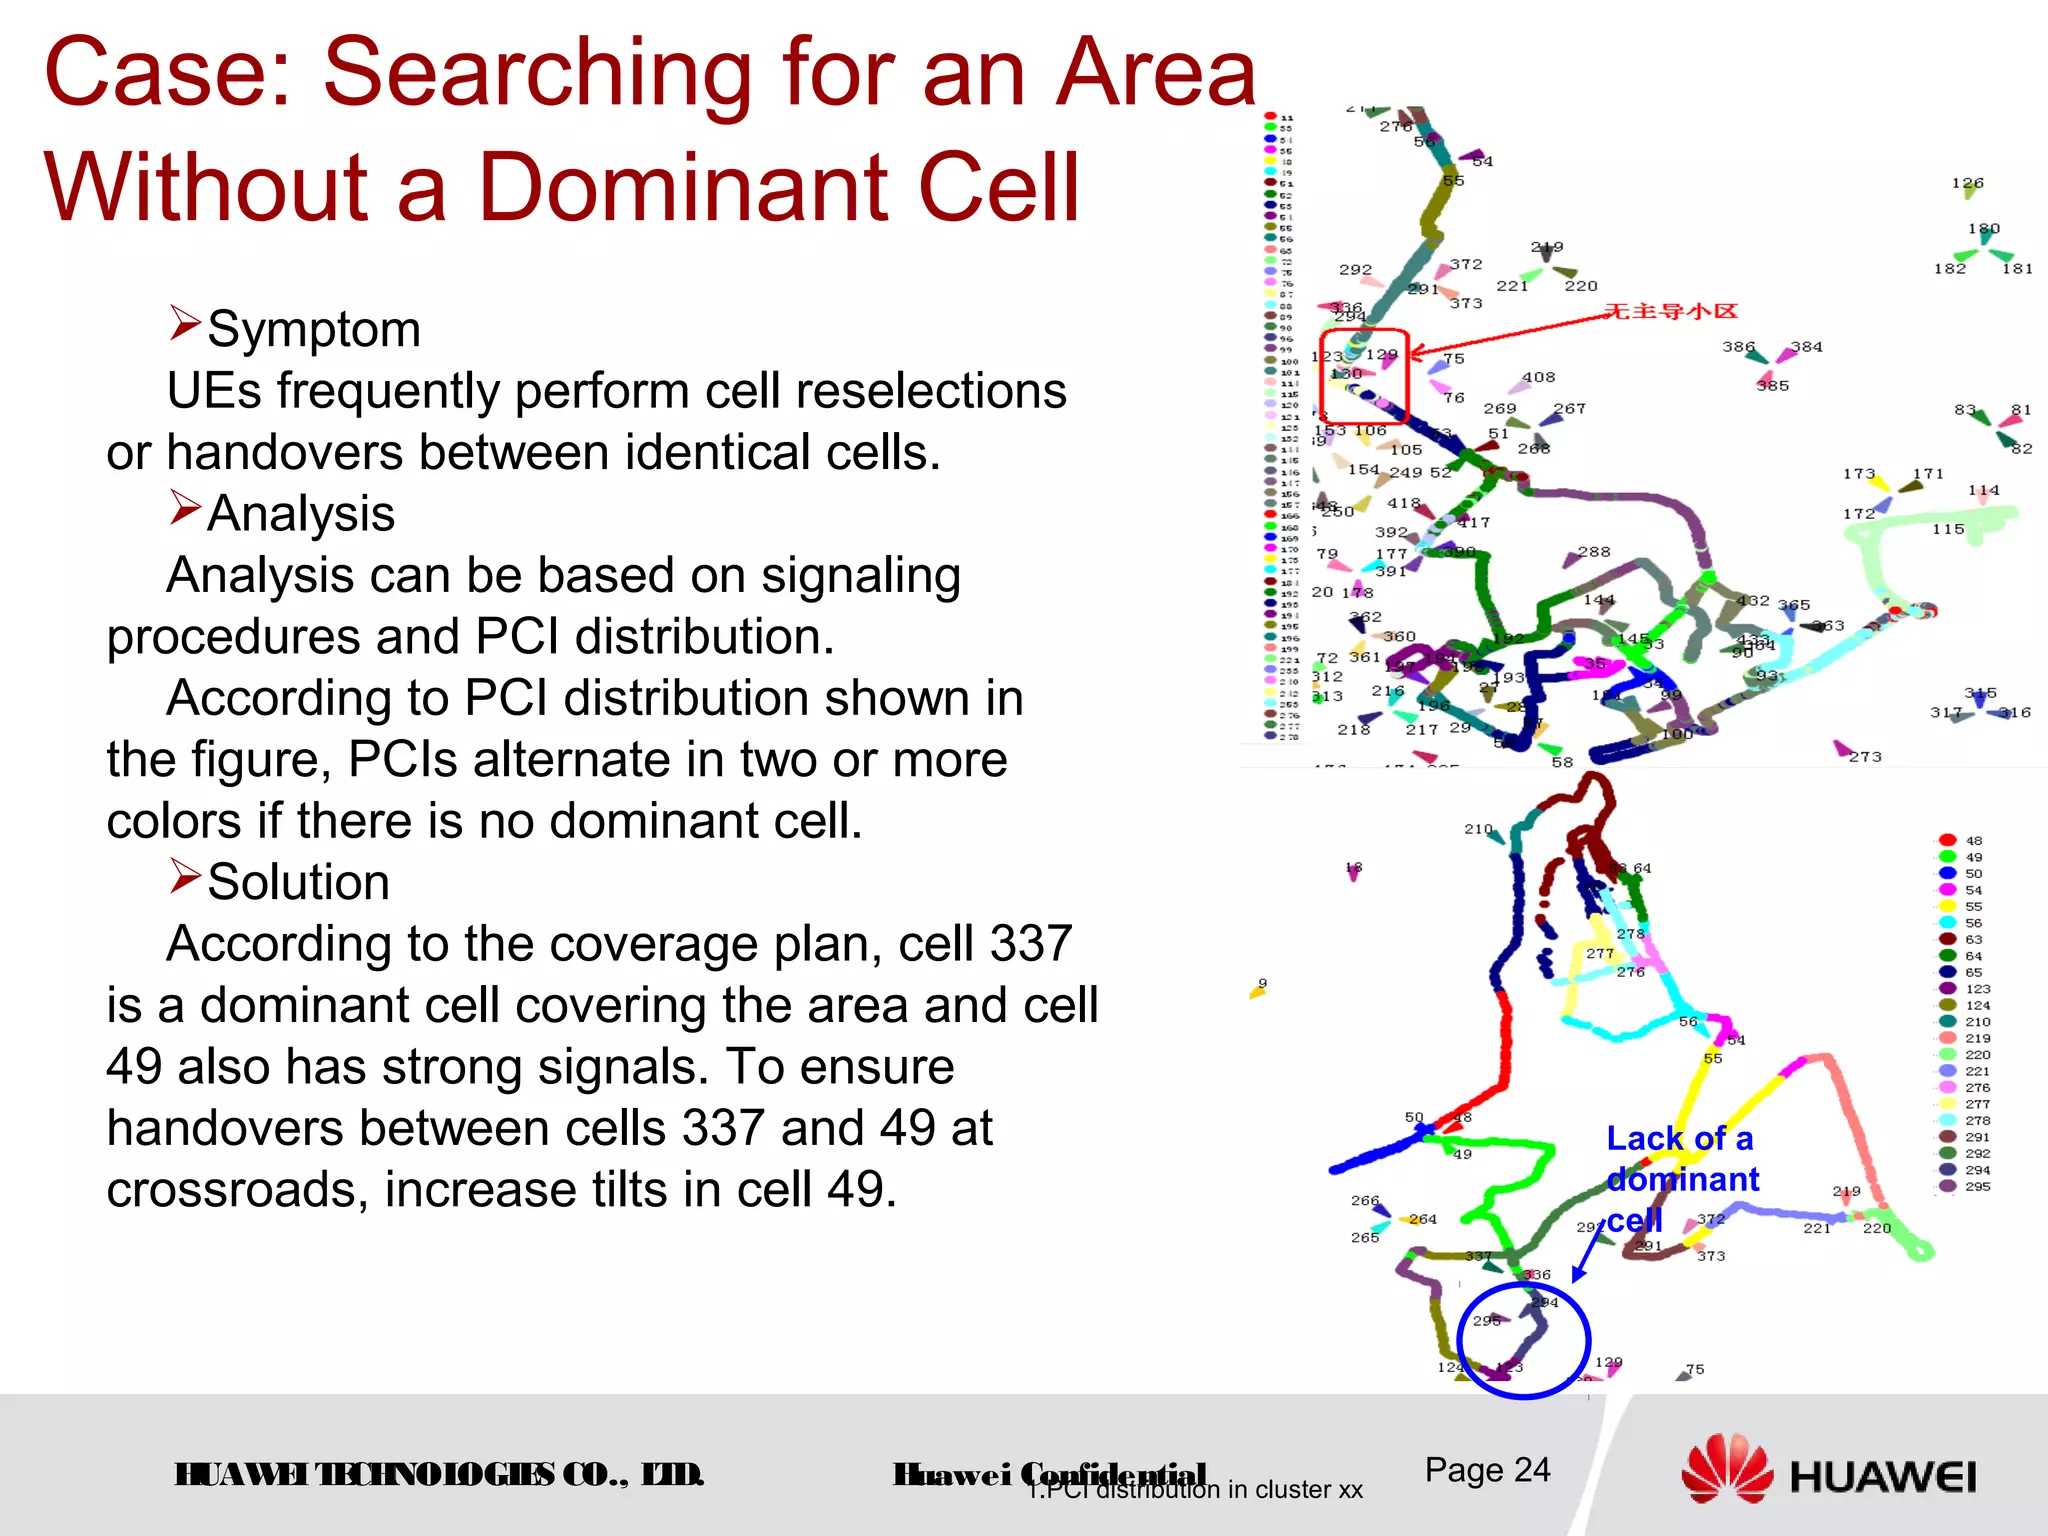
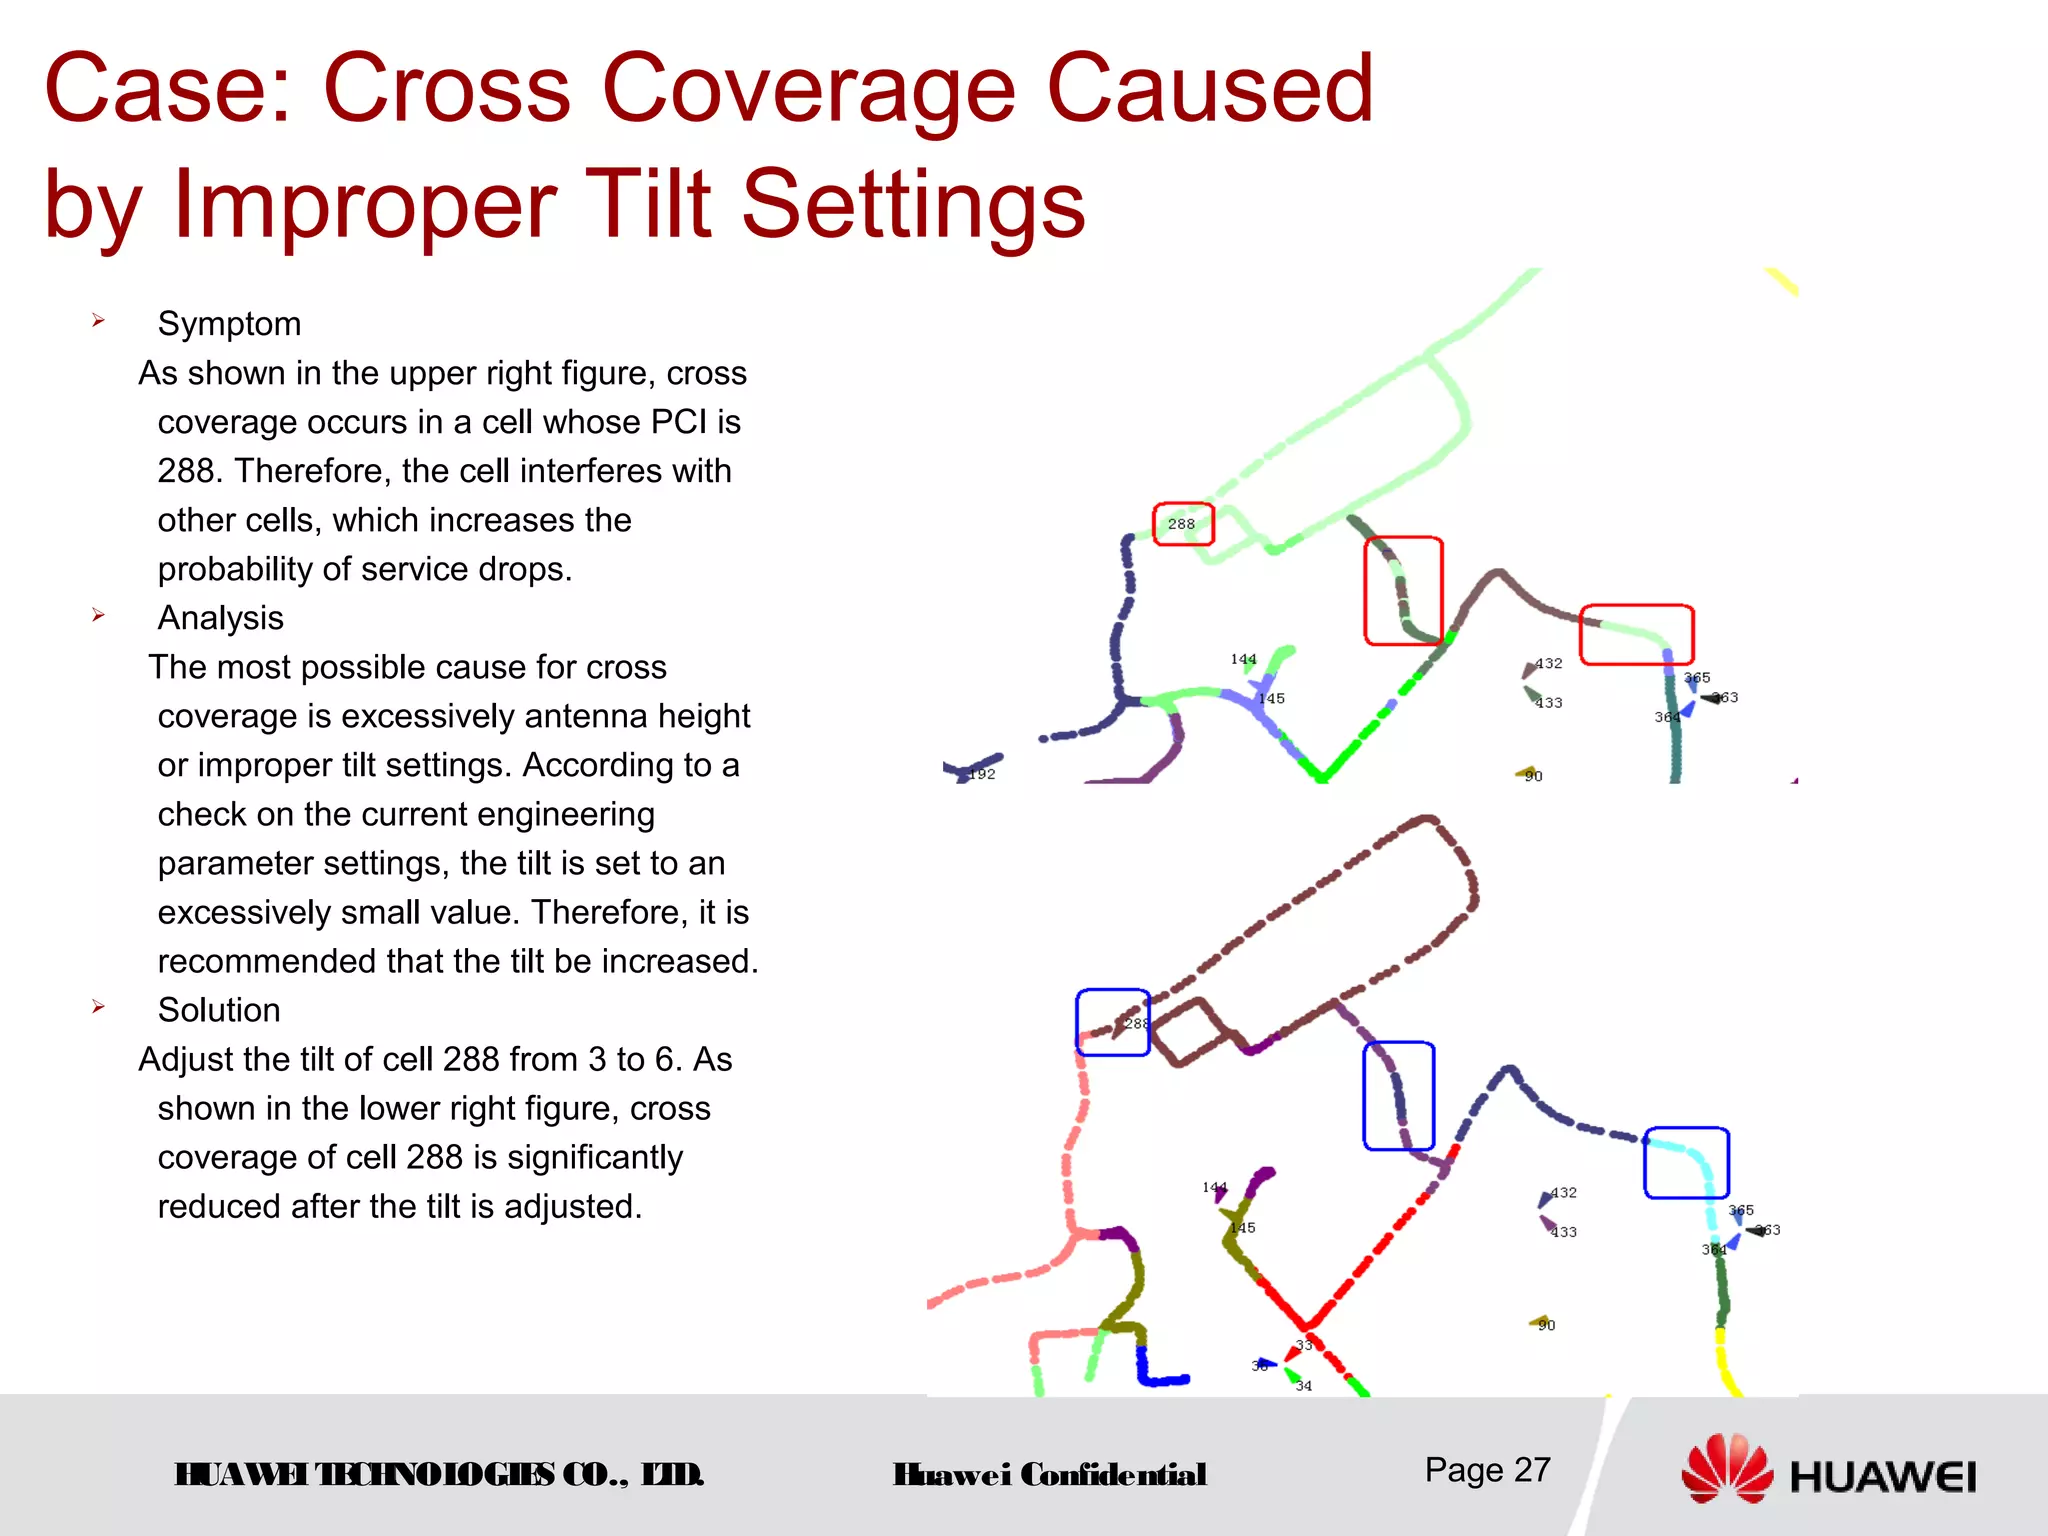
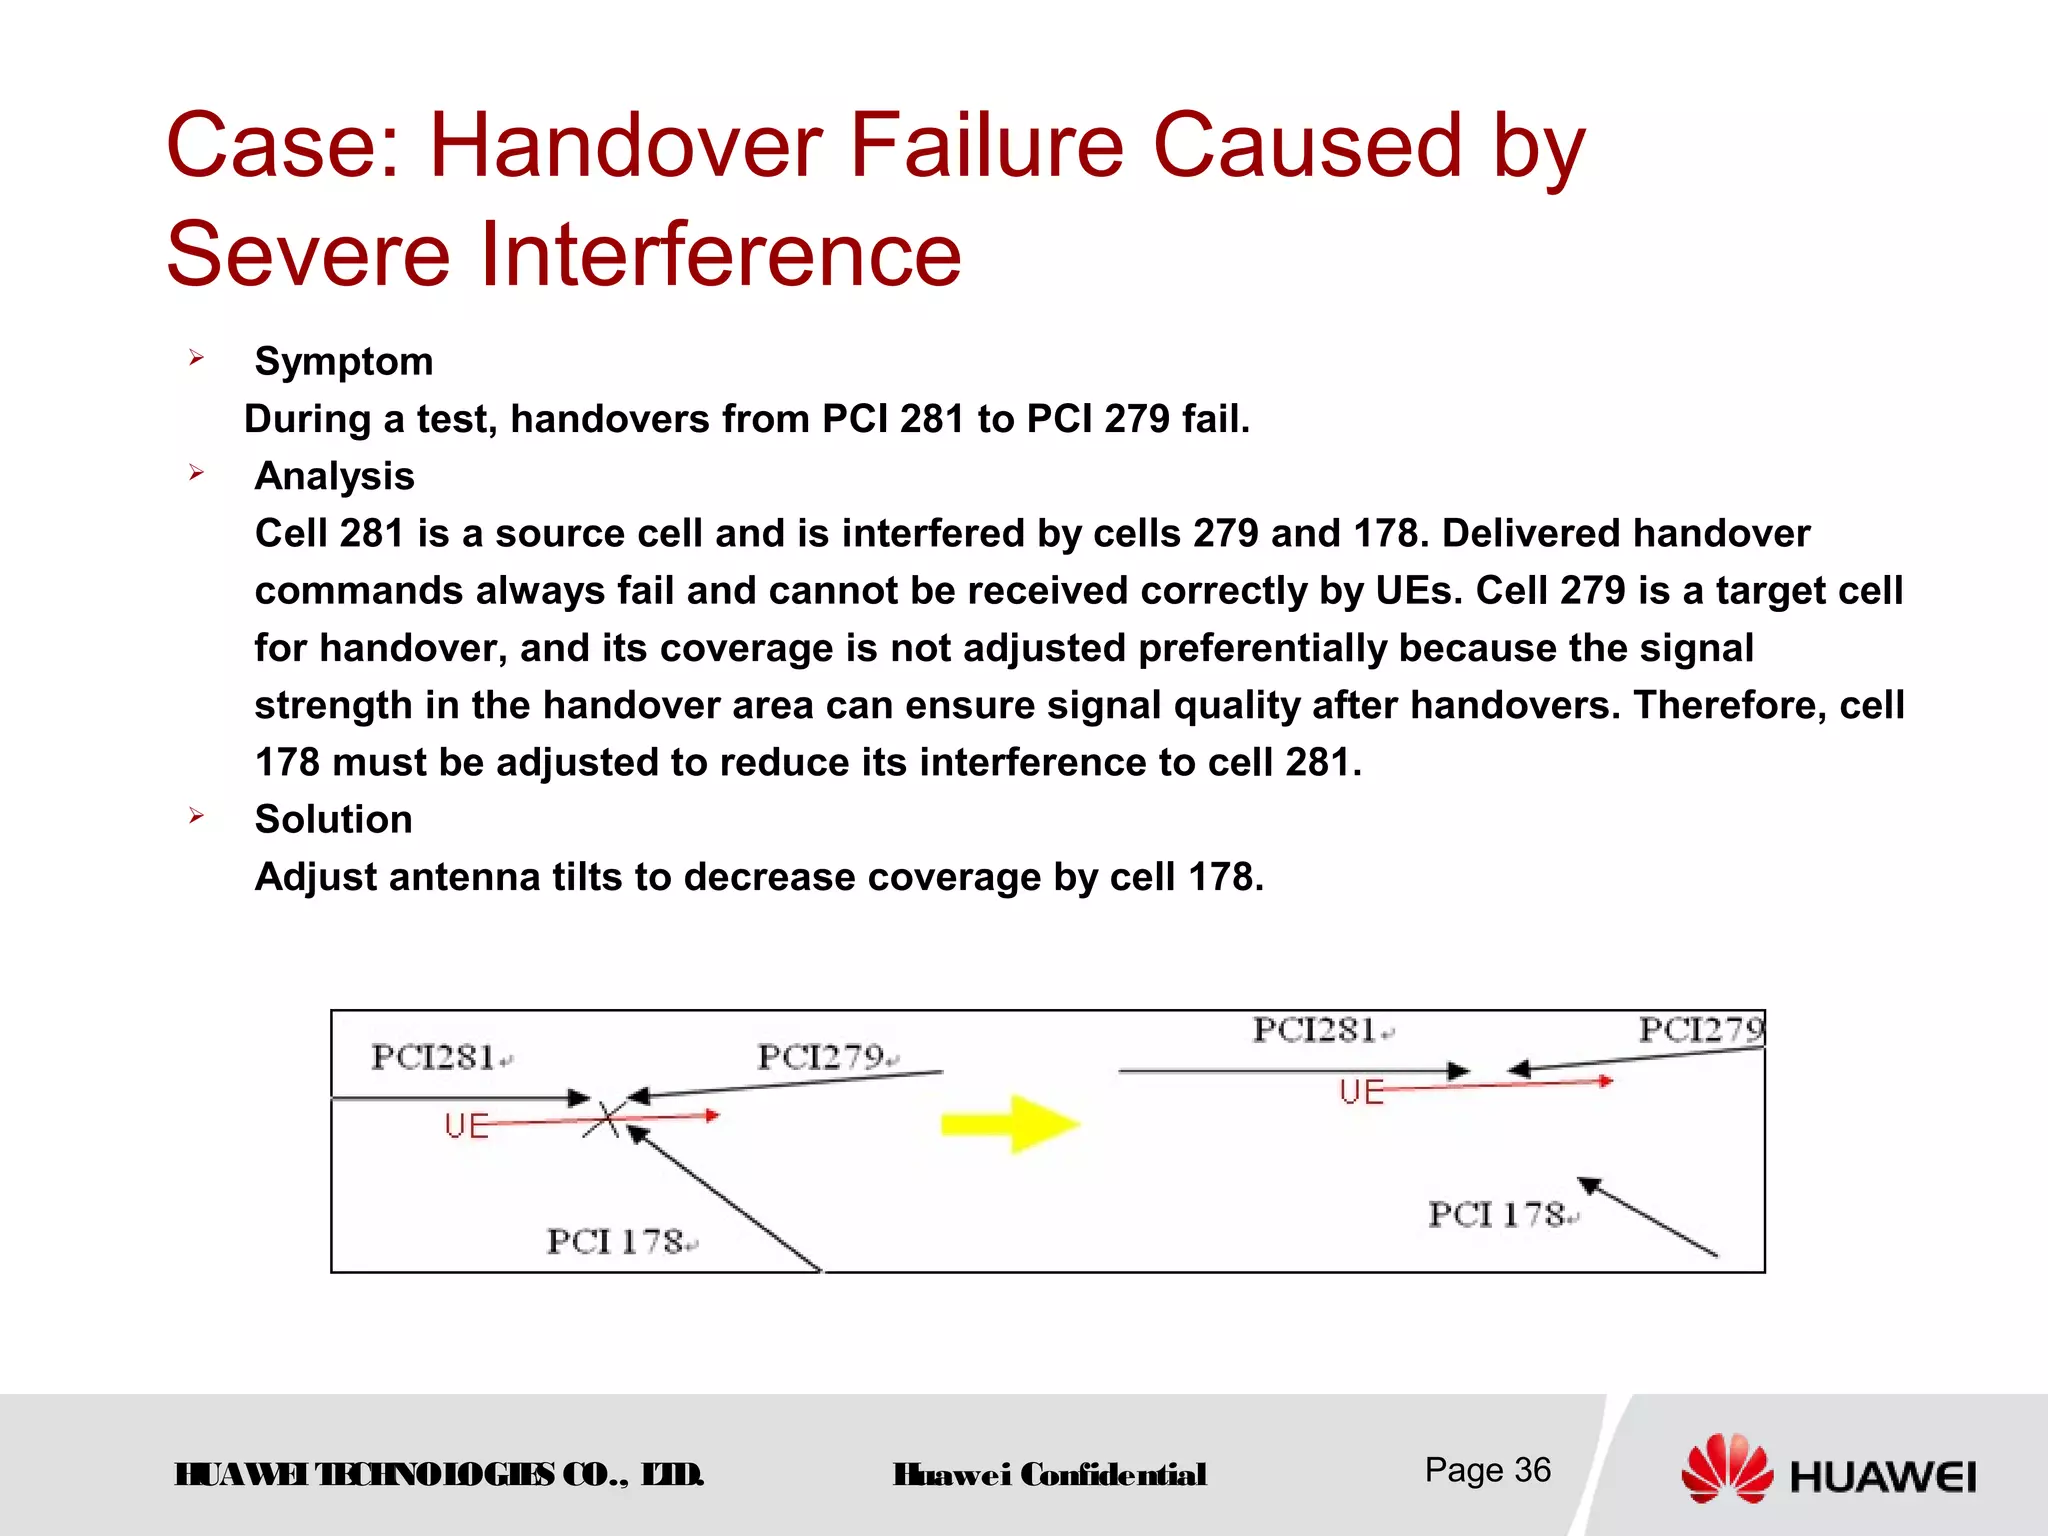
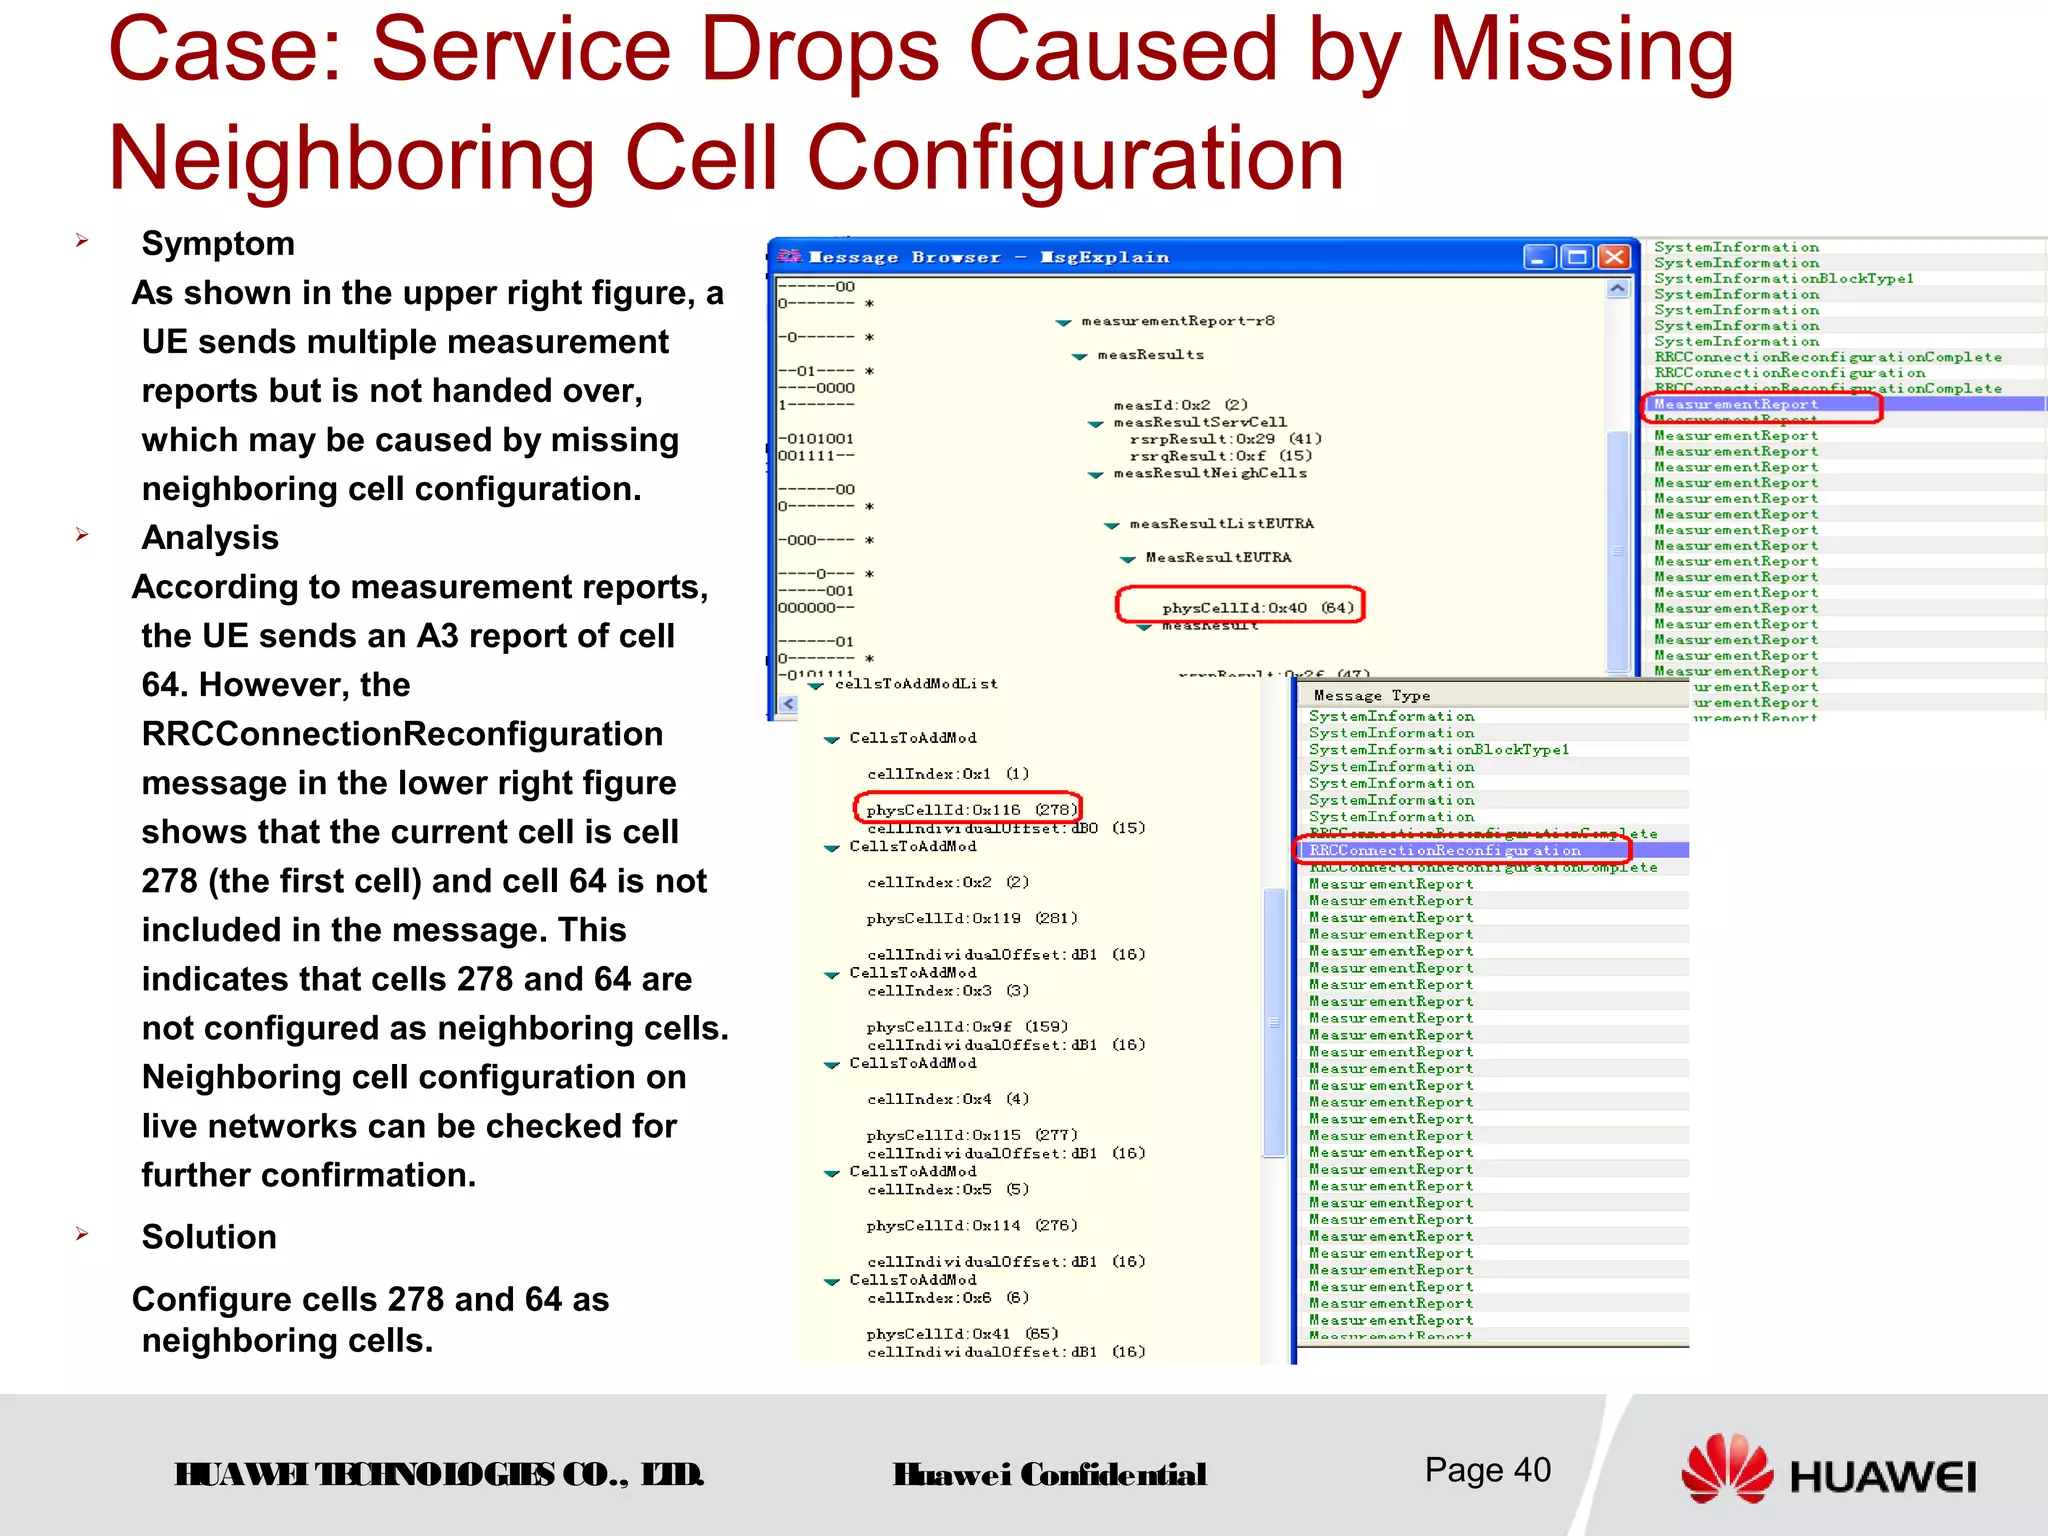
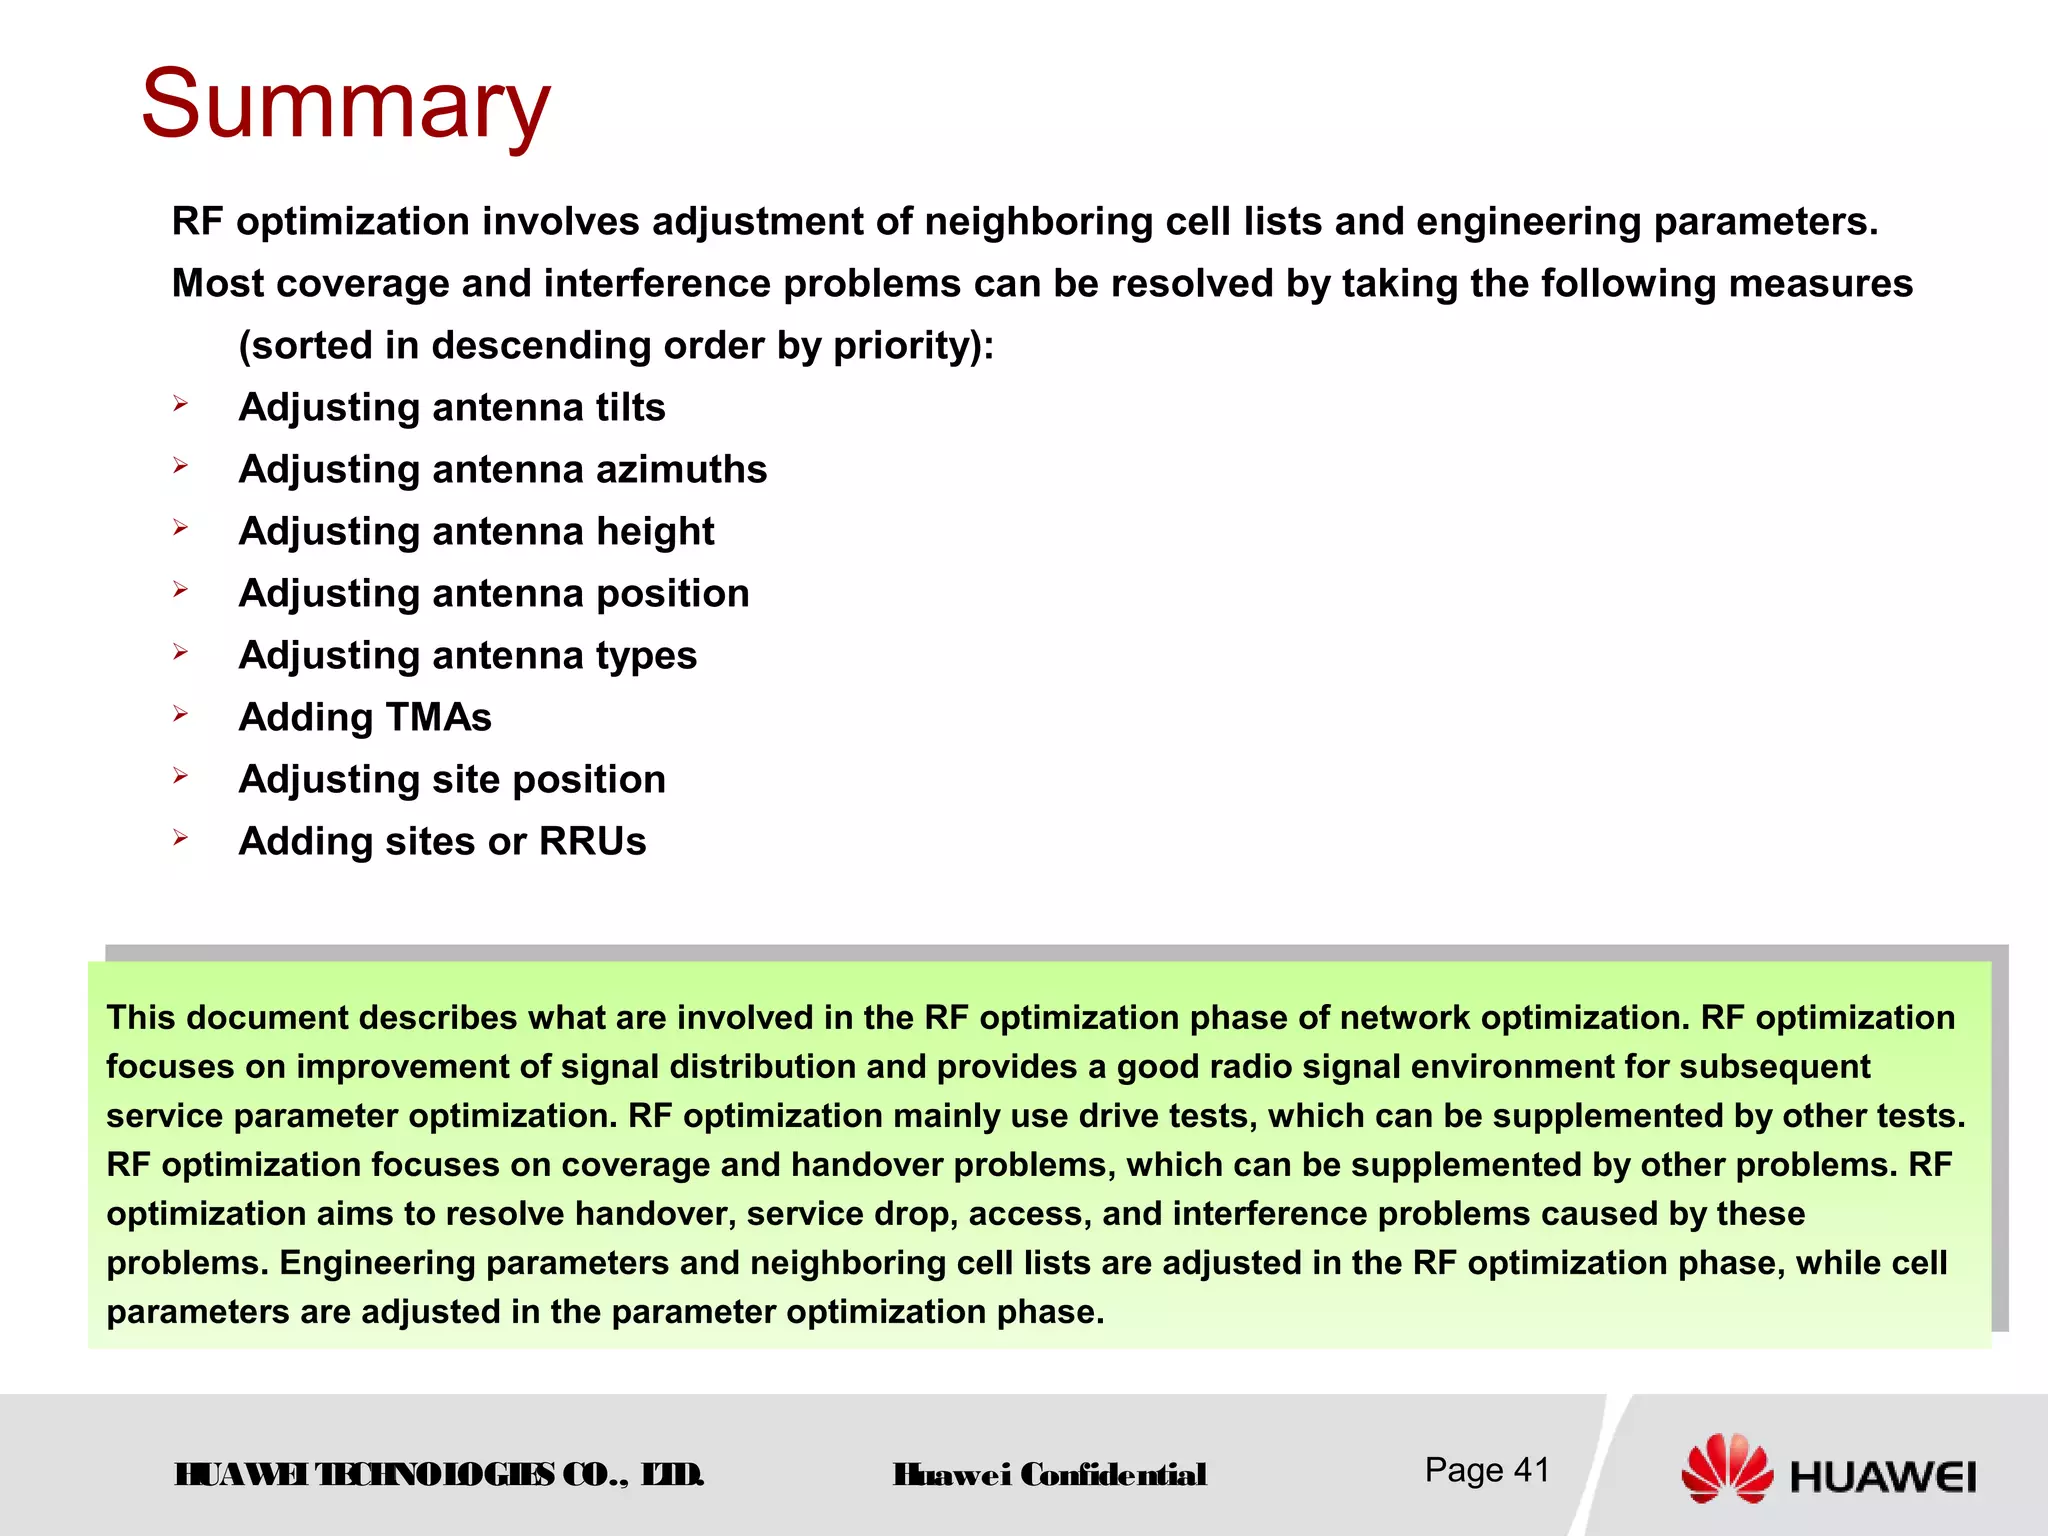
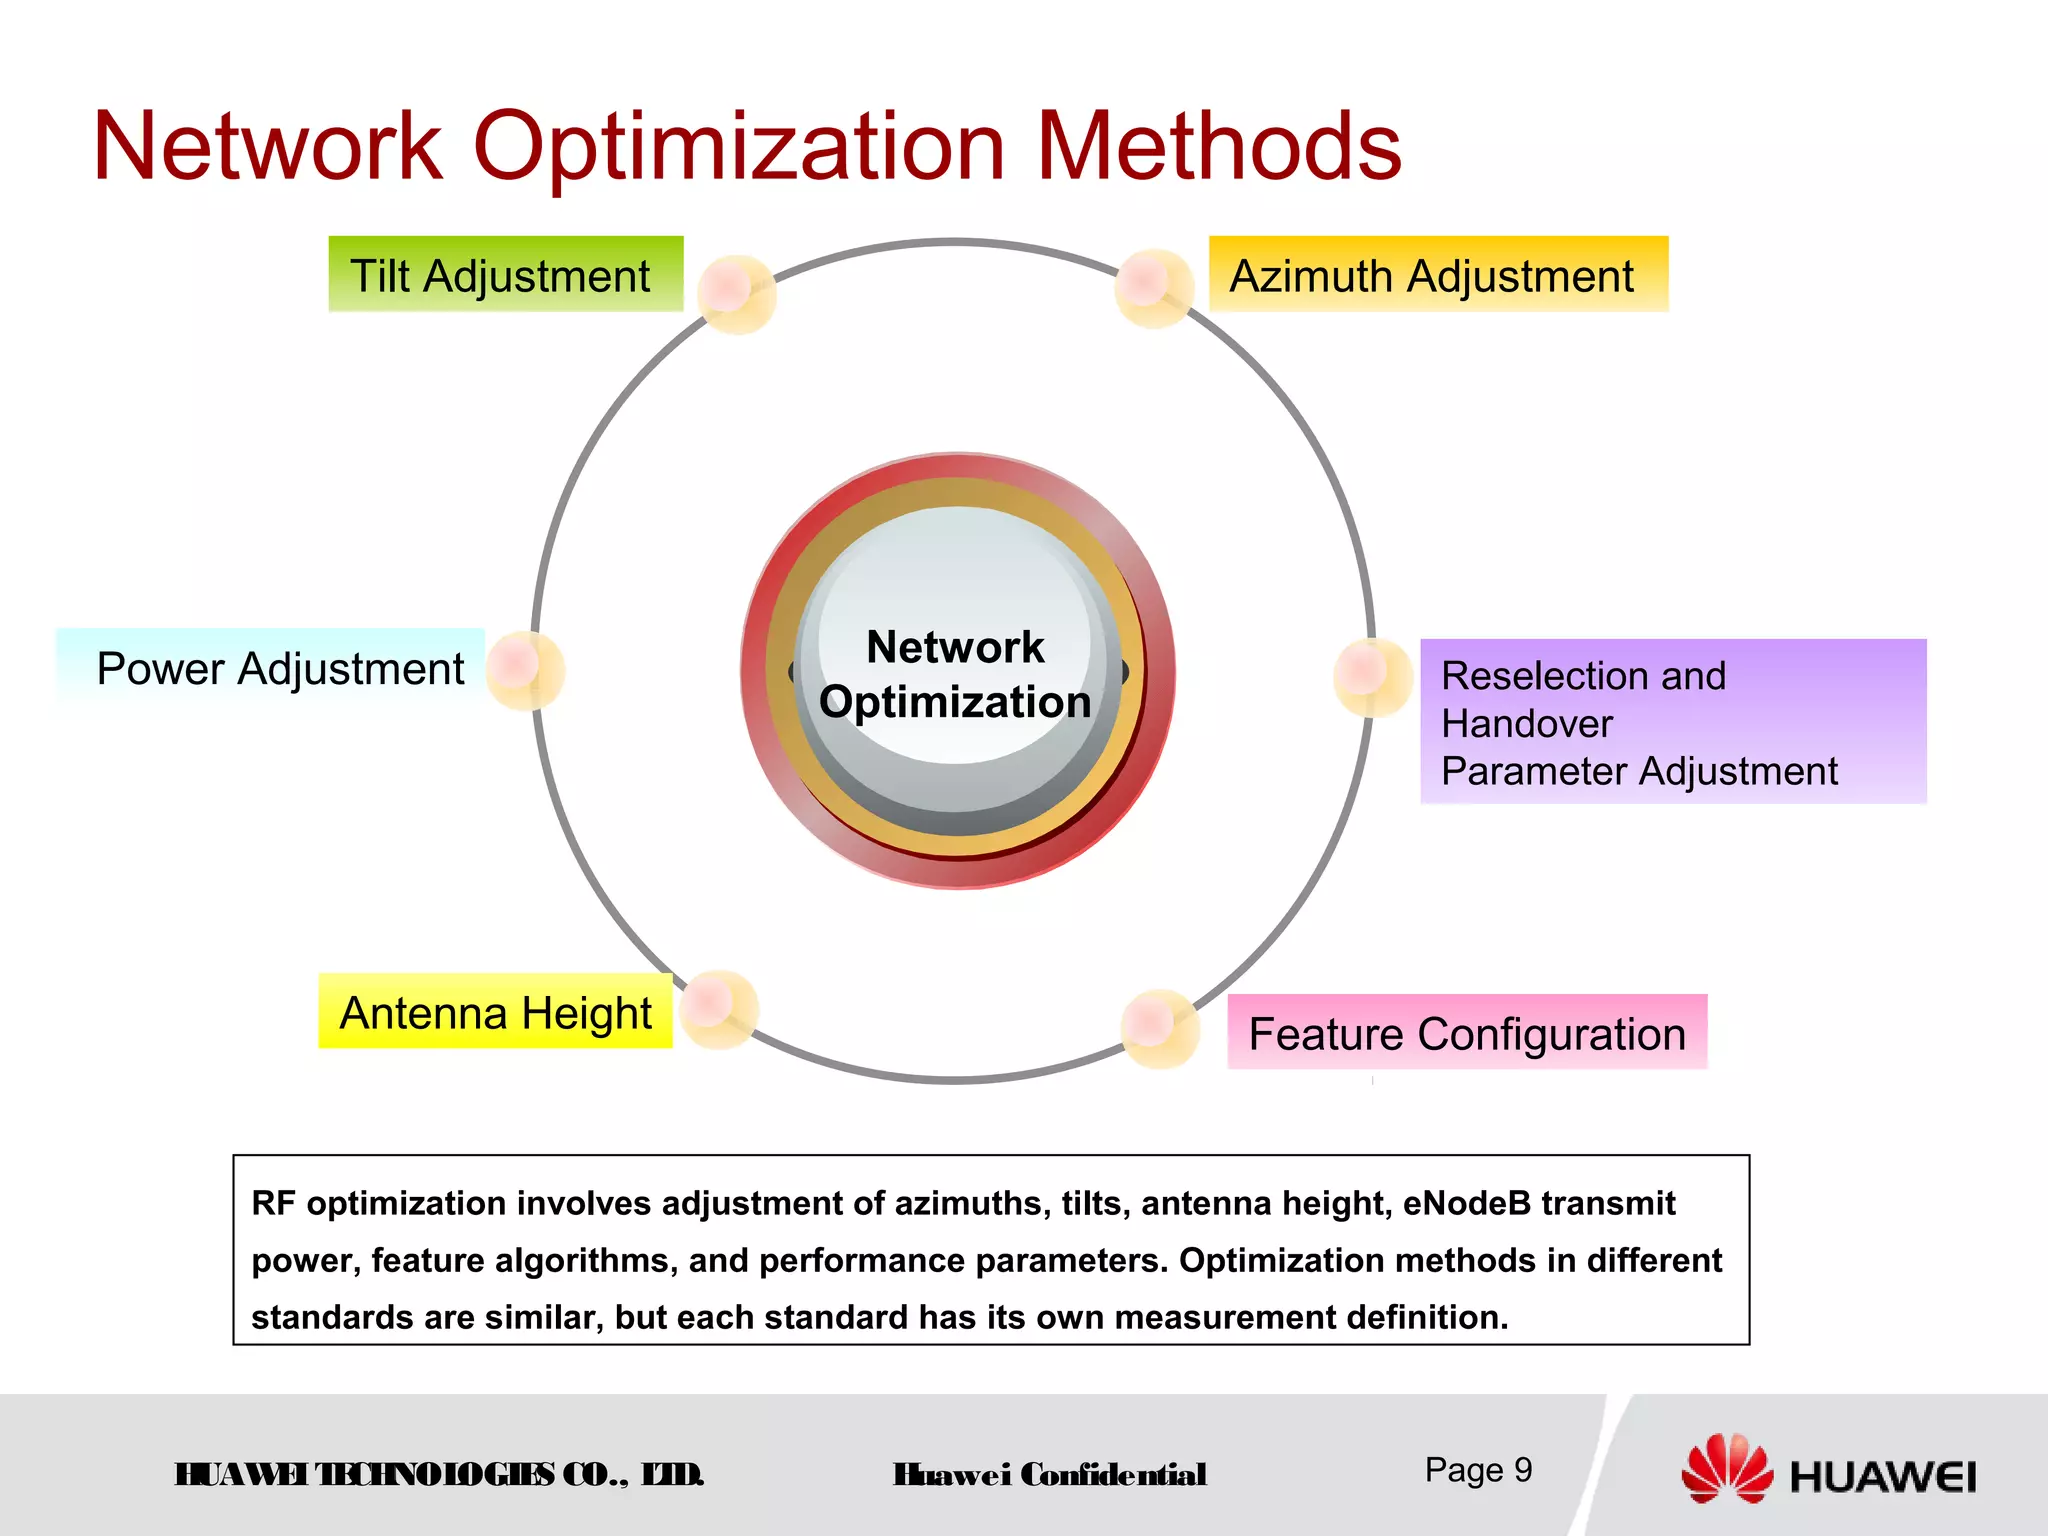
This document provides guidelines for optimizing LTE radio frequency (RF) networks. It describes the network optimization process, including single site verification and RF optimization. RF optimization aims to control pilot pollution while optimizing coverage, signal quality, and handover success rates. The document discusses LTE RF optimization objectives such as RSRP, SINR, and handover success rate. It also covers troubleshooting coverage issues like weak coverage, lack of a dominant cell, and cross coverage. Optimization methods include adjusting antenna parameters, transmit power, and network configuration parameters.
Hello my friends
Unfortunately, if you want any of these files, please contact me by email and mention any reference you find, to give it to you.
My email: molham.shoriss@outlook.com
LTE
LTE Introduction
LTE Fundamental
LTE RNP Introduction
LTE Principles (Huawei eRAN 3.0)
LTE Access Fault Diagnosis
LTE Access Transport Network Dimensioning
LTE Air Interface ISSUE 1.05
LTE Cell Planning ISSUE1.10
LTE eRAN 3.0 Scheduling - Feature Parameter Description
LTE eRAN3.0 Idle Mode Behavior
LTE eRAN3.0 KPI Introduction
LTE eRAN3.0 - Mobility Management in Connected Mode - Feature Parameters Description
LTE Handover Fault Diagnosis
LTE Network Tuning ISSUE 1.00
LTE Protocols and Procedure
LTE Radio Network Capacity Dimensioning
LTE Radio Network Coverage Dimensioning
LTE Radio Resource Management Overview
LTE Scheduling
LTE (Eicsson)
01.LTE SAE System Overview
LTE 10A Air Interface
LTE L10A Access Transport Network
LTE L10A Radio Network Design
LTE L12 Initial Tuning
LTE L14 Radio Network Functionality LTE
LTE Protocols and Procedures
LTE System Techniques
LTE Throughput Troubleshooting Techniques
LTE Radio Access Radio Interface Dimensioning and Planning
MIMO in WCDMA and LTE
LTE L14 Radio Network Functionality LTE
LTE Huawei
LTE System Overview
LTE Air Interface
LTE Protocols and Signaling Procedures
LTE Network Performance Management (KPIs)
LTE Radio Network Coverage Dimensioning
LTE Cell Planning
LTE Access Fault Diagnosis
LTE Handover Fault Diagnosis
LTE Call Drop Diagnosis
LTE Traffic Fault Diagnosis
LTE Interference Troubleshooting Guide
LTE Optimization
LTE Troubleshooting Access Failures
Features 1. Idle Mode
Features 2. Intra Rat Handover
Features 3. Power Control
Features 4. Scheduling
Features 5. CS Fallback
Features 6. Physical Channel Resource Management
HedEx for LTE
eRAN_eRAN13.0_02_en_GEG09124
5G
5G System Design (Wiley)
HedEx for 5G
(For Engineer) 5G RAN2.0 Solution Technical Guideline
Hello my friends
Unfortunately, if you want any of these files, please contact me by email and mention any reference you find, to give it to you.
My email: molham.shoriss@outlook.com
Drive Tests and Propagation Prediction software are the two methods that are used to check the coverage area of a particular wireless system. Generally prediction software is used in conjunction with the radio signal measurements in order to determine an accurate picture of signal propagation. In some cases, field measurements may be needed to be taken in order to calibrate the prediction software.
Hello my friends
Unfortunately, if you want any of these files, please contact me by email and mention any reference you find, to give it to you.
My email: molham.shoriss@outlook.com
LTE
LTE Introduction
LTE Fundamental
LTE RNP Introduction
LTE Principles (Huawei eRAN 3.0)
LTE Access Fault Diagnosis
LTE Access Transport Network Dimensioning
LTE Air Interface ISSUE 1.05
LTE Cell Planning ISSUE1.10
LTE eRAN 3.0 Scheduling - Feature Parameter Description
LTE eRAN3.0 Idle Mode Behavior
LTE eRAN3.0 KPI Introduction
LTE eRAN3.0 - Mobility Management in Connected Mode - Feature Parameters Description
LTE Handover Fault Diagnosis
LTE Network Tuning ISSUE 1.00
LTE Protocols and Procedure
LTE Radio Network Capacity Dimensioning
LTE Radio Network Coverage Dimensioning
LTE Radio Resource Management Overview
LTE Scheduling
LTE (Eicsson)
01.LTE SAE System Overview
LTE 10A Air Interface
LTE L10A Access Transport Network
LTE L10A Radio Network Design
LTE L12 Initial Tuning
LTE L14 Radio Network Functionality LTE
LTE Protocols and Procedures
LTE System Techniques
LTE Throughput Troubleshooting Techniques
LTE Radio Access Radio Interface Dimensioning and Planning
MIMO in WCDMA and LTE
LTE L14 Radio Network Functionality LTE
LTE Huawei
LTE System Overview
LTE Air Interface
LTE Protocols and Signaling Procedures
LTE Network Performance Management (KPIs)
LTE Radio Network Coverage Dimensioning
LTE Cell Planning
LTE Access Fault Diagnosis
LTE Handover Fault Diagnosis
LTE Call Drop Diagnosis
LTE Traffic Fault Diagnosis
LTE Interference Troubleshooting Guide
LTE Optimization
LTE Troubleshooting Access Failures
Features 1. Idle Mode
Features 2. Intra Rat Handover
Features 3. Power Control
Features 4. Scheduling
Features 5. CS Fallback
Features 6. Physical Channel Resource Management
HedEx for LTE
eRAN_eRAN13.0_02_en_GEG09124
5G
5G System Design (Wiley)
HedEx for 5G
(For Engineer) 5G RAN2.0 Solution Technical Guideline
Hello my friends
Unfortunately, if you want any of these files, please contact me by email and mention any reference you find, to give it to you.
My email: molham.shoriss@outlook.com
Drive Tests and Propagation Prediction software are the two methods that are used to check the coverage area of a particular wireless system. Generally prediction software is used in conjunction with the radio signal measurements in order to determine an accurate picture of signal propagation. In some cases, field measurements may be needed to be taken in order to calibrate the prediction software.
To meet customers' requirements for high-quality networks, LTE trial networks must be optimized during and after project implementation. Radio frequency (RF) optimization is necessary in the entire optimization process. This document provides guidelines on network optimization for network planning and optimization personnel.
The project was a study based report on the RAN evolution path of 2.5G EDGE Networks to HSDPA. HSDPA is a 3.5G wireless cellular system, a cost-efficient upgrade to UMTS systems and promises to deliver performance comparable to today’s wireless LAN services, but with the added benefit of mobility and ubiquitous coverage. It can offer data rates of up to 14.4 Mbps which is far beyond what 2.5G and 3G cellular systems could offer. The project focuses on a two-step upgrade, first from GSM towards the deployment of UMTS/WCDMA and then towards HSDPA. It begins a new era of “Mobile broadband” services and faces competition from “WiMAX” – but with GSM services having an obvious upgrade path to WCDMA, HSDPA seems to be leading the market in several parts of the world. HSDPA is an extremely cost-effective path to higher data rates and provides more efficient use of valuable spectrum. It enables operators to compete effectively in increasingly converged markets and satisfy the need for enhanced QoS in an efficient and cost-effective manner.
This third webinar discusses the fundamentals of LTE Carriers and how LTE mobiles communicate with the network including what factors affect performance.
A collection of several vital configuration tips and tricks which are widely implemented across mid-size to large enterprise WLAN. Primary focus would be on Security as well as Performance characteristics of Aruba WLAN networks. Check out the webinar recording where this presentation was used.
https://community.arubanetworks.com/t5/Wireless-Access/Technical-Webinar-Recording-Slides-Aruba-controller-features/td-p/279274
Register for the upcoming webinars: https://community.arubanetworks.com/t5/Training-Certification-Career/EMEA-Airheads-Webinars-Jul-Dec-2017/td-p/271908
Comparative Analysis of PAPR Reduction Techniques in OFDM Using Precoding Tec...IJSRD
In this modern era, Orthogonal Frequency Division Multiplexing (OFDM) has been proved to be an explicit promising technique for wired and wireless systems because of its several advantages like high spectral efficiency, robustness against frequency selective fading, relatively simple receiver implementation etc. Besides having a number of advantages OFDM suffers from few disadvantages like high Peak to Average Power Ratio (PAPR), Intercarrier Interference (ICI), Intersymbol Interference (ISI) etc. These detrimental effects, if not compensated properly and timely, can result in system performance degradation. This paper mainly concentrates on reduction of PAPR.A comparisons have been made between various precoding techniques against conventional OFDM.
Powerful business model for fixed wireless data using outdoor antennas - PaperAndre Fourie
Paper presented at the 2nd Africa Radio Comms Conference in Johannesburg - Nov 2015
By Andre Fourie
The revenue that can be generated by an LTE base station is influenced by the quality of the signal received by the customer premise equipment (CPE). Most CPE come with omni-directional indoor antennas, but have provision for the connection to external antennas.
Substituting the indoor antennas for directional outdoor antennas has a marked effect on the data transfer speeds of the network. There are two reasons for this. Firstly, outdoor antennas are physically larger than their indoor counterparts and thus have a higher gain. The increase in antenna gain translates directly to an increase in received signal strength. The second advantage is that the outdoor antenna sits in an environment that has much better propagating properties than the indoor antenna. Tests have shown that data speeds 3-5 times faster are possible using external antennas compared to indoor antennas.
It is shown, using a primitive financial model that fairly large financial gains can be made by equipping CPE devices with external antennas.
Final project report on grocery store management system..pdfKamal Acharya
In today’s fast-changing business environment, it’s extremely important to be able to respond to client needs in the most effective and timely manner. If your customers wish to see your business online and have instant access to your products or services.
Online Grocery Store is an e-commerce website, which retails various grocery products. This project allows viewing various products available enables registered users to purchase desired products instantly using Paytm, UPI payment processor (Instant Pay) and also can place order by using Cash on Delivery (Pay Later) option. This project provides an easy access to Administrators and Managers to view orders placed using Pay Later and Instant Pay options.
In order to develop an e-commerce website, a number of Technologies must be studied and understood. These include multi-tiered architecture, server and client-side scripting techniques, implementation technologies, programming language (such as PHP, HTML, CSS, JavaScript) and MySQL relational databases. This is a project with the objective to develop a basic website where a consumer is provided with a shopping cart website and also to know about the technologies used to develop such a website.
This document will discuss each of the underlying technologies to create and implement an e- commerce website.
Overview of the fundamental roles in Hydropower generation and the components involved in wider Electrical Engineering.
This paper presents the design and construction of hydroelectric dams from the hydrologist’s survey of the valley before construction, all aspects and involved disciplines, fluid dynamics, structural engineering, generation and mains frequency regulation to the very transmission of power through the network in the United Kingdom.
Author: Robbie Edward Sayers
Collaborators and co editors: Charlie Sims and Connor Healey.
(C) 2024 Robbie E. Sayers
Saudi Arabia stands as a titan in the global energy landscape, renowned for its abundant oil and gas resources. It's the largest exporter of petroleum and holds some of the world's most significant reserves. Let's delve into the top 10 oil and gas projects shaping Saudi Arabia's energy future in 2024.
NO1 Uk best vashikaran specialist in delhi vashikaran baba near me online vas...Amil Baba Dawood bangali
Contact with Dawood Bhai Just call on +92322-6382012 and we'll help you. We'll solve all your problems within 12 to 24 hours and with 101% guarantee and with astrology systematic. If you want to take any personal or professional advice then also you can call us on +92322-6382012 , ONLINE LOVE PROBLEM & Other all types of Daily Life Problem's.Then CALL or WHATSAPP us on +92322-6382012 and Get all these problems solutions here by Amil Baba DAWOOD BANGALI
#vashikaranspecialist #astrologer #palmistry #amliyaat #taweez #manpasandshadi #horoscope #spiritual #lovelife #lovespell #marriagespell#aamilbabainpakistan #amilbabainkarachi #powerfullblackmagicspell #kalajadumantarspecialist #realamilbaba #AmilbabainPakistan #astrologerincanada #astrologerindubai #lovespellsmaster #kalajaduspecialist #lovespellsthatwork #aamilbabainlahore#blackmagicformarriage #aamilbaba #kalajadu #kalailam #taweez #wazifaexpert #jadumantar #vashikaranspecialist #astrologer #palmistry #amliyaat #taweez #manpasandshadi #horoscope #spiritual #lovelife #lovespell #marriagespell#aamilbabainpakistan #amilbabainkarachi #powerfullblackmagicspell #kalajadumantarspecialist #realamilbaba #AmilbabainPakistan #astrologerincanada #astrologerindubai #lovespellsmaster #kalajaduspecialist #lovespellsthatwork #aamilbabainlahore #blackmagicforlove #blackmagicformarriage #aamilbaba #kalajadu #kalailam #taweez #wazifaexpert #jadumantar #vashikaranspecialist #astrologer #palmistry #amliyaat #taweez #manpasandshadi #horoscope #spiritual #lovelife #lovespell #marriagespell#aamilbabainpakistan #amilbabainkarachi #powerfullblackmagicspell #kalajadumantarspecialist #realamilbaba #AmilbabainPakistan #astrologerincanada #astrologerindubai #lovespellsmaster #kalajaduspecialist #lovespellsthatwork #aamilbabainlahore #Amilbabainuk #amilbabainspain #amilbabaindubai #Amilbabainnorway #amilbabainkrachi #amilbabainlahore #amilbabaingujranwalan #amilbabainislamabad
CFD Simulation of By-pass Flow in a HRSG module by R&R Consult.pptxR&R Consult
CFD analysis is incredibly effective at solving mysteries and improving the performance of complex systems!
Here's a great example: At a large natural gas-fired power plant, where they use waste heat to generate steam and energy, they were puzzled that their boiler wasn't producing as much steam as expected.
R&R and Tetra Engineering Group Inc. were asked to solve the issue with reduced steam production.
An inspection had shown that a significant amount of hot flue gas was bypassing the boiler tubes, where the heat was supposed to be transferred.
R&R Consult conducted a CFD analysis, which revealed that 6.3% of the flue gas was bypassing the boiler tubes without transferring heat. The analysis also showed that the flue gas was instead being directed along the sides of the boiler and between the modules that were supposed to capture the heat. This was the cause of the reduced performance.
Based on our results, Tetra Engineering installed covering plates to reduce the bypass flow. This improved the boiler's performance and increased electricity production.
It is always satisfying when we can help solve complex challenges like this. Do your systems also need a check-up or optimization? Give us a call!
Work done in cooperation with James Malloy and David Moelling from Tetra Engineering.
More examples of our work https://www.r-r-consult.dk/en/cases-en/
Immunizing Image Classifiers Against Localized Adversary Attacksgerogepatton
This paper addresses the vulnerability of deep learning models, particularly convolutional neural networks
(CNN)s, to adversarial attacks and presents a proactive training technique designed to counter them. We
introduce a novel volumization algorithm, which transforms 2D images into 3D volumetric representations.
When combined with 3D convolution and deep curriculum learning optimization (CLO), itsignificantly improves
the immunity of models against localized universal attacks by up to 40%. We evaluate our proposed approach
using contemporary CNN architectures and the modified Canadian Institute for Advanced Research (CIFAR-10
and CIFAR-100) and ImageNet Large Scale Visual Recognition Challenge (ILSVRC12) datasets, showcasing
accuracy improvements over previous techniques. The results indicate that the combination of the volumetric
input and curriculum learning holds significant promise for mitigating adversarial attacks without necessitating
adversary training.
COLLEGE BUS MANAGEMENT SYSTEM PROJECT REPORT.pdfKamal Acharya
The College Bus Management system is completely developed by Visual Basic .NET Version. The application is connect with most secured database language MS SQL Server. The application is develop by using best combination of front-end and back-end languages. The application is totally design like flat user interface. This flat user interface is more attractive user interface in 2017. The application is gives more important to the system functionality. The application is to manage the student’s details, driver’s details, bus details, bus route details, bus fees details and more. The application has only one unit for admin. The admin can manage the entire application. The admin can login into the application by using username and password of the admin. The application is develop for big and small colleges. It is more user friendly for non-computer person. Even they can easily learn how to manage the application within hours. The application is more secure by the admin. The system will give an effective output for the VB.Net and SQL Server given as input to the system. The compiled java program given as input to the system, after scanning the program will generate different reports. The application generates the report for users. The admin can view and download the report of the data. The application deliver the excel format reports. Because, excel formatted reports is very easy to understand the income and expense of the college bus. This application is mainly develop for windows operating system users. In 2017, 73% of people enterprises are using windows operating system. So the application will easily install for all the windows operating system users. The application-developed size is very low. The application consumes very low space in disk. Therefore, the user can allocate very minimum local disk space for this application.
Quality defects in TMT Bars, Possible causes and Potential Solutions.PrashantGoswami42
Maintaining high-quality standards in the production of TMT bars is crucial for ensuring structural integrity in construction. Addressing common defects through careful monitoring, standardized processes, and advanced technology can significantly improve the quality of TMT bars. Continuous training and adherence to quality control measures will also play a pivotal role in minimizing these defects.
2. HUAWEITECHNOLOGIES CO., LTD. Huawei Confidential Page 2
Change History
Date Version Description Author
0.5 LTE RNPS
1.0 LTE RNPS
3. HUAWEITECHNOLOGIES CO., LTD. Huawei Confidential Page 3
Preface
To meet customers' requirements for high-quality networks, LTE trial
networks must be optimized during and after project implementation. Radio
frequency (RF) optimization is necessary in the entire optimization process.
This document provides guidelines on network optimization for network
planning and optimization personnel.
5. HUAWEITECHNOLOGIES CO., LTD. Huawei Confidential Page 5
Network Optimization Flowchart
New site
on air
Single site
verification
Are clusters
ready?
RF optimization
Service test and
parameter optimization
Are KPI
requirements met?
No Yes Yes
No
End
6. HUAWEITECHNOLOGIES CO., LTD. Huawei Confidential Page 6
Network Optimization Process
Single site verification
Single site verification, the first phase of network optimization, involves
function verification at each new site. Single site verification aims to
ensure that each site is properly installed and that parameters are
correctly configured.
RF optimization
RF (or cluster) optimization starts after all sites in a planned area are
installed and verified. RF optimization aims to control pilot pollution while
optimizing signal coverage, increase handover success rates, and ensure
normal distribution of radio signals before parameter optimization. RF
optimization involves optimization and adjustment of antenna system
hardware and neighbor lists. The first RF optimization test must traverse
all cells in an area to rectify hardware faults.
8. HUAWEITECHNOLOGIES CO., LTD. Huawei Confidential Page 8
Preparations for RF Optimization
Checklist
Network plan, network structure diagram, site distribution, site
information, and engineering parameters
Drive test results (such as service drop points and handover
failure points) in the current area
Reference signal received power (RSRP) coverage diagram
Signal to interference plus noise ratio (SINR) distribution diagram
Measured handover success rates
Areas to be optimized can be determined by comparing the
distribution of RSRPs, SINRs, and handover success rates with the
optimization baseline.
9. HUAWEITECHNOLOGIES CO., LTD. Huawei Confidential Page 9
Network Optimization Methods
RF optimization involves adjustment of azimuths, tilts, antenna height, eNodeB transmit
power, feature algorithms, and performance parameters. Optimization methods in different
standards are similar, but each standard has its own measurement definition.
Network
Optimization
Azimuth AdjustmentTilt Adjustment
Feature Configuration
Reselection and
Handover
Parameter Adjustment
Power Adjustment
Antenna Height
11. HUAWEITECHNOLOGIES CO., LTD. Huawei Confidential Page 11
LTE RF Optimization Objects and
Target Baseline
What are
differences
between LTE
and 3G
optimization?
Text
RSRP
SINR
Handover
success rate
How are
these
counters
defined?
LTE
optimization
objects
12. HUAWEITECHNOLOGIES CO., LTD. Huawei Confidential Page 12
RSRP
Note: Different from GSM or TD-SCDMA systems, TD-LTE systems have multiple subcarriers multiplexed.
Therefore, the measured pilot signal strength is the RSRP of a single subcarrier (15 kHz) not the total
bandwidth power of the frequency.
The RSRPs near a cell, in the middle of a cell, and at the edge of a cell are determined based on the
distribution of signals on the entire network. Generally, the RSRP near a cell is -85 dBm, the RSRP in the
middle of a cell is -95 dBm, and the RSRP at the edge of a cell is -105 dBm.
Currently, the minimum RSRP for UEs to camp on a cell is -120 dBm.
Empirical RSRP at the edge of a cell:
The RSRP is greater than -110 dBm in 99% areas at the TD-LTE site in Norway.
The RSRP is greater than -110 dBm in 98.09% areas in the Huayang field in Chengdu.
Reference signal received power (RSRP), is determined for a
considered cell as the linear average over the power
contributions (in [W]) of the resource elements that carry cell-
specific reference signals within the considered measurement
frequency bandwidth.
3GPP
definition
13. HUAWEITECHNOLOGIES CO., LTD. Huawei Confidential Page 13
SINR
The SINR is not specifically defined in 3GPP specifications. A common formula is as
follows:
SINR = S/(I + N)
S: indicates the power of measured usable signals. Reference signals (RS) and physical
downlink shared channels (PDSCHs) are mainly involved.
I: indicates the power of measured signals or channel interference signals from other
cells in the current system and from inter-RAT cells.
N: indicates background noise, which is related to measurement bandwidths and receiver
noise coefficients.
Empirical SINR at the edge of a cell:
The SINR is greater than -3 dB in 99% areas in Norway.
The SINR is greater than -3 dB in 99.25% areas in the Huayang field in Chengdu.
14. HUAWEITECHNOLOGIES CO., LTD. Huawei Confidential Page 14
Handover Success Rate
According to the signaling process in 3GPP TS 36.331,
eNodeB statistics
(1) Handover success rate = Number of handovers/Number of handover
attempts x 100%
(2) Number of handover attempts: indicates the number of eNodeB-
transmitted RRCConnectionReconfiguration messages for handovers.
(3) Number of handovers: indicates the number of eNodeB-received
RRCConnectionReconfigurationComplete messages for handovers.
Handover success rate
The handover success rate is greater than 97% at the TD-LTE site in
Norway.
The handover success rate is 100% in the Huayang field in Chengdu.
15. HUAWEITECHNOLOGIES CO., LTD. Huawei Confidential Page 15
Power Adjustment Method
Service power configuration (calculating PDSCH power based
on RS power)
RS power PA and PB are delivered using RRC signaling. For
two antennas, PA is ρA and ρB is calculated based on the right
table. PDSCH power is calculated based on PA and PB.
Currently, it is recommended that PB be set to 1 dB and PA be
set to -3 dB. That is, the pilot power for symbols including pilot
symbols accounts for 1/3. This setting optimizes network
performance and ensures that the pilot power for Type A and
Type B symbols is equivalent to the service channel power. In
scenarios with special requirements, for example, in rural
scenarios requiring low edge rates, PB can be set to 2 or 3 dB to
enhance coverage.
Subcarriers share the transmit power of an eNodeB, and therefore the transmit power
of each subcarrier depends on the configured system bandwidth (such as 5 MHz and 10
MHz). A larger bandwidth will result in lower power of each subcarrier. LTE uses PA and
PB parameters to adjust power.
ρA: indicates the ratio of the data subcarrier power of OFDM symbols excluding pilot
symbols to the pilot subcarrier power.
ρB: indicates the ratio of the data subcarrier power of OFDM symbols including pilot
symbols to the pilot subcarrier power.
Definitions in
3GPP
specifications
Control channels
Power of PDCCHs, PHICHs, PCFICHs,
PBCHs, primary synchronization channels,
and secondary synchronization channels is
set using an offset from RS power.
17. HUAWEITECHNOLOGIES CO., LTD. Huawei Confidential Page 17
Classification of Coverage Problems
(RSRP is mainly involved)
Weak coverage and
coverage holes Cross coverage
Imbalance between
uplink and downlink
Lack of a
dominant cell
Continuous
coverage must be
ensured.
The actual
coverage must be
consistent with the
planned one to
prevent service
drops caused by
isolated islands
during handovers.
Uplink and
downlink losses
must be balanced
to resolve uplink
and downlink
coverage
problems.
Each cell on a
network must
have a dominant
coverage area to
prevent frequent
reselections or
handovers
caused by signal
changes.
18. HUAWEITECHNOLOGIES CO., LTD. Huawei Confidential Page 18
Factors Affecting Coverage
1
Downlink:
•Equivalent isotropic
radiated power (EIRP)
•Total transmit power
•Combining loss
•Path loss (PL)
•Frequency band
•Distance between a receive
point and an eNodeB
•Scenarios (urban and
suburban areas) and terrains
(plains, mountains, and hills)
of electric wave propagation
•Antenna gain
•Antenna height
•Antenna parameters
(antenna pattern)
•Antenna tilt
•Antenna azimuth
2
Uplink:
•eNodeB receiver sensitivity
•Antenna diversity gain
•UE transmit power
•Propagation loss of uplink
radio signals
•Impact of tower-mounted
amplifiers (TMAs) on uplink
19. HUAWEITECHNOLOGIES CO., LTD. Huawei Confidential Page 19
Weak Coverage and Coverage Holes
The signal quality in cells is poorer than the optimization baseline in an area.
As a result, UEs cannot be registered with the network or accessed services
cannot meet QoS requirements.
If there is no network coverage or coverage levels are excessively low in an area, the
area is called a weak coverage area. The receive level of a UE is less than its
minimum access level (RXLEV_ACCESS_MIN) because downlink receive levels in a
weak coverage area are unstable. In this situation, the UE is disconnected from the
network. After entering a weak coverage area, UEs in connected mode cannot be
handed over to a high-level cell, and even service drops occur because of low levels
and signal quality.
Weak
coverag
e
Coverage holes
20. HUAWEITECHNOLOGIES CO., LTD. Huawei Confidential Page 20
Resolving Weak Coverage Problems
Analyze geographical
environments and check the
receive levels of adjacent
eNodeBs.
Analyze the EIRP of each
sector based on parameter
configurations and ensure
EIRPs can reach maximum
values if possible.
Increase pilot power.
Adjust antenna azimuths and
tilts, increase antenna height,
and use high-gain antennas.
Deploy new eNodeBs if
coverage hole problems
cannot be resolved by
adjusting antennas.
Increase coverage by
adjacent eNodeBs to achieve
large coverage overlapping
between two eNodeBs and
ensure a moderate handover
area.
Note: Increasing coverage
may lead to co-channel and
adjacent-channel
interference.
Use RRUs, indoor
distribution systems, leaky
feeders, and directional
antennas to resolve the
problem with blind spots in
elevator shafts, tunnels,
underground garages or
basements, and high
buildings.
Analyze the impact of
scenarios and terrains on
coverage.
Use RRUs, indoor
distribution systems, leaky
feeders, and directional
antennas to resolve the
problem with blind spots in
elevator shafts, tunnels,
underground garages or
basements, and high
buildings.
Analyze the impact of
scenarios and terrains on
coverage.
21. HUAWEITECHNOLOGIES CO., LTD. Huawei Confidential Page 21
Case: Searching for a Weak Coverage Area by
Using a Scanner or Performing Drive Tests on
UEs
Weak
coverage
area
Perform drive tests in zero-
load environments to obtain
the distribution of signals on
test routes. Then, find a
weak coverage area based
on the distribution, as
shown in the figure.
Adjust RF parameters of the
eNodeB covering the area.
22. HUAWEITECHNOLOGIES CO., LTD. Huawei Confidential Page 22
Lack of a Dominant Cell
In an area without a dominant cell, the receive level of the serving cell is similar to the
receive levels of its neighboring cells and the receive levels of downlink signals between
different cells are close to cell reselection thresholds. Receive levels in an area without a
dominant cell are also unsatisfactory. The SINR of the serving cell becomes unstable
because of frequency reuse, and even receive quality becomes unsatisfactory. In this
situation, a dominant cell is frequently reselected and changed in idle mode. As a result,
frequent handovers or service drops occur on UEs in connected mode because of poor
signal quality. An area without a dominant cell can also be regarded as a weak coverage
area.
Lack of a
dominant
cell
23. HUAWEITECHNOLOGIES CO., LTD. Huawei Confidential Page 23
Resolving Problems with Lack of a
Dominant Cell
…
Adjust engineering
parameters of a cell that can
optimally cover the area as
required.
Adjust engineering
parameters of a cell that can
optimally cover the area as
required.
Determine cells covering an
area without a dominant cell
during network planning, and
adjust antenna tilts and
azimuths to increase coverage
by a cell with strong signals
and decrease coverage of
other cells with weak signals.
Determine cells covering an
area without a dominant cell
during network planning, and
adjust antenna tilts and
azimuths to increase coverage
by a cell with strong signals
and decrease coverage of
other cells with weak signals.
24. HUAWEITECHNOLOGIES CO., LTD. Huawei Confidential Page 24
Symptom
UEs frequently perform cell reselections
or handovers between identical cells.
Analysis
Analysis can be based on signaling
procedures and PCI distribution.
According to PCI distribution shown in
the figure, PCIs alternate in two or more
colors if there is no dominant cell.
Solution
According to the coverage plan, cell 337
is a dominant cell covering the area and cell
49 also has strong signals. To ensure
handovers between cells 337 and 49 at
crossroads, increase tilts in cell 49.
1.PCI distribution in cluster xx
Lack of a
dominant
cell
Case: Searching for an Area
Without a Dominant Cell
25. HUAWEITECHNOLOGIES CO., LTD. Huawei Confidential Page 25
Cross Coverage
Cross coverage means that the coverage scope of an eNodeB exceeds the planned one and
generates discontinuous dominant areas in the coverage scope of other eNodeBs. For
example, if the height of a site is much higher than the average height of surrounding
buildings, its transmit signals propagate far along hills or roads and form dominant
coverage in the coverage scope of other eNodeBs. This is an “island” phenomenon. If a call
is connected to an island that is far away from an eNodeB but is still served by the eNodeB,
and cells around the island are not configured as neighboring cells of the current cell when
cell handover parameters are configured, call drops may occur immediately once UEs leave
the island. If neighboring cells are configured but the island is excessively small, call drops
may also occur because UEs are not promptly handed over. In addition, cross coverage
occurs on two sides of a bay because a short distance between the two sides. Therefore,
eNodeBs on two sides of a bay must be specifically designed.
Cross
coverage
26. HUAWEITECHNOLOGIES CO., LTD. Huawei Confidential Page 26
Resolving Cross Coverage Problems
…
Adjust antenna tilts or
replace antennas with large-tilt
antennas while ensuring
proper antenna azimuths. Tilt
adjustment is the most
effective approach to control
coverage. Tilts are classified
into electrical tilts and
mechanical tilts. Electrical tilts
are preferentially adjusted if
possible.
Adjust antenna tilts or
replace antennas with large-tilt
antennas while ensuring
proper antenna azimuths. Tilt
adjustment is the most
effective approach to control
coverage. Tilts are classified
into electrical tilts and
mechanical tilts. Electrical tilts
are preferentially adjusted if
possible.
Adjust antenna azimuths
properly so that the direction
of the main lobe slightly
obliques from the direction of
a street. This reduces
excessively far coverage by
electric waves because of
reflection from buildings on
two sides of the street.
Adjust antenna azimuths
properly so that the direction
of the main lobe slightly
obliques from the direction of
a street. This reduces
excessively far coverage by
electric waves because of
reflection from buildings on
two sides of the street.
Decrease the antenna
height for a high site.
Decrease transmit power of
carriers when cell
performance is not affected.
Decrease the antenna
height for a high site.
Decrease transmit power of
carriers when cell
performance is not affected.
27. HUAWEITECHNOLOGIES CO., LTD. Huawei Confidential Page 27
Case: Cross Coverage Caused
by Improper Tilt Settings
Symptom
As shown in the upper right figure, cross
coverage occurs in a cell whose PCI is
288. Therefore, the cell interferes with
other cells, which increases the
probability of service drops.
Analysis
The most possible cause for cross
coverage is excessively antenna height
or improper tilt settings. According to a
check on the current engineering
parameter settings, the tilt is set to an
excessively small value. Therefore, it is
recommended that the tilt be increased.
Solution
Adjust the tilt of cell 288 from 3 to 6. As
shown in the lower right figure, cross
coverage of cell 288 is significantly
reduced after the tilt is adjusted.
28. HUAWEITECHNOLOGIES CO., LTD. Huawei Confidential Page 28
Case: Inverse Connections Involved
in the Antenna System
Symptom
The RSRPs of cells 0 and 2 at the Expo Village site are low and high respectively in
the red area shown in the figure. The signal quality of cells 0 and 2 is satisfactory in
the areas covered by cells 2 and 0 respectively.
Analysis
After installation and commissioning are complete, the RSRP in the direction of the
main lobe in cell 0 is low. After cell 0 is disabled and cell 2 is enabled, the RSRP in
cell 2 is normal and the SINR is higher than that tested in cell 0. Therefore, this
problem may occur because the antenna systems in the two cells are connected
inversely. Test results are as expected after optical fibers on the baseband board are
swapped.
Solution
Swap optical fibers on the baseband board or adjust feeders and antennas properly. It
is recommended that optical fibers on the baseband board be swapped because this
operation can be performed in the equipment room.
Suggestions
Network planning personnel must participate in installation. Alternatively, customer
service personnel have detailed network planning materials and strictly supervise
project constructors for installation. After installation is complete, labels must be
attached and installation materials must be filed.
29. HUAWEITECHNOLOGIES CO., LTD. Huawei Confidential Page 29
Imbalance Between Uplink and
DownlinkWhen UE transmit power is less than eNodeB transmit power, UEs in idle mode may receive
eNodeB signals and successfully register in cells. However, the eNodeB cannot receive
uplink signals because of limited power when UEs perform random access or upload data.
In this situation, the uplink coverage distance is less than the downlink coverage distance.
Imbalance between uplink and downlink involves limited uplink or downlink coverage. In
limited uplink coverage, UE transmit power reaches its maximum but still cannot meet the
requirement for uplink BLERs. In limited downlink coverage, the downlink DCH transmit
code power reaches its maximum but still cannot meet the requirement for the downlink
BLER. Imbalance between uplink and downlink leads to service drops. The most common
cause is limited uplink coverage.
Imbalance
between
uplink and
downlink
Uplink coverage area
Downlink coverage area
coverage area
30. HUAWEITECHNOLOGIES CO., LTD. Huawei Confidential Page 30
Resolving Problems with Imbalance
Between Uplink and Downlink
…
If no performance data is available for
RF optimization, trace a single user in the
OMC equipment room to obtain uplink
measurement reports on the Uu interface,
and then analyze the measurement
reports and drive test files.
If performance data is available, check
each carrier in each cell for imbalance
between uplink and downlink based on
uplink and downlink balance
measurements.
If uplink interference leads to imbalance
between uplink and downlink, monitor
eNodeB alarms to check for interference.
Check whether equipment works properly
and whether alarms are generated if
imbalance between uplink and downlink is
caused by other factors, for example, uplink
and downlink gains of repeaters and trunk
amplifiers are set incorrectly, the antenna
system for receive diversity is faulty when
reception and transmission are separated,
or power amplifiers are faulty. If equipment
works properly or alarms are generated,
take measures such as replacement,
isolation, and adjustment.
32. HUAWEITECHNOLOGIES CO., LTD. Huawei Confidential Page 32
Signal Quality (SINR is mainly
involved)
a. Frequency
plan
c. Site
selection
d. Antenna
height
Process of analyzing SINR problems
e. Antenna
azimuths
f. Antenna tilts
b. Cell layout
33. HUAWEITECHNOLOGIES CO., LTD. Huawei Confidential Page 33
Resolving Signal Quality Problems
Caused by Improper Parameter Settings
Change and optimize frequencies based on drive test and
performance measurement data.
Optimizing
frequencies
Adjust antenna azimuths and tilts to change the distribution of signals in an
interfered area by increasing the level of a dominant sector and decreasing levels of
other sectors.
Adjusting the
antenna
system
Increase power of a cell and decrease power of other cells to form a dominant
cell.
Decrease RS power to reduce coverage if the antenna pattern is distorted because
of a large antenna tilt.
Power adjustment and antenna system adjustment can be used together.
Adding
dominant
coverage
Adjusting
power
34. HUAWEITECHNOLOGIES CO., LTD. Huawei Confidential Page 34
Case: Adjusting Antenna Azimuths and Tilts
to Reduce Interference
Symptom
Cross coverage occurs at sites 1, 2, 3, 7, 8, 9, 10, 11, and 12, and co-channel interference occurs
in many areas.
Analysis
According to the analysis of engineering parameters and drive test data, cell density is large in
coverage areas. Coverage by each cell can be reduced by adjusting antenna azimuths and tilts.
Solution
Change the tilt in cell 28 from 2 degrees to 4 degrees so that the direction points to a
demonstration route. Change the tilt in cell 33 from 3 degrees to 6 degrees so that the direction
points to the Wanke Pavilion. Change the tilt in cells 50 and 51 from 3 degrees to 6 degrees so
that the direction points to the Communication Pavilion. Decrease the transmit power in cell 33 by
3 dB to reduce its interference to overhead footpaths near China Pavilion.
SINR before optimization in Puxi SINR after optimization in Puxi
Poor signal
quality before
optimization
35. HUAWEITECHNOLOGIES CO., LTD. Huawei Confidential Page 35
Case: Changing PCIs of Intra-frequency Cells
to Reduce Interference Symptom
Near Japan Pavilion, UEs access a cell whose PCI is 3 and SINRs are low. UEs are about 200 m away from the
eNodeB. This problem may be caused by co-channel interference.
Analysis
This problem is not caused by co-channel interference because no neighboring cell has the same frequency as
the current cell. Cell 6 interferes with cell 3. SINRs increase after cell 6 is disabled. In theory, staggered PCIs can
reduce interference.
Solution
Change PCI 6 to PCI 8. Test results show that SINRs increase by about 10 dB.
SINR when cell 6 is enabled SINR when cell 6 is disabled SINR when PCI 6 is changed to PCI 8
36. HUAWEITECHNOLOGIES CO., LTD. Huawei Confidential Page 36
Case: Handover Failure Caused by
Severe Interference
Symptom
During a test, handovers from PCI 281 to PCI 279 fail.
Analysis
Cell 281 is a source cell and is interfered by cells 279 and 178. Delivered handover
commands always fail and cannot be received correctly by UEs. Cell 279 is a target cell
for handover, and its coverage is not adjusted preferentially because the signal
strength in the handover area can ensure signal quality after handovers. Therefore, cell
178 must be adjusted to reduce its interference to cell 281.
Solution
Adjust antenna tilts to decrease coverage by cell 178.
38. HUAWEITECHNOLOGIES CO., LTD. Huawei Confidential Page 38
Analysis of Handover Success Rate
Problems
Neighboring cell optimization must be performed to ensure that UEs in idle or
connected mode can promptly perform reselection to or be handed over to
optimal serving cells. This helps achieve continuous coverage. In addition,
problems with delay, ping-pong, and non-logical handovers can be resolved by
optimizing coverage, interference, and handover parameters.
39. HUAWEITECHNOLOGIES CO., LTD. Huawei Confidential Page 39
Handover Problem Analysis
Checking handover validity
Obtain source and target cells using drive test software and then check whether handovers are
performed between two cells that are geographically far using Mapinfo.
Checking interference
Check interference in both source and target cells because handover failures may be caused
by uplink or downlink interference.
Checking coverage
Check source and target cells for cross coverage, imbalance between uplink and downlink, and
carrier-level receive quality and level.
Check contents
Check handovers based on RSRPs measured in UE drive tests.
1. Verify that RSRPs in the expected source and target cells are maximum.
2. Verify that the absolute RSRPs in the source and target cells are reasonable at a
handover point. In other words, handovers are not allowed if signal quality is excessively
poor. Specific RSRPs are determined based on the entire RSRPs on a network.
40. HUAWEITECHNOLOGIES CO., LTD. Huawei Confidential Page 40
Case: Service Drops Caused by Missing
Neighboring Cell Configuration
Symptom
As shown in the upper right figure, a
UE sends multiple measurement
reports but is not handed over,
which may be caused by missing
neighboring cell configuration.
Analysis
According to measurement reports,
the UE sends an A3 report of cell
64. However, the
RRCConnectionReconfiguration
message in the lower right figure
shows that the current cell is cell
278 (the first cell) and cell 64 is not
included in the message. This
indicates that cells 278 and 64 are
not configured as neighboring cells.
Neighboring cell configuration on
live networks can be checked for
further confirmation.
Solution
Configure cells 278 and 64 as
neighboring cells.
41. HUAWEITECHNOLOGIES CO., LTD. Huawei Confidential Page 41
Summary
RF optimization involves adjustment of neighboring cell lists and engineering parameters.
Most coverage and interference problems can be resolved by taking the following measures
(sorted in descending order by priority):
Adjusting antenna tilts
Adjusting antenna azimuths
Adjusting antenna height
Adjusting antenna position
Adjusting antenna types
Adding TMAs
Adjusting site position
Adding sites or RRUs
This document describes what are involved in the RF optimization phase of network optimization. RF optimization
focuses on improvement of signal distribution and provides a good radio signal environment for subsequent
service parameter optimization. RF optimization mainly use drive tests, which can be supplemented by other tests.
RF optimization focuses on coverage and handover problems, which can be supplemented by other problems. RF
optimization aims to resolve handover, service drop, access, and interference problems caused by these
problems. Engineering parameters and neighboring cell lists are adjusted in the RF optimization phase, while cell
parameters are adjusted in the parameter optimization phase.