This review article details the development and validation of a high-performance liquid chromatography (HPLC) method for determining valsartan in bulk and pharmaceutical formulations. Utilizing design expert software, the method was optimized with a mobile phase of acetonitrile and phosphate buffer, achieving a high level of precision and accuracy as per ICH guidelines. The results indicate that the developed method is suitable for routine analysis in quality control laboratories.
![International Journal of Trend in Scientific Research and Development (IJTSRD)
Volume 4 Issue 6, September-October 2020 Available Online: www.ijtsrd.com e-ISSN: 2456 – 6470
@ IJTSRD | Unique Paper ID – IJTSRD33435 | Volume – 4 | Issue – 6 | September-October 2020 Page 676
Review Article on Valsartan
Mr. Sandeep Markad, Dr. Amit Kasabe, Dr. Ashok Bhosale
Department of Pharmaceutical Quality Assurance, Shankarrao Ursal College of
Pharmaceutical Sciences & Research Centre, Kharadi, Pune, Maharashtra, India
ABSTRACT
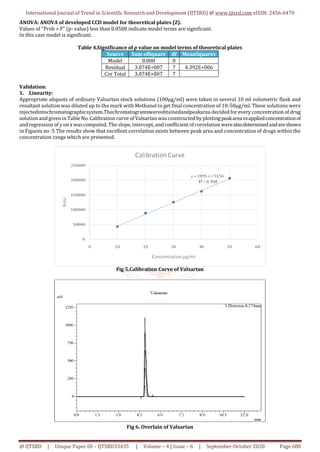
A simple, sensitive, rapidand reproducible HPLCmethod has been developed
and validated for Calibration determination of Valsartan in bulk and in
pharmaceutical formulation by applying Quality intentionally. For
development of HPLC method for Valsartan various trials are performed by
using Design Expert software by applying 3 level factorial designs.
Quantitative method development by optimization from trials intentionally
Expert software. The Optimized method Desirabilityis0.998 for Mobile Phase
ACN: Phosphate Buffer (65:35) in3.5 pH at maximum Wavelength 274nm at
column oven temperature 40°C. The flow of mobile phase was adjusted 1.0
ml/min. and therefore the injection volume 10 µl. Optimised Standard curve
showed a parametric statistic is 0.998. Retention time wasfoundtobe4.6min.
the half of recovery was found to be within the bounds of the acceptance
criteria with average recovery of 99.4 you take care of Valsartan. The tactic
was validated as per ICH guidelines. The precision and repeatability results
showed % RSD but 2%. The developed method was successfully validated in
consistent with ICH guidelines. Hence, these methods are often conveniently
adopted for the routine analysis in internal control laboratories.
KEYWORDS: Quality intentionally, Valsartan, HPLC, Design Expert Software
How to cite this paper: Mr. Sandeep
Markad | Dr. Amit Kasabe | Dr. Ashok
Bhosale "Review Article on Valsartan"
Published in
International Journal
of Trend in Scientific
Research and
Development (ijtsrd),
ISSN: 2456-6470,
Volume-4 | Issue-6,
October 2020,
pp.676-683, URL:
www.ijtsrd.com/papers/ijtsrd33435.pdf
Copyright © 2020 by author(s) and
International Journal of TrendinScientific
Research and Development Journal. This
is an Open Access article distributed
under the terms of
the Creative
Commons Attribution
License (CC BY 4.0)
(http://creativecommons.org/licenses/by/4.0)
INTRODUCTION
Valsartan may be a non-peptide compound, chemically
describes as“(S)-3-methyl-2-(N-{[2′-(2H-1,2,3,4-tetrazol-5-
yl)biphenyl-4-yl]methyl}-pentanamido)-butanoicacid”,(Val,
Figure 1) used as angiotensin II receptor antagonist having
high specificity for AT1 subtype1. Angiotensin II receptor
antagonists,also referred to as angiotensinreceptorblockers
(ARBs) or sartans, are a gaggle of pharmaceuticals that
modulate the renin-angiotensin-aldosterone system.
Currently, there are seven ARBs (losartan, valsartan,
candesartan, irbesartan, eprosartan, telmisartan and
olmisartan) which are approved by USFDA and utilized in
preventing first occurrence of fibrillation than beta-blocker
(atenolol) or calcium antagonist (amlodipine) therapy2.
Hydrochlorothiazide chemically describes as “6-chloro-3,4-
dihydro-2H-1,2,4-benzothiadiazine-7-sulfonamide” (HCT,
Figure 1b) is employed as diuretic in binary combination
with thecardiovascular agents so as to extend their effects3-
4. Several HPLC methods for the estimation ofARBalongside
HCT4-6 were reported during last 20 years. Simultaneous
determination of Val and HCT using various
spectrophotometric methods7-11, HPLC12-16,HPTLC15,17,
and capillary electrophoresis18 is documented.Additionally,
HPLC-MS–MS was applied for the quantification of both
drugs in human plasma.
Figure 1: Structure of Valsartan
Although a couple of published methods, are stability
indicating developed on random basis by modifying one
parameter (“One parameter ata time”, OPAT). ICH (ICH, Q8-
R1, R2) guideline states “Quality by Design” (QbD) as “a
systematic approach to development that begins with
predefined objectives and emphasizes product and process
understanding and process control, supportedsoundscience
and quality risk management” 22,23. Literature survey
reveals that a non-stability indicating HPLC method16 was
developed utilizing design of experiment protocol (DoE) for
estimation of valsartan. The parameters studied were pH
(2.8 to 3.2), flow-rate (0.8 to 1.2 ml/min) and detection
wavelength (248 to 252 nm). Careful examination indicates
that the pH and wavelength are producing moderate slight
IJTSRD33435](https://image.slidesharecdn.com/120reviewarticleonvalsartan-201124045457/85/Review-Article-on-Valsartan-1-320.jpg)
![International Journal of Trend in Scientific Research and Development (IJTSRD)
Volume 4 Issue 6, September-October 2020 Available Online: www.ijtsrd.com e-ISSN: 2456 – 6470
@ IJTSRD | Unique Paper ID – IJTSRD33435 | Volume – 4 | Issue – 6 | September-October 2020 Page 676
Review Article on Valsartan
Mr. Sandeep Markad, Dr. Amit Kasabe, Dr. Ashok Bhosale
Department of Pharmaceutical Quality Assurance, Shankarrao Ursal College of
Pharmaceutical Sciences & Research Centre, Kharadi, Pune, Maharashtra, India
ABSTRACT
A simple, sensitive, rapidand reproducible HPLCmethod has been developed
and validated for Calibration determination of Valsartan in bulk and in
pharmaceutical formulation by applying Quality intentionally. For
development of HPLC method for Valsartan various trials are performed by
using Design Expert software by applying 3 level factorial designs.
Quantitative method development by optimization from trials intentionally
Expert software. The Optimized method Desirabilityis0.998 for Mobile Phase
ACN: Phosphate Buffer (65:35) in3.5 pH at maximum Wavelength 274nm at
column oven temperature 40°C. The flow of mobile phase was adjusted 1.0
ml/min. and therefore the injection volume 10 µl. Optimised Standard curve
showed a parametric statistic is 0.998. Retention time wasfoundtobe4.6min.
the half of recovery was found to be within the bounds of the acceptance
criteria with average recovery of 99.4 you take care of Valsartan. The tactic
was validated as per ICH guidelines. The precision and repeatability results
showed % RSD but 2%. The developed method was successfully validated in
consistent with ICH guidelines. Hence, these methods are often conveniently
adopted for the routine analysis in internal control laboratories.
KEYWORDS: Quality intentionally, Valsartan, HPLC, Design Expert Software
How to cite this paper: Mr. Sandeep
Markad | Dr. Amit Kasabe | Dr. Ashok
Bhosale "Review Article on Valsartan"
Published in
International Journal
of Trend in Scientific
Research and
Development (ijtsrd),
ISSN: 2456-6470,
Volume-4 | Issue-6,
October 2020,
pp.676-683, URL:
www.ijtsrd.com/papers/ijtsrd33435.pdf
Copyright © 2020 by author(s) and
International Journal of TrendinScientific
Research and Development Journal. This
is an Open Access article distributed
under the terms of
the Creative
Commons Attribution
License (CC BY 4.0)
(http://creativecommons.org/licenses/by/4.0)
INTRODUCTION
Valsartan may be a non-peptide compound, chemically
describes as“(S)-3-methyl-2-(N-{[2′-(2H-1,2,3,4-tetrazol-5-
yl)biphenyl-4-yl]methyl}-pentanamido)-butanoicacid”,(Val,
Figure 1) used as angiotensin II receptor antagonist having
high specificity for AT1 subtype1. Angiotensin II receptor
antagonists,also referred to as angiotensinreceptorblockers
(ARBs) or sartans, are a gaggle of pharmaceuticals that
modulate the renin-angiotensin-aldosterone system.
Currently, there are seven ARBs (losartan, valsartan,
candesartan, irbesartan, eprosartan, telmisartan and
olmisartan) which are approved by USFDA and utilized in
preventing first occurrence of fibrillation than beta-blocker
(atenolol) or calcium antagonist (amlodipine) therapy2.
Hydrochlorothiazide chemically describes as “6-chloro-3,4-
dihydro-2H-1,2,4-benzothiadiazine-7-sulfonamide” (HCT,
Figure 1b) is employed as diuretic in binary combination
with thecardiovascular agents so as to extend their effects3-
4. Several HPLC methods for the estimation ofARBalongside
HCT4-6 were reported during last 20 years. Simultaneous
determination of Val and HCT using various
spectrophotometric methods7-11, HPLC12-16,HPTLC15,17,
and capillary electrophoresis18 is documented.Additionally,
HPLC-MS–MS was applied for the quantification of both
drugs in human plasma.
Figure 1: Structure of Valsartan
Although a couple of published methods, are stability
indicating developed on random basis by modifying one
parameter (“One parameter ata time”, OPAT). ICH (ICH, Q8-
R1, R2) guideline states “Quality by Design” (QbD) as “a
systematic approach to development that begins with
predefined objectives and emphasizes product and process
understanding and process control, supportedsoundscience
and quality risk management” 22,23. Literature survey
reveals that a non-stability indicating HPLC method16 was
developed utilizing design of experiment protocol (DoE) for
estimation of valsartan. The parameters studied were pH
(2.8 to 3.2), flow-rate (0.8 to 1.2 ml/min) and detection
wavelength (248 to 252 nm). Careful examination indicates
that the pH and wavelength are producing moderate slight
IJTSRD33435](https://image.slidesharecdn.com/120reviewarticleonvalsartan-201124045457/75/Review-Article-on-Valsartan-1-2048.jpg)
![International Journal of Trend in Scientific Research and Development (IJTSRD) @ www.ijtsrd.com eISSN: 2456-6470
@ IJTSRD | Unique Paper ID – IJTSRD33435 | Volume – 4 | Issue – 6 | September-October 2020 Page 682
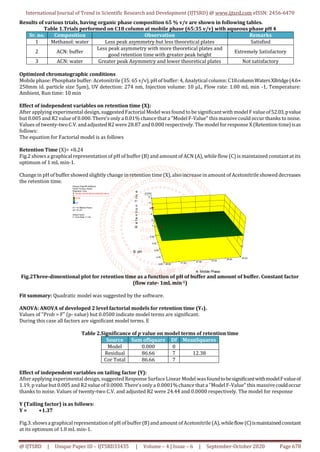
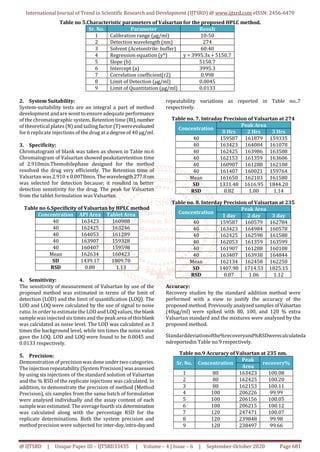
Robustness:
Robustness is a measure of capacity of a method to remain
unaffected by small, but deliberate variations in the method
conditions, and is indication so there liability of the method.
a method is robust, if it sun affected by small changes in
operating conditions. To determine the robustness of this
method, the experimental conditions were deliberately
altered at three different levels and retention time and
chromatographic response were evaluated .One factor at a
time was changed to study the effect .Variation of mobile
phase composition (Acetonitrile: Water and Acetonitrile:
buffer) and mobile phase flow rate by 1.0 ml/min had no
significant effect on the retention time and chromatographic
response of the 40 µg/ml solution, indicating that the
method was robust. The results are shown in Table no.10&
11 respectively.
Table no. 10 Robustness of Valsartan at 274. Nm
Conc. (µg/ml)
Area
Acetonitrile:
Buffer
Acetonitrile:
Water
40 161879 12126
40 163084 12568
40 163986 12689
40 161359 12689
40 161288 12878
40 160021 12888
Mean 161936 12640
SD 1410.23 280.12
RSD 0.87 2.22
Table no. 11 Robustness of Valsartan at 274 nm and
265 nm
Conc. (µg/ml)
Area
274 nm 265 nm
40 162587 150815
40 163423 153579
40 163825 154284
40 162153 153968
40 159907 153277
40 161407 150589
Mean 162217 152752
SD 1426.41 1625.78
RSD 0.88 1.06
References:
[1] Khopkar SM. Basic Concept of Analytical Chemistry.
2nd ed. New Delhi: New Age International Ltd.
Publishers; 1998. p. 1, 178-179.
[2] Christen GD. Analytical Chemistry. 5th ed. John Wiley
and Sons; 2003. p. 35-42, 131-132.
[3] Skoog DA, Holler FJ, Crouch SR. Principle of
Instrumental Analysis. 5th ed. Thomson Brooks/Cole.;
2004. p. 1-2, 678-688.
[4] Beckett AH, Stenlake JB. Practical Pharmaceutical
Chemistry. Part-2. 4th ed. New Delhi: CBS Publishers
and Distributors; 2002. p. 275-325.
[5] Chatwal GR, Sharma AK. Instrumental Methods of
qualitative analysis. 5thed. Mumbai: Himalaya
Publishing House; 2002. p. 2.149-2.184.
[6] handbook Pharmaspec, UV 1601 Series, Operation
Guide, Shimadzu Spectrophotometer. Japan:Shimadzu
Corporation Koyoto; 2001. p. 5.16, 8.2.
[7] Swarbrick J, Boylan JC. Encyclopedia ofPharmaceutical
Technology. Vol-1. 3rd ed. New York: Marcel Dekker
Inc.; 1997. p. 538-540.
[8] Skoog DA, Holler FJ, Nieman TA. Principles of
Instrumental Analysis. 6th ed., Thomson Brooks/Cole.;
2007. p. 762-63,816-827.
[9] Dong MW. Modern HPLCfor practicing scientists.New
Jersey: John Wiley & Sons, Inc., Publication, Hoboken;
2006.p. 1-9.
[10] Sethi PD. High Performance Liquid Chromatography,
quantitative chemical analysis of Pharmaceutical
Formulations. 1st ed. New Delhi: CBS Publishers and
Distributors; 2001.p. 3-11, 116-120.
[11] Weston A, Brown PR. High Performance Liquid
Chromatography, and CE – Principles and practice. 1st
ed. California: Academic Press; 1997. p. 1-4, 8-11, 24-
26, 29-32, 71.
[12] Willard HH, Meritt LL, Dean JA, Settle F. Instrumental
Method of study, 7th ed. Delhi: CBS Publishers and
Distributors; 2001.p.14.
[13] Swadesh JK. HPLC Practical and Industrial
Applications. 2nd ed. USA:CRCPress;2000.p.141-143.
[14] ICH, (Q2R1), Harmonized Tripartite Guideline,
Validation of analytical procedures: Text and
Methodology, IFPMA. Geneva; 2005. p. 1- 13.
[15] ICH, (Q2A), Harmonized Tripartite Guideline, Text on
Validation of Analytical Procedures. IFPMA. Geneva;
1994. p. 1-5.
[16] ICH, (Q2B), Harmonized Tripartite Guideline,
Validation of AnalyticalProcedures: Methodology,Text
and Methodology, IFPMA. Geneva; 1996. p. 1-8.
[17] The United state Pharmacopoeia, The National
formulary, Asian ed. USA: published by United state
pharmacopoeial convention; 2003. p. 960.
[18] Nash RA, Wachter AH. Pharmaceutical process
validation. 3rd ed. New York: Marcel DekkerInc.;2003.
p. 1-10.
[19] Gennaro AR. Remington: The Science and Practice of
Pharmacy. 20th ed. vol-1. Philadelphia: Lippincott
Williams and Wilkin; 2000. Page no.587.
[20] Anjeneyulu Y, Chandrasekhar K, Manikam V. A
Textbook of Analytical Chemistry. Pharmamed Press
BSP Books; 2008.p.1-2.
[21] Somenath M. Sample Preparation Techniques in
Analytical Chemistry. 1st ed. New York: Wiley
Interscience; 2003. P.13-16.
[22] Raynord P. Liquid Chromatography for the Analyst.
New York: Marcel Dekker Inc; 1994. p.2.
[23] Scott RW. Principal and Practice of Chromatography.
1st ed. Chrom-Ed Book Series. p. 1-3, 12-14.](https://image.slidesharecdn.com/120reviewarticleonvalsartan-201124045457/85/Review-Article-on-Valsartan-7-320.jpg)
![International Journal of Trend in Scientific Research and Development (IJTSRD) @ www.ijtsrd.com eISSN: 2456-6470
@ IJTSRD | Unique Paper ID – IJTSRD33435 | Volume – 4 | Issue – 6 | September-October 2020 Page 683
[24] D. M. Brahmankar and Sunil B. Jaiswal,
Biopharmaceutics and Pharmacokinetics, 3rd Edition,
Delhi VallabhPrakashan, Page No-9 to 35.
[25] ICH, Guidance on Analytical Method Validation, In:
Proceeding of the International Convention on Quality
for the Pharmaceutical Industry. Toronto, Canada;
2002.
[26] Alfonso R. Gennaro, Remington: The Science and
Practice of Pharmacy, Volume II, 20th Edition,
Lippincott Williams and Wilkins Publication.
[27] Pharmaceutical Dosage Forms: ParenteralMedications
Volume I, 2nd Edition Edited by Kenneth E. Avis,
Herbert A. Liberman and Leon Lachman.
[28] Theory and Practice of commercial Pharmacy, ByLeon
Lachman, Herbert A. Liberman, Joseph L. Kanig, 3rd
Edition, Indian Edition, Varghese publisher, Dadar,
Bombay.
[29] The Merck Index, An Encyclopedia Of Chemical, Drug’s
and Biologicals. Maryadele J. O. Neil. Eds, 14th ed.
Whitehouse Station, NJ: Published by Merck lab,
Division of Merck and co. Inc; 2006. p. 857, 1422.](https://image.slidesharecdn.com/120reviewarticleonvalsartan-201124045457/85/Review-Article-on-Valsartan-8-320.jpg)