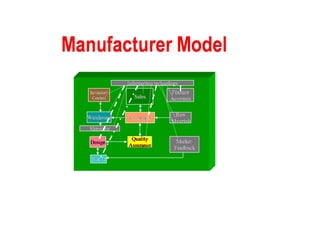
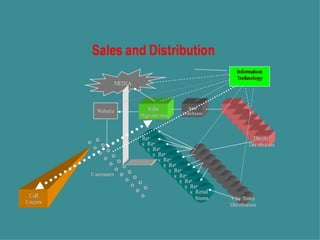
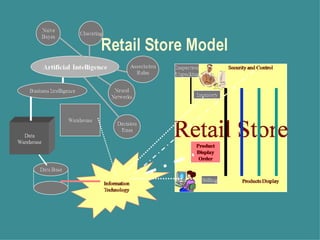
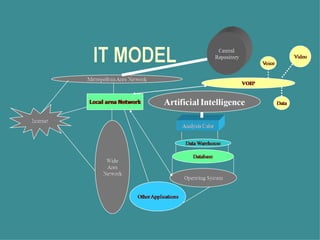
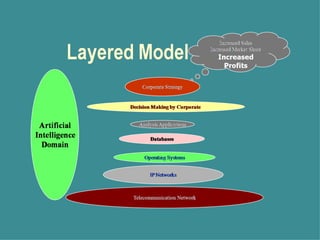
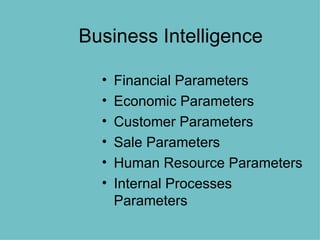
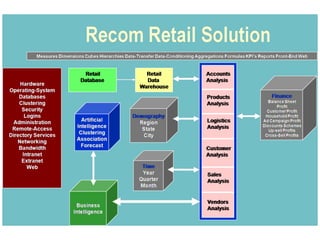
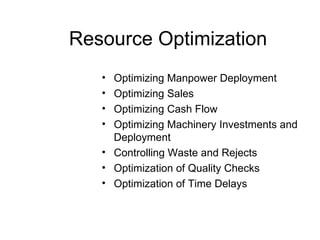
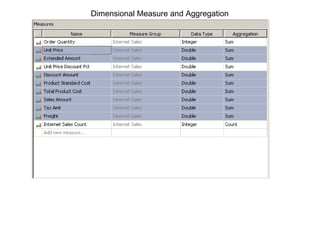
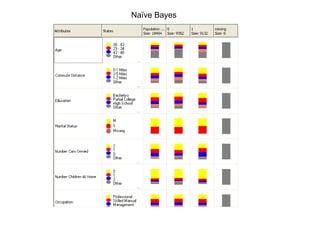
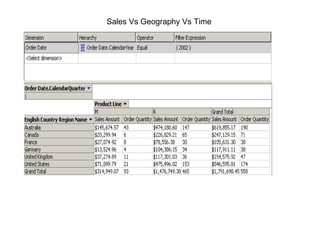
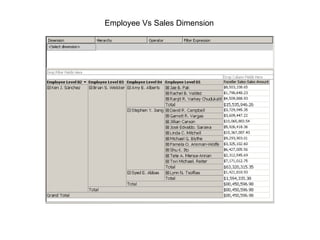
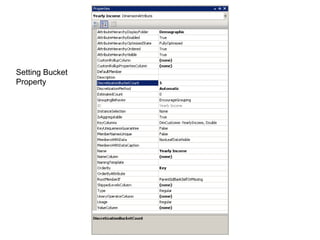
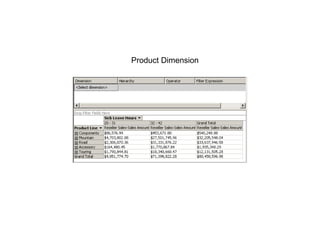
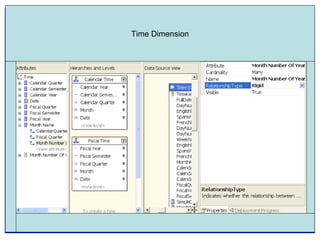
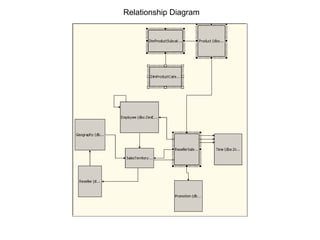
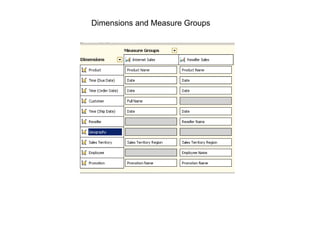
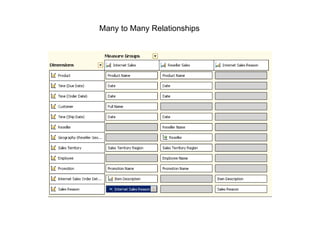
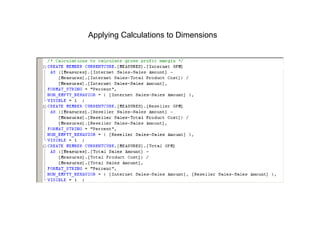
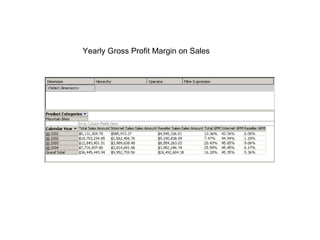
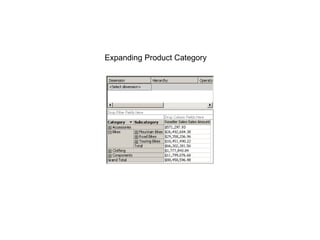
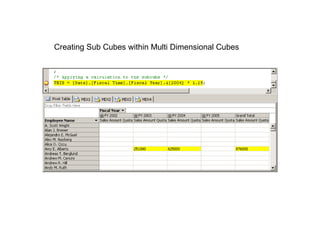
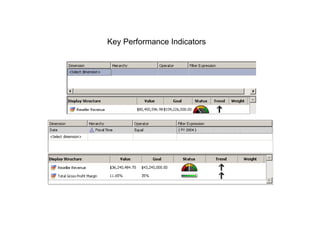
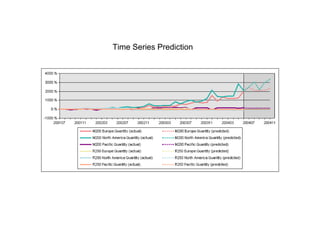
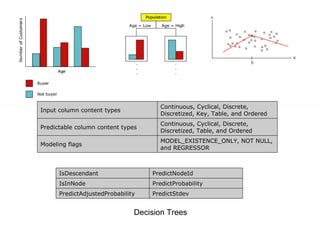
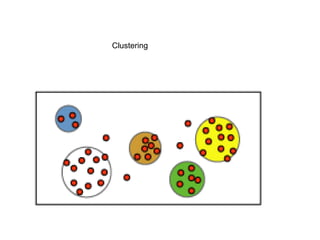
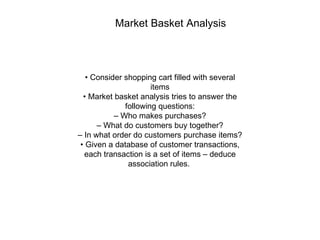
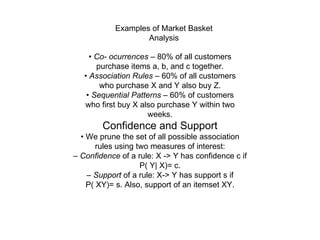
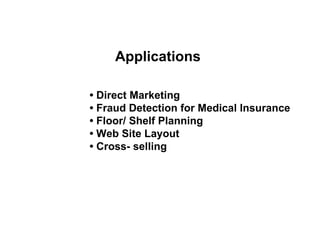
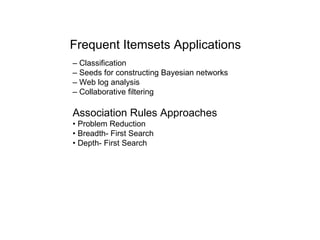
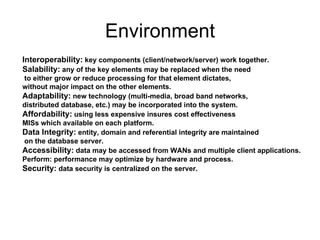
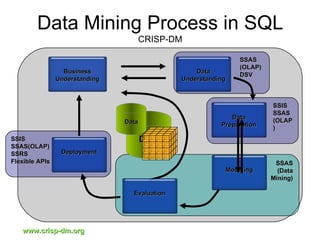
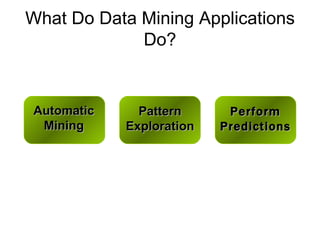
Recom Retail Solution
Introduction Retail Model is centered around manufacturer in countries like India This model is designed for forward integration and backward integration Model driver is supply and demand Major Control is in hands of Government


Business Intelligence Financial Parameters Economic Parameters Customer Parameters Sale Parameters Human Resource Parameters Internal Processes Parameters
 
Customized Solutions Solutions for Quick response to changing market conditions Critical Reports available at Intranet, email and desktop applications Integration of Corporate strategy and performance Increases overall efficiency, profitability and market share  Information Security maintained over the value chain
Critical Business Information Processing Critical business information is processed quickly which otherwise can take days and even months to consolidate Large amount of data analyzed and processed Forecasting tools using Artificial Intelligence have uncanny predicting abilities
Analyzing Dimensions Business information is analyzed on country-wise, region-wise, state-wise or city-wise Analysis using Branch wise on hundreds of parameters Branch-wise and year-wise, quarter-wise, month-wise or date-wise Customer-wise sales and trends Forecasting trends on multiple parameters and dimensions Associating Customers for sale trends Creating Cluster  Up-Selling and Cross-selling Arranging Display Racks of Products using AI Tools  Creating Sales Campaign using AI tools
Resource Optimization Optimizing Manpower Deployment Optimizing Sales Optimizing Cash Flow Optimizing Machinery Investments and Deployment Controlling Waste and Rejects Optimization of Quality Checks Optimization of Time Delays
Dimensional Measure and Aggregation
Naïve Bayes
Sales Vs Geography Vs Time
Customer Vs Geographical Dimension
Customer Dimension
Geographical Dimension
Employee VS Sales Hierarchical Dimension
Employee Vs Sales Dimension
Setting Bucket Property
Product Dimension
Time Dimension
Relationship Diagram
Dimensions and Measure Groups
Many to Many Relationships
Applying Calculations to Dimensions
Yearly Gross Profit Margin on Sales
Expanding Product Category
Creating Sub Cubes within Multi Dimensional Cubes
Key Performance Indicators
Time Series Prediction
Decision Trees Input column content types Continuous, Cyclical, Discrete, Discretized, Key, Table, and Ordered Predictable column content types Continuous, Cyclical, Discrete, Discretized, Table, and Ordered Modeling flags MODEL_EXISTENCE_ONLY, NOT NULL, and REGRESSOR IsDescendant PredictNodeId IsInNode PredictProbability PredictAdjustedProbability PredictStdev
Clustering
Market Basket Analysis   •  Consider shopping cart filled with several items •  Market basket analysis tries to answer the following questions: –  Who makes purchases? –  What do customers buy together? –  In what order do customers purchase items? •  Given a database of customer transactions, each transaction is a set of items – deduce association rules.
Examples of Market Basket Analysis •  Co- ocurrences  – 80% of all customers purchase items a, b, and c together. •  Association Rules  – 60% of all customers who purchase X and Y also buy Z. •  Sequential Patterns  – 60% of customers who first buy X also purchase Y within two weeks. Confidence and Support •  We prune the set of all possible association rules using two measures of interest: –  Confidence  of a rule: X -> Y has confidence c if P( Y| X)= c. –  Support  of a rule: X-> Y has support s if P( XY)= s. Also, support of an itemset XY.
•  Direct Marketing •  Fraud Detection for Medical Insurance •  Floor/ Shelf Planning •  Web Site Layout •  Cross- selling Applications
Frequent Itemsets Applications   –  Classification –  Seeds for constructing Bayesian networks –  Web log analysis –  Collaborative filtering Association Rules Approaches •  Problem Reduction •  Breadth- First Search •  Depth- First Search
Environment Interoperability:  key components (client/network/server) work together. Salability:  any of the key elements may be replaced when the need to either grow or reduce processing for that element dictates,  without major impact on the other elements. Adaptability:  new technology (multi-media, broad band networks,  distributed database, etc.) may be incorporated into the system. Affordability:  using less expensive insures cost effectiveness  MISs which available on each platform. Data Integrity:  entity, domain and referential integrity are maintained on the database server. Accessibility:  data may be accessed from WANs and multiple client applications. Perform: performance may optimize by hardware and process. Security:  data security is centralized on the server.
Data Warehouse One or more tools to extract fields from any kind of data structure (flat, hierarchical, relational, or object) including external data. The synthesis of the data into a nonvolatile, integrated, subject oriented database with a metadata “catalog.” All AI applications on Data Warehouse
Data Warehouse Advantages Improves product inventory turns  Costs of product introduction are decreased, with improved selection of target markets Separating query processing from running against operational databases enables most cost-effective decision making  Improved productivity, by keeping all required data in single location and eliminates rekeying of data  Reduced redundant processing, support, and software to support overlapping decision support applications  Enhanced customer relations through improved knowledge of individual requirements and trends, through customization, improved communications
Data Ware House Design Considerations Heterogeneity of data sources, which affects data conversion, equality, timeless Use  of historical data, which implies that data may be “old” Tendency of databases to grow very large  The database management system that supports the warehouse database  The communications infrastructure that connects the ware- house, data marks, operational system, and end users  The systems management framework that enables centralized management and administration of the entire environment
Data Mining   Identification of Patterns to guide marketing Discovering meaningful new correlation, patterns, and trends by digging into (mining) large amounts of data  Using artificial intelligence (AI) and statistical and mathematical techniques  Data mining uses well-established statistical and machine learning techniques to build model that predict customer behavior  Automating the mining process, integrating it with commercial data warehouses, and presenting it in relevant way for business users
Data Mining  Continued Data mining techniques can yield the benefits of automation when implemented on existing software and hardware platform and can be implemented on new systems as existing upgraded and new products developed When data mining tools are implemented on high performance parallel processing systems, they can analyze massive database in minutes  Data mining software can help to find the high-profits gems buried in mountains of information
Database Selection and Preparation  This step includes the identification of databases and factors to be explored  Whenever possible, required records can be retrieved using a live data dictionary  Data preparation includes filling in missing values and removing errors
Analysis  The large database groups defined during the preparation phase are further divided using clustering techniques  Determine which factors are involved in the maximization of particular goals
Typical Sales Report for Internet Sales Row Labels Internet Order Count Internet Average Sales Amount Internet Average Unit Price Internet Extended Amount Internet Freight Cost CY Q1 6,984 1072.287903 490.9439303 $7,488,858.71  $187,222.15  Accessories 4,619 37.57320416 19.11140073 $173,550.63  $4,339.16  Accessories 4,619 37.57320416 19.11140073 $173,550.63  $4,339.16  Bikes 3,853 1876.266344 1876.266344 $7,229,254.22  $180,731.53  Bikes 3,853 1876.266344 1876.266344 $7,229,254.22  $180,731.53  Clothing 1,930 44.58749223 37.09218103 $86,053.86  $2,151.45  Clothing 1,930 44.58749223 37.09218103 $86,053.86  $2,151.45  CY Q2 8,021 1131.331797 511.7246006 $9,074,412.34  $226,861.10  Accessories 5,171 38.62985496 19.55889357 $199,754.98  $4,994.32  Accessories 5,171 38.62985496 19.55889357 $199,754.98  $4,994.32  Bikes 4,883 1797.313654 1797.313654 $8,776,282.57  $219,407.29  Bikes 4,883 1797.313654 1797.313654 $8,776,282.57  $219,407.29  Clothing 2,170 45.33400461 37.30557072 $98,374.79  $2,459.49  Clothing 2,170 45.33400461 37.30557072 $98,374.79  $2,459.49  CY Q3 5,851 964.884227 451.4985295 $5,645,537.61  $141,138.99  Accessories 3,906 39.02180492 19.56851586 $152,419.17  $3,810.81  Accessories 3,906 39.02180492 19.56851586 $152,419.17  $3,810.81  Bikes 2,774 1953.86977 1953.86977 $5,420,034.74  $135,501.00  Bikes 2,774 1953.86977 1953.86977 $5,420,034.74  $135,501.00  Clothing 1,564 46.72870844 37.65260175 $73,083.70  $1,827.18  Clothing 1,564 46.72870844 37.65260175 $73,083.70  $1,827.18  CY Q4 6,803 1050.987587 479.6316196 $7,149,868.55  $178,747.38  Accessories 4,512 38.79325798 19.42892441 $175,035.18  $4,376.27  Accessories 4,512 38.79325798 19.42892441 $175,035.18  $4,376.27  Bikes 3,695 1865.37838 1865.37838 $6,892,573.11  $172,314.50  Bikes 3,695 1865.37838 1865.37838 $6,892,573.11  $172,314.50  Clothing 1,797 45.77643851 37.34010894 $82,260.26  $2,056.61  Clothing 1,797 45.77643851 37.34010894 $82,260.26  $2,056.61  Grand Total 27,659 1061.451145 486.0869105 $29,358,677.22  $733,969.61
Data Mining as an Application Platform
What is Data Mining Anyway? Machine learning of patterns in data Application of patterns to new data
Comparative Benefits Predictive Projects versus Nonpredictive Projects
“ Data Mining is Hard” “ White-coats”  only need apply How do you  …  define problem? …  select data? …  choose inputs? …  choose outputs? …  interpret results? …  validate results?
What Does Data Mining Do? Explores Your Data Finds Patterns Performs Predictions
What does Data Mining do? Illustrated DM Engine DM Engine Predicted Data DB data Client data Application data DB data Client data Application data “ Just one row ” Mining Model Data  To Predict Training Data Mining Model Mining Model
Server Mining Architecture Analysis Services Server Mining Model Data Mining Algorithm Data Source Your Application OLE DB/ ADOMD/ XMLA Deploy BI Dev Studio  (Visual Studio) App Data
Data Mining Process CRISP-DM “ Putting Data Mining to Work” “ Doing Data Mining” Data www.crisp-dm.org Business Understanding Data Understanding Data Preparation Modeling Evaluation Deployment
Data Mining Process in SQL CRISP-DM SSAS (Data Mining) SSAS (OLAP) DSV SSIS SSAS(OLAP) SSRS Flexible APIs SSIS SSAS (OLAP) Data www.crisp-dm.org Data Business Understanding Data Understanding Data Preparation Modeling Evaluation Deployment
What Do Data Mining Applications Do? Finds Patterns Performs Predictions Explores Your Data Automatic Mining Pattern Exploration Perform Predictions
Algorithm Training Algorithm Module Case Processor (generates and prepares all training cases) StartCases Process One Case Converged/complete? No Yes Done! Persist patterns
DM data flow New Dataset Cube Historical Dataset Data Transform (DTS) Reporting Mining Models Model Browsing Prediction LOB Application Cube
Prediction Parser Validation-I & Initialization AST Binding & Validation-II DMX tree Execution Planning DMX tree Input data Read / Evaluate one row Push response Untokenize results Income Gender $50,000 F 1 2 50000 2 1 2 3 50000 2 1 Income Gender Plan $50,000 F Attend

Retail Design

  • 1.
  • 2.
    Introduction Retail Modelis centered around manufacturer in countries like India This model is designed for forward integration and backward integration Model driver is supply and demand Major Control is in hands of Government
  • 3.
  • 4.
  • 5.
  • 6.
  • 7.
  • 8.
    Business Intelligence FinancialParameters Economic Parameters Customer Parameters Sale Parameters Human Resource Parameters Internal Processes Parameters
  • 9.
  • 10.
    Customized Solutions Solutionsfor Quick response to changing market conditions Critical Reports available at Intranet, email and desktop applications Integration of Corporate strategy and performance Increases overall efficiency, profitability and market share Information Security maintained over the value chain
  • 11.
    Critical Business InformationProcessing Critical business information is processed quickly which otherwise can take days and even months to consolidate Large amount of data analyzed and processed Forecasting tools using Artificial Intelligence have uncanny predicting abilities
  • 12.
    Analyzing Dimensions Businessinformation is analyzed on country-wise, region-wise, state-wise or city-wise Analysis using Branch wise on hundreds of parameters Branch-wise and year-wise, quarter-wise, month-wise or date-wise Customer-wise sales and trends Forecasting trends on multiple parameters and dimensions Associating Customers for sale trends Creating Cluster Up-Selling and Cross-selling Arranging Display Racks of Products using AI Tools Creating Sales Campaign using AI tools
  • 13.
    Resource Optimization OptimizingManpower Deployment Optimizing Sales Optimizing Cash Flow Optimizing Machinery Investments and Deployment Controlling Waste and Rejects Optimization of Quality Checks Optimization of Time Delays
  • 14.
  • 15.
  • 16.
  • 17.
  • 18.
  • 19.
  • 20.
    Employee VS SalesHierarchical Dimension
  • 21.
  • 22.
  • 23.
  • 24.
  • 25.
  • 26.
  • 27.
    Many to ManyRelationships
  • 28.
  • 29.
    Yearly Gross ProfitMargin on Sales
  • 30.
  • 31.
    Creating Sub Cubeswithin Multi Dimensional Cubes
  • 32.
  • 33.
  • 34.
    Decision Trees Inputcolumn content types Continuous, Cyclical, Discrete, Discretized, Key, Table, and Ordered Predictable column content types Continuous, Cyclical, Discrete, Discretized, Table, and Ordered Modeling flags MODEL_EXISTENCE_ONLY, NOT NULL, and REGRESSOR IsDescendant PredictNodeId IsInNode PredictProbability PredictAdjustedProbability PredictStdev
  • 35.
  • 36.
    Market Basket Analysis • Consider shopping cart filled with several items • Market basket analysis tries to answer the following questions: – Who makes purchases? – What do customers buy together? – In what order do customers purchase items? • Given a database of customer transactions, each transaction is a set of items – deduce association rules.
  • 37.
    Examples of MarketBasket Analysis • Co- ocurrences – 80% of all customers purchase items a, b, and c together. • Association Rules – 60% of all customers who purchase X and Y also buy Z. • Sequential Patterns – 60% of customers who first buy X also purchase Y within two weeks. Confidence and Support • We prune the set of all possible association rules using two measures of interest: – Confidence of a rule: X -> Y has confidence c if P( Y| X)= c. – Support of a rule: X-> Y has support s if P( XY)= s. Also, support of an itemset XY.
  • 38.
    • DirectMarketing • Fraud Detection for Medical Insurance • Floor/ Shelf Planning • Web Site Layout • Cross- selling Applications
  • 39.
    Frequent Itemsets Applications – Classification – Seeds for constructing Bayesian networks – Web log analysis – Collaborative filtering Association Rules Approaches • Problem Reduction • Breadth- First Search • Depth- First Search
  • 40.
    Environment Interoperability: key components (client/network/server) work together. Salability: any of the key elements may be replaced when the need to either grow or reduce processing for that element dictates, without major impact on the other elements. Adaptability: new technology (multi-media, broad band networks, distributed database, etc.) may be incorporated into the system. Affordability: using less expensive insures cost effectiveness MISs which available on each platform. Data Integrity: entity, domain and referential integrity are maintained on the database server. Accessibility: data may be accessed from WANs and multiple client applications. Perform: performance may optimize by hardware and process. Security: data security is centralized on the server.
  • 41.
    Data Warehouse Oneor more tools to extract fields from any kind of data structure (flat, hierarchical, relational, or object) including external data. The synthesis of the data into a nonvolatile, integrated, subject oriented database with a metadata “catalog.” All AI applications on Data Warehouse
  • 42.
    Data Warehouse AdvantagesImproves product inventory turns Costs of product introduction are decreased, with improved selection of target markets Separating query processing from running against operational databases enables most cost-effective decision making Improved productivity, by keeping all required data in single location and eliminates rekeying of data Reduced redundant processing, support, and software to support overlapping decision support applications Enhanced customer relations through improved knowledge of individual requirements and trends, through customization, improved communications
  • 43.
    Data Ware HouseDesign Considerations Heterogeneity of data sources, which affects data conversion, equality, timeless Use of historical data, which implies that data may be “old” Tendency of databases to grow very large The database management system that supports the warehouse database The communications infrastructure that connects the ware- house, data marks, operational system, and end users The systems management framework that enables centralized management and administration of the entire environment
  • 44.
    Data Mining Identification of Patterns to guide marketing Discovering meaningful new correlation, patterns, and trends by digging into (mining) large amounts of data Using artificial intelligence (AI) and statistical and mathematical techniques Data mining uses well-established statistical and machine learning techniques to build model that predict customer behavior Automating the mining process, integrating it with commercial data warehouses, and presenting it in relevant way for business users
  • 45.
    Data Mining Continued Data mining techniques can yield the benefits of automation when implemented on existing software and hardware platform and can be implemented on new systems as existing upgraded and new products developed When data mining tools are implemented on high performance parallel processing systems, they can analyze massive database in minutes Data mining software can help to find the high-profits gems buried in mountains of information
  • 46.
    Database Selection andPreparation This step includes the identification of databases and factors to be explored Whenever possible, required records can be retrieved using a live data dictionary Data preparation includes filling in missing values and removing errors
  • 47.
    Analysis Thelarge database groups defined during the preparation phase are further divided using clustering techniques Determine which factors are involved in the maximization of particular goals
  • 48.
    Typical Sales Reportfor Internet Sales Row Labels Internet Order Count Internet Average Sales Amount Internet Average Unit Price Internet Extended Amount Internet Freight Cost CY Q1 6,984 1072.287903 490.9439303 $7,488,858.71 $187,222.15 Accessories 4,619 37.57320416 19.11140073 $173,550.63 $4,339.16 Accessories 4,619 37.57320416 19.11140073 $173,550.63 $4,339.16 Bikes 3,853 1876.266344 1876.266344 $7,229,254.22 $180,731.53 Bikes 3,853 1876.266344 1876.266344 $7,229,254.22 $180,731.53 Clothing 1,930 44.58749223 37.09218103 $86,053.86 $2,151.45 Clothing 1,930 44.58749223 37.09218103 $86,053.86 $2,151.45 CY Q2 8,021 1131.331797 511.7246006 $9,074,412.34 $226,861.10 Accessories 5,171 38.62985496 19.55889357 $199,754.98 $4,994.32 Accessories 5,171 38.62985496 19.55889357 $199,754.98 $4,994.32 Bikes 4,883 1797.313654 1797.313654 $8,776,282.57 $219,407.29 Bikes 4,883 1797.313654 1797.313654 $8,776,282.57 $219,407.29 Clothing 2,170 45.33400461 37.30557072 $98,374.79 $2,459.49 Clothing 2,170 45.33400461 37.30557072 $98,374.79 $2,459.49 CY Q3 5,851 964.884227 451.4985295 $5,645,537.61 $141,138.99 Accessories 3,906 39.02180492 19.56851586 $152,419.17 $3,810.81 Accessories 3,906 39.02180492 19.56851586 $152,419.17 $3,810.81 Bikes 2,774 1953.86977 1953.86977 $5,420,034.74 $135,501.00 Bikes 2,774 1953.86977 1953.86977 $5,420,034.74 $135,501.00 Clothing 1,564 46.72870844 37.65260175 $73,083.70 $1,827.18 Clothing 1,564 46.72870844 37.65260175 $73,083.70 $1,827.18 CY Q4 6,803 1050.987587 479.6316196 $7,149,868.55 $178,747.38 Accessories 4,512 38.79325798 19.42892441 $175,035.18 $4,376.27 Accessories 4,512 38.79325798 19.42892441 $175,035.18 $4,376.27 Bikes 3,695 1865.37838 1865.37838 $6,892,573.11 $172,314.50 Bikes 3,695 1865.37838 1865.37838 $6,892,573.11 $172,314.50 Clothing 1,797 45.77643851 37.34010894 $82,260.26 $2,056.61 Clothing 1,797 45.77643851 37.34010894 $82,260.26 $2,056.61 Grand Total 27,659 1061.451145 486.0869105 $29,358,677.22 $733,969.61
  • 49.
    Data Mining asan Application Platform
  • 50.
    What is DataMining Anyway? Machine learning of patterns in data Application of patterns to new data
  • 51.
    What is DataMining Anyway? Machine learning of patterns in data Application of patterns to new data
  • 52.
    Comparative Benefits PredictiveProjects versus Nonpredictive Projects
  • 53.
    “ Data Miningis Hard” “ White-coats” only need apply How do you … define problem? … select data? … choose inputs? … choose outputs? … interpret results? … validate results?
  • 54.
    What Does DataMining Do? Explores Your Data Finds Patterns Performs Predictions
  • 55.
    What does DataMining do? Illustrated DM Engine DM Engine Predicted Data DB data Client data Application data DB data Client data Application data “ Just one row ” Mining Model Data To Predict Training Data Mining Model Mining Model
  • 56.
    Server Mining ArchitectureAnalysis Services Server Mining Model Data Mining Algorithm Data Source Your Application OLE DB/ ADOMD/ XMLA Deploy BI Dev Studio (Visual Studio) App Data
  • 57.
    Data Mining ProcessCRISP-DM “ Putting Data Mining to Work” “ Doing Data Mining” Data www.crisp-dm.org Business Understanding Data Understanding Data Preparation Modeling Evaluation Deployment
  • 58.
    Data Mining Processin SQL CRISP-DM SSAS (Data Mining) SSAS (OLAP) DSV SSIS SSAS(OLAP) SSRS Flexible APIs SSIS SSAS (OLAP) Data www.crisp-dm.org Data Business Understanding Data Understanding Data Preparation Modeling Evaluation Deployment
  • 59.
    What Do DataMining Applications Do? Finds Patterns Performs Predictions Explores Your Data Automatic Mining Pattern Exploration Perform Predictions
  • 60.
    Algorithm Training AlgorithmModule Case Processor (generates and prepares all training cases) StartCases Process One Case Converged/complete? No Yes Done! Persist patterns
  • 61.
    DM data flowNew Dataset Cube Historical Dataset Data Transform (DTS) Reporting Mining Models Model Browsing Prediction LOB Application Cube
  • 62.
    Prediction Parser Validation-I& Initialization AST Binding & Validation-II DMX tree Execution Planning DMX tree Input data Read / Evaluate one row Push response Untokenize results Income Gender $50,000 F 1 2 50000 2 1 2 3 50000 2 1 Income Gender Plan $50,000 F Attend