Downloaded 23 times
![Analytics growing as a business mandate.
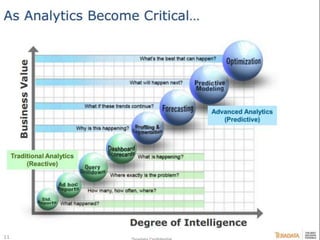
Data is Growing Performance Gap Widens Capability Gap Exists..
4.4x
2.7x
2.4x
2.4x
2x
Investment in Data and
Analytics
Top Performer Bottom Performer
Sources: IBM Breakaway Now with Business
Analytics and Optimization
17%
42%
28%
10%
USE OF DATA BY BUSINESS*
75% or more 50-74%
25-49% 0-24%
++ There is a skill gap
60% executives say they “have more
information than we can effectively
use”** [IBM Report] .
McKinsey Report on Big Data estimates
50-60% gap in the supply of deep
analytical talent; equaling 140,000 to
190,000 unfilled positions.
40% growth in global data
annually
Globally 2.5 quintillion bytes of
data per day
90 % of the data in the world
today has been created in the last
two years alone.
Customer Transactions
Customer records through device
ubiquity and better data mgmt..
1
Customer Interactions
Social Unstructure, semantics..
20B events / Day – Facebook
2
Machine Interactions
Logs sensors intelligence on all
equipment
3
IBM Report Global Business Analytics
market size is pegged around $105 billion
and growing at CAGR 8%.
Shifting Priorities for
Management in Analytics..](https://image.slidesharecdn.com/20150108analyticsvcafullssnetupl-160517030330/85/Analytics-Service-Framework-1-320.jpg)
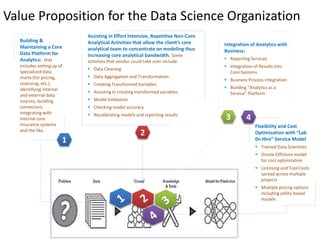
![Analytics Value to Business
Business
outcome
Operations
Transformation
Insights Data
•Customer Insight
•Digital Marketing
•Pricing / Risk
•Product Design
•Service / Operations
•BI / Dashboards
•Manual Operations
•Embedded Analytics
•CEP / Rules Engines
•RT Integration
•Analysis / Methods
•Prediction / Data Mining
•Machine Learning
•Sample vs Large Data
•Parameterized and NON
•Data Sources { External,
Unstructured }
•Data Integration {ETL}
•Data Lineage {Metadata}
•Data Preparation {Index,
Search}
•Customer Segmentation,
Behavior based models in
all industry
•Price Sensitivity analysis
•NPD / Molecule research
in Pharma
•Risk in BFSI
•Driving Digital Initiatives
like Mobile
•Triaging / Routing in
Contact centers
•Running a Analytics KPO
that provides insights for
Operations
•Methods like
Segmentation, Regression
based scoring,
• Sensitivity Scenarios ,
What-if
•Text and media mining
capabilities [ PCA ]
•Semantic Search
•70% of the effort is spelt
out in Data
•External sources, public
and paid..
•Text, media processing /
Index](https://image.slidesharecdn.com/20150108analyticsvcafullssnetupl-160517030330/85/Analytics-Service-Framework-5-320.jpg)
![Analytics Services Maturity Model
ALIGNED INTEGRATED OPTIMIZINGFRAGMENTED
DATAANALYTICSVISUALIZATIONPROCESS[ACTIONS]
SCALE / STRUCTURE
SOURCE / RETRIEVE
CONFIG - CONTROL
INTERACTION
ALGORITHM
MODELING
DESIGN
EXECUTE
MANAGE
PRESENTATION
STRUCTURE
Simple 2-Dimensional Graphs and
reports including Types of Visuals
supported?
Static simple play out
Simple structure, numeric [ cardinal]
and non-numeric- [ Ordinal]
Internal Local Files, federated
Ad-hoc Customer opportunity
Operational Changes >
Basic Functions and statistics
User Configuration, Data Security
Structured Data with metadata
support,
Integrated data sets through DB-
DWH, SQL based retrieve
Single Iteration playout
Computational Flows
Process Maps, Kpi- Metrics
Breakdowns,
Manual Process Change / Actions
Tactical Changes – re-structure to
Business operations, processes..
Linear Functions, Regression,
Statistics,
Strategy Changes - New services
models, synthesis of business value
Integrated Partner Actions,
Automation into systems,
scenario analysis, what -if analysis,
Complex Statistics [econometrics] ,
Numerical Method, Clustering
Analysis,
System Generation-Automation ,
visual re-formation,
Compliance and traceability effort in
adding new data sources
external connectors – API,
Composite Visuals, infographics
Unstructured text, Data Scale – Size
and time
Value Chain Analysis , Benchmark
Data
New Revenue Models
Sense and response mechanisms,
Simulation, optimization,
Text & Analytics, Neural Networks,
fractals,
Actions integration - external
systems.
Storyboards, Virtual Reality
late binding – auto discovery of
structure
Access to non standard data, late
structure binding
Real time search
Data as Media like Voice, Image and
Video Bigdata Management
pivot based interaction – User self
service
Maps, Multi-dimensional Graphs,](https://image.slidesharecdn.com/20150108analyticsvcafullssnetupl-160517030330/85/Analytics-Service-Framework-8-320.jpg)
![How are Businesses acquiring Analytics
Inhouse /
Captive
Solution
Utilities
Services /
Resources
Platforms /
Tools
1. A Typical Bank would have a 1Bn USD budget
2. 80% spend inhouse and in Captive
3. 1200 Person = 600Mn $ Value / 100 Mn $ Cost
4. Slow, lethargy, internal Constraints, IPR
1. Small Boutique companies getting seeded
2. Focusing on either large platforms [ splunk ] or a
very specific Business use Case [ Mydrive ]
3. Scale issues, pricing,
1. Large resource houses, with 80% $ from staff Aug
2. Fragmented delivery, water fall, change is a
challenge , Utilisation is key , security & leakage
3. Can Scale, some can partner,
1. Best complement to Inhouse / Captive
2. Developing the foundations for the next gen,
3. Focused more on tech rather than business
4. Partner to all above entities,](https://image.slidesharecdn.com/20150108analyticsvcafullssnetupl-160517030330/85/Analytics-Service-Framework-9-320.jpg)
![Typical Analytics Practice
Strategic Eco-system Alliances
1051
Analytics [ 140 – 60 USD ]
BI [ 100 - 40 USD ]
Data / Integration [ 100 – 30 USD]
1. 80% of the business is still Staff
Augmentation
2. 80% of the business in BI / MI and
low end data services..
3. Large players like Wipro / TCS /
MuSigma in the range of 5000-
10000 resources
4. Lot of SME consulting Smaller
players
5. Clients are slower than the vendor..
1. Staff Augmentation in various Skill Areas
2. Partnering and COE development for clients
3. Project based Delivery – Agile Waterfall
4. Embedded Analytics in Operations and other initiatives
like Digital, mobile etc..
5. Service Transformational Analytics – CTS
6. Very weak in industry / Business domain](https://image.slidesharecdn.com/20150108analyticsvcafullssnetupl-160517030330/85/Analytics-Service-Framework-12-320.jpg)
![Industry Trend Past and Future
• Rapid directionless ops growth –
has helped ISV [+30% CAGR ]
• Bringing structured data together
• Now looking for Show and Tell + 0
consulting + More Action
• Shifting Operations to Offshore –
Captives
• Partnerships, COE, Investments,
Utilities = Value Add
• BI Sophistication has kept managers
in charm
• Integrated solutions with Digital
Initiatives
• Large Data Initiatives – Lakes,
Metadata, External Data
• IOT / more sensors, new data
• Unstructured Data, Media and
therefore Big Data
• Shift from Model to Compute
• Specific Business Use Cases
• Shift from Management to
Operations and thereby Customer
• Privacy and Security will be a big
issue
• More utilities and Plug-n-Play](https://image.slidesharecdn.com/20150108analyticsvcafullssnetupl-160517030330/85/Analytics-Service-Framework-13-320.jpg)
![What to look for..
• Deep integration with a Business
outcome [ MyDrive]
• Show and Tell / Productized
services
• Eco System Partnerships
• Non-Linear Scale in the Business
Model
• Easy to Consume, Utility, Pricing
• Ability to Partner / Co-innovate
• Future Proofing customers.
• Agile Delivery Models
• Charging and Collection Model
[RDC]
• Application potential across the
Economy [ MyDrive]
• Time to deploy and transform [
Splunk ]
Business Model Factors](https://image.slidesharecdn.com/20150108analyticsvcafullssnetupl-160517030330/85/Analytics-Service-Framework-14-320.jpg)
![Business Themes and Analytics COE
Marketing RoI & Growth analytics
Customer acquisition analytics
Customer retention analytics
Social media driven analytics
Customer/Employee fraud & risk
Competitive intelligence analytics
Supply chain analytics
MFG process quality & compliance
Early warning analytics
Asset Perf. Maint. & warranty
Network analytics
Service Problem Analysis
Service Logistic & Resource Alloc.
Governance, Risk & compliance
Integrated financial perf. - EPM
Store operations Analytics
Merchandising & Pricing analytics
Claims analytics
Pre-Trade Post Trade Analytics
Drug discovery analytics
Post market analytics (Pharma)
Care & Safety analytics
Care analytics
Member Retention Analytics
Smart meter analytics
Technology
Business Automation Modeling
Data
Analysis
Visuals
Process
People
Methods
Tools
Vertical
Themes
Customer
Lifecycle
Service &
Warranty
GRC
EPM/WIPM
• Product Mgrs [10]
• Clustered Solution
Themes + verticals
• Teams for Verticals
program mgmt
• Modelers &
Technologist report
in.
• Business Consulting
• Innovation &
Transformation
Client Pitch /
Engagement
• Analytics Program
Management
• Long term look at
business Automation
solutions
• Modelers
• Cluster Solution
Themes
• Exploring Analysis Tools
• Develop Models/Methods
• # Of experiments
• Play with data
• Information Technologist
• Cluster 1
• All Data Gather &
Aggregation technologies
• Solution Warranty / Scale
• Speed, Variety – API
• # Of experiments
• Manage COEEnv.
RCTG, HLS, E&U,
Insurance, Securities
Common + special
aspects.. 5PDM,
expanded slowly.
Telecom, RCTG, E&U,
Banking, Insurance
2 PDM
1 BFSI, 1 OTH
MFG, E&U, Telecom,
1 PDM ALL
BFSI
1PDM ALL
All verticals, close collab
with WCS](https://image.slidesharecdn.com/20150108analyticsvcafullssnetupl-160517030330/85/Analytics-Service-Framework-16-320.jpg)
![Reporting & BP IntegrationAnalytical Support Team
Data Integration
MODELINGINFRASTRUCTURE
Internal Data [AIG]
Enterprise
Doc Manager
Loss
Notification
System
Claim
Admin
System
Policy
Admin
System
GL/Paymen
t
Engine
Data Preparation
Dashboards
& Reports
ANALYSISTEAM
External Data
Credit Records
Social Networks
Others
Data Marts,
ETL
Mapping,
Connectors
Analytics - Structural View
Core Analytical Modeling Team
Generic Analytical Models
Segmentation
Regression
Predictive Analytics
Core Insurance Analytical Models
Capital Adequacy Models
Pricing & Rating Models
Reserving Models
Risk Transfer Mechanisms
Modeling Foundation Data Governance
Specialized Data Marts Insurance Models & Standards Data Mining Tools
Modeling Repositories & Practices
Fraud Models
OUTCOME](https://image.slidesharecdn.com/20150108analyticsvcafullssnetupl-160517030330/85/Analytics-Service-Framework-19-320.jpg)

1) There is a growing gap in capabilities and performance between companies that invest heavily in data and analytics compared to those that invest less. The capability gap is exacerbated by a shortage of analytical talent. 2) The amount of data being created is growing exponentially, estimated at 2.5 quintillion bytes per day globally. However, most organizations are not effectively using the data they already have. 3) Investing in analytics can provide significant financial benefits across industries. For example, leveraging big data in healthcare could capture $300 billion annually and increase retailers' operating margins by 60%.


![[DSC Europe 25] Milos Belcevic - Product Professional's Journey to Full-Stack...](https://cdn.slidesharecdn.com/ss_thumbnails/1zovd6fgsycdg4wvgvls-milos-belcevic-product-professionals-journey-to-full-stack-product-developer-260123083019-d993120d-thumbnail.jpg?width=640&height=640&fit=bounds)


![[DSC Europe 25] Predrag Maletic - Scaling AI in Banking – Our Strategic Journ...](https://cdn.slidesharecdn.com/ss_thumbnails/qu2onv0aruwlvqtygmxx-predrag-maletic-scaling-ai-in-banking-260123083019-6cf1da1d-thumbnail.jpg?width=640&height=640&fit=bounds)
