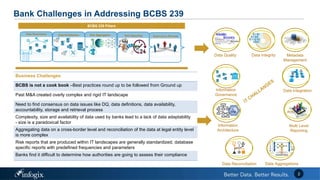
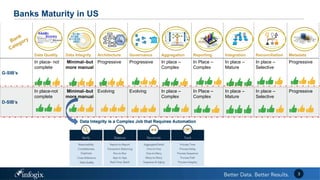
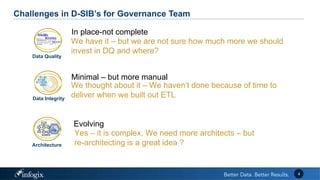
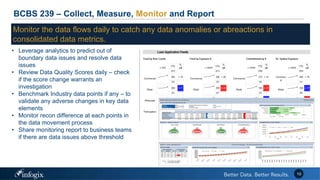
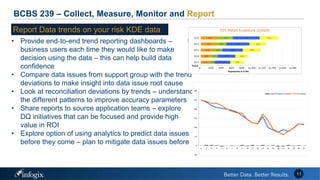
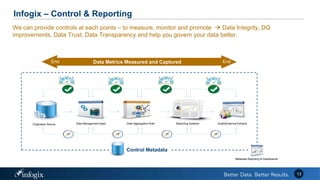
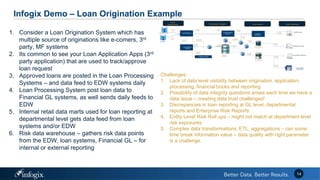
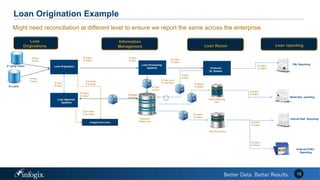
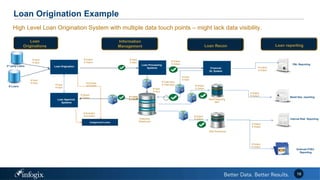
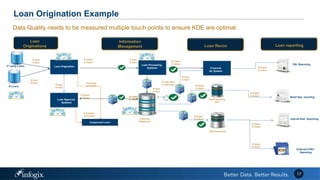
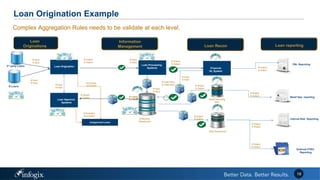
BCBS 239 – Challenges & Approach
Supervisory ReviewsRisk ReportingRisk Aggregation
Bank Challenges in Addressing BCBS 239
2
BCBS 239 Pillars
Data ArchitectureData Governance
Business Challenges
BCBS is not a cook book –Best practices round up to be followed from Ground up
Past M&A created overly complex and rigid IT landscape
Need to find consensus on data issues like DQ, data definitions, data availability,
accountability, storage and retrieval process
Complexity, size and availability of data used by banks lead to a lack of data adaptability
- size is a paradoxical factor
Aggregating data on a cross-border level and reconciliation of the data at legal entity level
is more complex
Risk reports that are produced within IT landscapes are generally standardized, database
specific reports with predefined frequencies and parameters
Banks find it difficult to determine how authorities are going to assess their compliance
Data IntegrityData Quality Metadata
Management
Data Integration
Data Reconciliation Data Aggregations
Multi Level
Reporting
Information
Architecture
Information
Governance
Data Quality Data Integrity Architecture Governance Aggregation Reporting Integration Reconciliation Metadata
G-SIB’s
In place- not
complete
Minimal–but
more manual
Progressive Progressive In place –
Complex
In Place –
Complex
In place –
Mature
In place –
Selective
Progressive
D-SIB’s
In place-not
complete
Minimal–but
more manual
Evolving Evolving In place –
Complex
In Place –
Complex
In place –
Mature
In place –
Selective
Progressive
Banks Maturity in US
3
Challenges in D-SIB’s for Governance Team
4
We have it – but we are not sure how much more we should
invest in DQ and where?
We thought about it – We haven’t done because of time to
deliver when we built out ETL
Yes – it is complex, We need more architects – but
re-architecting is a great idea ?
Data Quality
Data Integrity
Architecture
In place-not complete
Minimal – but more manual
Evolving
Challenges in D-SIB’s for Governance Team
5
We have our policy in place – We need to be more operational.
Need more metrics/ inventory – I would like to know what went in
daily and who is using what?
Its complex, done at multiple source levels – We have
documented it – but not sure how it works end-to-end?
Sure we have more reports than our Eemployees count! – but
it’s a challenge to make my business trust my reporting data
and do fact based decisions
Governance
Aggregation
Reporting
Evolving
In Place – Complex
In Place – Complex
Challenges in D-SIB’s for Governance Team
6
We have a great ETL Team and tools – we also have too many
jobs to manage and monitor, our support is complex
Sure we do it for our financial books – but not across all the
process gates for the risk data and reporting?
Metadata tool is in place – We have business glossary, but it’s a
challenge to keep up with the changes and metadata in sync
Integration
Reconciliation
Metadata
In Place - Mature
In Place – Selective
Progressive
BCBS 239 – Next Steps?
BCBS 239 – Collect, Measure, Monitor and Report
Collect – Build Inventory of key risk data used in data aggregation and reporting
• Risk data elements, risk parameters, counterparty information, risk model parameters – needs
to be identified both in standardized form and how they are represented in the origination
system
• Group data elements to KDE, DDE, SDE and MDE’s to assignee right DQ gradient to
measure the data points usefulness
• Validate what governance policy and process influence the KDE & DDE data points and
capture/report audit points to manage the policy adherence
• Report data inventories corresponding to KDE/DDE/SDE origination source to ensure
frequency and timeliness parameters are met
• Connect – Key data attributes with metadata and DQ initiatives to bring in transparency
• Build application level data inventory and connect application level inventory to produce
enterprise level data inventories
• Refresh your data inventory through automation – to keep information metadata more current
• Assignee owners/custodians of the data, provide them with the visibility reports on data
metrics
• If possible, attach data metrics around each fields with your metadata tools – to bring in data
related trust on the attributes
8
BCBS 239 – Collect, Measure, Monitor and Report
Origination Source Data Management Apps Data Aggregation Rule Reporting Systems Audits/External Extracts
Control Metadata
Data Metrics Measured and Captured EndEnd
Metadata
Reporting &
Dashboards
• Capture metrics such as Counts, Volumes,
Date Ranges for a given data set – and
compare it with your organization
benchmarks/SLA etc. – this can be your
early warning system!
• Look at source data patterns, trends –
before and after aggregation rules –
Compare them with benchmark expected
results – to ensure your aggregation is
working as expected
• Reconcile your data sets with the golden
source of the data – build as many
reconciliation steps as possible in your flow
– this can help improve data trust with
business teams
• Identify specific data Quality parameters for each critical data
elements and always look for deviations from normal
• Build a consolidate Application Level Data trust score, make
Application owners responsible for managing the scores.
9
Measure your data that is flowing in from different applications and used by
reporting teams – If you can not quantify, you can not govern well
BCBS 239 – Collect, Measure, Monitor and Report
• Leverage analytics to predict out of
boundary data issues and resolve data
issues
• Review Data Quality Scores daily – check
if the score change warrants an
investigation
• Benchmark Industry data points if any – to
validate any adverse changes in key data
elements
• Monitor recon difference at each points in
the data movement process
• Share monitoring report to business teams
if there are data issues above threshold
10
Monitor the data flows daily to catch any data anomalies or abreactions in
consolidated data metrics.
BCBS 239 – Collect, Measure, Monitor and Report
• Provide end-to-end trend reporting dashboards – to
business users each time they would like to make
decision using the data – this can help build data
confidence
• Compare data issues from support group with the trend
deviations to make insight into data issue root cause
• Look at reconciliation deviations by trends – understand
the different patterns to improve accuracy parameters
• Share reports to source application teams – explore
DQ initiatives that can be focused and provide high
value in ROI
• Explore option of using analytics to predict data issues
before they come – plan to mitigate data issues before
$175
$200
$250
$300
$350
$100
$125
$170
$200
$275
$300
$350
$400
$450
$525
$275
$250
$350
$325
$375
$- $200 $400 $600 $800 $1,000 $1,200 $1,400 $1,600 $1,800
2011
2012
2013
2014
2015
Exposures in $ Mn
Years
Y0Y Retail Exposure Growth
-50
0
50
100
150
200
250
300
1 2 3 4 5 6 7 8 9 10 11 12 13 14 15 16 17 18 19 20 21
Daily Diff GL Balance Src Balance
11
Report Data trends on your risk KDE data
BCBS 239 – How can we help? – Tool Demo
Infogix – Control & Reporting
13
We can provide controls at each points – to measure, monitor and promote  Data Integrity, DQ
improvements, Data Trust, Data Transparency and help you govern your data better.
Origination Source Data Management Apps Data Aggregation Rule Reporting Systems Audits/External Extracts
Control Metadata
Data Metrics Measured and Captured EndEnd
Metadata Reporting & Dashboards
Infogix Demo – Loan Origination Example
1. Consider a Loan Origination System which has
multiple source of originations like e-comers, 3rd
party, MF systems
2. Its common to see your Loan Application Apps (3rd
party application) that are used to track/approve
loan request
3. Approved loans are posted in the Loan Processing
Systems – and data feed to EDW systems daily
4. Loan Processing System post loan data to
Financial GL systems, as well sends daily feeds to
EDW
5. Internal retail data marts used for loan reporting at
departmental level gets data feed from loan
systems and/or EDW
6. Risk data warehouse – gathers risk data points
from the EDW, loan systems, Financial GL – for
internal or external reporting
Challenges:
1. Lack of data level visibility between origination, application,
processing, financial books and reporting
2. Possibility of data integrity questions arises each time we have a
data issue – creating data trust challenges!
3. Discrepancies in loan reporting at GL level, departmental
reports and Enterprise Risk Reports
4. Entity Level Risk Roll ups – might not match at department level
risk exposures
5. Complex data transformations, ETL, aggregations – can some
time break information value – data quality with right parameter
is a challenge.
14
Loan Origination Example
15
Might need reconciliation at different level to ensure we report the same across the enterprise.
3rd party Loans
E-Loans
Loan Origination
Loan Approval
Systems
Unapproved Loans
Loan Processing
Systems Financial
GL System
P&L Reporting
Loan
Originations
Information
Management Loan reportingLoan Recon
Retail Reporting
Mart
Risk Warehouse
Enterprise
Warehouse
Internal Risk Reporting
Retail Dep. reporting
External FFIEC
Reporting
# Input
$ Input
# Input
$ Input # Exclude
$ Exclude
# Output
$ Output
# Loans
$ Loans
# Output
$ Output
# Output
$ Output
# Total Input
$ Total Input
# Input
$ Input
# Output
$ Output
# Excluded
$ Excluded
# Input
$ Input
# Input
$ Input
# Output
$ Output
# Output
$ Output
# Output
$ Output
# Output
$ Output
# Output
$ Output
# Input
$ Input
Loan Origination Example
16
3rd party Loans
E-Loans
Loan Origination
Loan Approval
Systems
Unapproved Loans
Loan Processing
Systems Financial
GL System
P&L Reporting
Loan
Originations
Information
Management Loan reporting
High Level Loan Origination System with multiple data touch points – might lack data visibility.
Loan Recon
Retail Reporting
Mart
Risk Warehouse
Enterprise
Warehouse
Internal Risk Reporting
Retail Dep. reporting
External FFIEC
Reporting
# Input
$ Input
# Input
$ Input # Exclude
$ Exclude
# Output
$ Output
# Loans
$ Loans
# Output
$ Output
# Output
$ Output
# Total Input
$ Total Input
# Input
$ Input
# Output
$ Output
# Excluded
$ Excluded
# Input
$ Input
# Input
$ Input
# Output
$ Output
# Output
$ Output
# Output
$ Output
# Output
$ Output
# Output
$ Output
# Input
$ Input
Loan Origination Example
17
Data Quality needs to be measured multiple touch points to ensure KDE are optimal.
3rd party Loans
E-Loans
Loan Origination
Loan Approval
Systems
Unapproved Loans
Loan Processing
Systems Financial
GL System
P&L Reporting
Loan
Originations
Information
Management Loan reportingLoan Recon
Retail Reporting
Mart
Risk Warehouse
Enterprise
Warehouse
Internal Risk Reporting
Retail Dep. reporting
External FFIEC
Reporting
# Input
$ Input
# Input
$ Input # Exclude
$ Exclude
# Output
$ Output
# Loans
$ Loans
# Output
$ Output
# Output
$ Output
# Total Input
$ Total Input
# Input
$ Input
# Output
$ Output
# Excluded
$ Excluded
# Input
$ Input
# Input
$ Input
# Output
$ Output
# Output
$ Output
# Output
$ Output
# Output
$ Output
# Output
$ Output
# Input
$ Input
Loan Origination Example
18
Complex Aggregation Rules needs to be validate at each level.
3rd party Loans
E-Loans
Loan Origination
Loan Approval
Systems
Unapproved Loans
Loan Processing
Systems Financial
GL System
P&L Reporting
Loan
Originations
Information
Management Loan reportingLoan Recon
Retail Reporting
Mart
Risk Warehouse
Enterprise
Warehouse
Internal Risk Reporting
Retail Dep. reporting
External FFIEC
Reporting
# Input
$ Input
# Input
$ Input # Exclude
$ Exclude
# Output
$ Output
# Loans
$ Loans
# Output
$ Output
# Output
$ Output
# Total Input
$ Total Input
# Input
$ Input
# Output
$ Output
# Excluded
$ Excluded
# Input
$ Input
# Input
$ Input
# Output
$ Output
# Output
$ Output
# Output
$ Output
# Output
$ Output
# Output
$ Output
# Input
$ Input
Loan Origination Example
19
Infogix Controls – For Measuring, Monitoring and Quantify Data across the touch points.
3rd party Loans
E-Loans
Loan Origination
Loan Approval
Systems
Unapproved Loans
Loan Processing
Systems Financial
GL System
P&L Reporting
Loan
Originations
Information
Management Loan reportingLoan Recon
Retail Reporting
Mart
Risk Warehouse
Enterprise
Warehouse
Internal Risk Reporting
Retail Dep. reporting
External FFIEC
Reporting
# Input
$ Input
# Input
$ Input # Exclude
$ Exclude
# Output
$ Output
# Loans
$ Loans
# Output
$ Output
# Output
$ Output
# Total Input
$ Total Input
# Input
$ Input
# Output
$ Output
# Excluded
$ Excluded
# Input
$ Input
# Input
$ Input
# Output
$ Output
# Output
$ Output
# Output
$ Output
# Output
$ Output
# Output
$ Output
# Input
$ Input
Control Metadata
Metric Reporting
Mail Alerts/Warnings
BCBS 239 – Infogix Control Dashboards
Infogix – Control & Reporting
 Provide KPI Reporting by data groups
across DQ gradients
 Ability to compare key elements
across gradients
 Identifying trends and data occurrence
by each elements
21
200+Customers
INCLUDING:
20
of the
Fortune
100
7
of the top 10
Commercial
Banks
6
of the top 10
P & C
Insurers
of the top 5
Health
Insurers
4
Million
wireless cable
& broadband
subscribers covered
400
30+years as a leader in
analyzing data across
the enterprise.
500+Employees (and growing)
revenue represented
by our customers.
›$1 Trillion
›96%ANNUAL
CUSTOMER
SATISFACTION
RATING
1Million+ total Infogix business rules
running for our customers.
72%
Managing Risk is #1
of customers report it as the
key benefit of utilizing Infogix.
›15
YEARS
average number of
years that customers have
partnered with Infogix.
22
Thank You
Visit www.infogix.com for more information
Or contact kparal@infogix.com for more
information
23
Infogix Balancing and Reconciliation

Infogix BCBS 239 Implementation Challenges

  • 1.
    BCBS 239 –Challenges & Approach
  • 2.
    Supervisory ReviewsRisk ReportingRiskAggregation Bank Challenges in Addressing BCBS 239 2 BCBS 239 Pillars Data ArchitectureData Governance Business Challenges BCBS is not a cook book –Best practices round up to be followed from Ground up Past M&A created overly complex and rigid IT landscape Need to find consensus on data issues like DQ, data definitions, data availability, accountability, storage and retrieval process Complexity, size and availability of data used by banks lead to a lack of data adaptability - size is a paradoxical factor Aggregating data on a cross-border level and reconciliation of the data at legal entity level is more complex Risk reports that are produced within IT landscapes are generally standardized, database specific reports with predefined frequencies and parameters Banks find it difficult to determine how authorities are going to assess their compliance Data IntegrityData Quality Metadata Management Data Integration Data Reconciliation Data Aggregations Multi Level Reporting Information Architecture Information Governance
  • 3.
    Data Quality DataIntegrity Architecture Governance Aggregation Reporting Integration Reconciliation Metadata G-SIB’s In place- not complete Minimal–but more manual Progressive Progressive In place – Complex In Place – Complex In place – Mature In place – Selective Progressive D-SIB’s In place-not complete Minimal–but more manual Evolving Evolving In place – Complex In Place – Complex In place – Mature In place – Selective Progressive Banks Maturity in US 3
  • 4.
    Challenges in D-SIB’sfor Governance Team 4 We have it – but we are not sure how much more we should invest in DQ and where? We thought about it – We haven’t done because of time to deliver when we built out ETL Yes – it is complex, We need more architects – but re-architecting is a great idea ? Data Quality Data Integrity Architecture In place-not complete Minimal – but more manual Evolving
  • 5.
    Challenges in D-SIB’sfor Governance Team 5 We have our policy in place – We need to be more operational. Need more metrics/ inventory – I would like to know what went in daily and who is using what? Its complex, done at multiple source levels – We have documented it – but not sure how it works end-to-end? Sure we have more reports than our Eemployees count! – but it’s a challenge to make my business trust my reporting data and do fact based decisions Governance Aggregation Reporting Evolving In Place – Complex In Place – Complex
  • 6.
    Challenges in D-SIB’sfor Governance Team 6 We have a great ETL Team and tools – we also have too many jobs to manage and monitor, our support is complex Sure we do it for our financial books – but not across all the process gates for the risk data and reporting? Metadata tool is in place – We have business glossary, but it’s a challenge to keep up with the changes and metadata in sync Integration Reconciliation Metadata In Place - Mature In Place – Selective Progressive
  • 7.
    BCBS 239 –Next Steps?
  • 8.
    BCBS 239 –Collect, Measure, Monitor and Report Collect – Build Inventory of key risk data used in data aggregation and reporting • Risk data elements, risk parameters, counterparty information, risk model parameters – needs to be identified both in standardized form and how they are represented in the origination system • Group data elements to KDE, DDE, SDE and MDE’s to assignee right DQ gradient to measure the data points usefulness • Validate what governance policy and process influence the KDE & DDE data points and capture/report audit points to manage the policy adherence • Report data inventories corresponding to KDE/DDE/SDE origination source to ensure frequency and timeliness parameters are met • Connect – Key data attributes with metadata and DQ initiatives to bring in transparency • Build application level data inventory and connect application level inventory to produce enterprise level data inventories • Refresh your data inventory through automation – to keep information metadata more current • Assignee owners/custodians of the data, provide them with the visibility reports on data metrics • If possible, attach data metrics around each fields with your metadata tools – to bring in data related trust on the attributes 8
  • 9.
    BCBS 239 –Collect, Measure, Monitor and Report Origination Source Data Management Apps Data Aggregation Rule Reporting Systems Audits/External Extracts Control Metadata Data Metrics Measured and Captured EndEnd Metadata Reporting & Dashboards • Capture metrics such as Counts, Volumes, Date Ranges for a given data set – and compare it with your organization benchmarks/SLA etc. – this can be your early warning system! • Look at source data patterns, trends – before and after aggregation rules – Compare them with benchmark expected results – to ensure your aggregation is working as expected • Reconcile your data sets with the golden source of the data – build as many reconciliation steps as possible in your flow – this can help improve data trust with business teams • Identify specific data Quality parameters for each critical data elements and always look for deviations from normal • Build a consolidate Application Level Data trust score, make Application owners responsible for managing the scores. 9 Measure your data that is flowing in from different applications and used by reporting teams – If you can not quantify, you can not govern well
  • 10.
    BCBS 239 –Collect, Measure, Monitor and Report • Leverage analytics to predict out of boundary data issues and resolve data issues • Review Data Quality Scores daily – check if the score change warrants an investigation • Benchmark Industry data points if any – to validate any adverse changes in key data elements • Monitor recon difference at each points in the data movement process • Share monitoring report to business teams if there are data issues above threshold 10 Monitor the data flows daily to catch any data anomalies or abreactions in consolidated data metrics.
  • 11.
    BCBS 239 –Collect, Measure, Monitor and Report • Provide end-to-end trend reporting dashboards – to business users each time they would like to make decision using the data – this can help build data confidence • Compare data issues from support group with the trend deviations to make insight into data issue root cause • Look at reconciliation deviations by trends – understand the different patterns to improve accuracy parameters • Share reports to source application teams – explore DQ initiatives that can be focused and provide high value in ROI • Explore option of using analytics to predict data issues before they come – plan to mitigate data issues before $175 $200 $250 $300 $350 $100 $125 $170 $200 $275 $300 $350 $400 $450 $525 $275 $250 $350 $325 $375 $- $200 $400 $600 $800 $1,000 $1,200 $1,400 $1,600 $1,800 2011 2012 2013 2014 2015 Exposures in $ Mn Years Y0Y Retail Exposure Growth -50 0 50 100 150 200 250 300 1 2 3 4 5 6 7 8 9 10 11 12 13 14 15 16 17 18 19 20 21 Daily Diff GL Balance Src Balance 11 Report Data trends on your risk KDE data
  • 12.
    BCBS 239 –How can we help? – Tool Demo
  • 13.
    Infogix – Control& Reporting 13 We can provide controls at each points – to measure, monitor and promote  Data Integrity, DQ improvements, Data Trust, Data Transparency and help you govern your data better. Origination Source Data Management Apps Data Aggregation Rule Reporting Systems Audits/External Extracts Control Metadata Data Metrics Measured and Captured EndEnd Metadata Reporting & Dashboards
  • 14.
    Infogix Demo –Loan Origination Example 1. Consider a Loan Origination System which has multiple source of originations like e-comers, 3rd party, MF systems 2. Its common to see your Loan Application Apps (3rd party application) that are used to track/approve loan request 3. Approved loans are posted in the Loan Processing Systems – and data feed to EDW systems daily 4. Loan Processing System post loan data to Financial GL systems, as well sends daily feeds to EDW 5. Internal retail data marts used for loan reporting at departmental level gets data feed from loan systems and/or EDW 6. Risk data warehouse – gathers risk data points from the EDW, loan systems, Financial GL – for internal or external reporting Challenges: 1. Lack of data level visibility between origination, application, processing, financial books and reporting 2. Possibility of data integrity questions arises each time we have a data issue – creating data trust challenges! 3. Discrepancies in loan reporting at GL level, departmental reports and Enterprise Risk Reports 4. Entity Level Risk Roll ups – might not match at department level risk exposures 5. Complex data transformations, ETL, aggregations – can some time break information value – data quality with right parameter is a challenge. 14
  • 15.
    Loan Origination Example 15 Mightneed reconciliation at different level to ensure we report the same across the enterprise. 3rd party Loans E-Loans Loan Origination Loan Approval Systems Unapproved Loans Loan Processing Systems Financial GL System P&L Reporting Loan Originations Information Management Loan reportingLoan Recon Retail Reporting Mart Risk Warehouse Enterprise Warehouse Internal Risk Reporting Retail Dep. reporting External FFIEC Reporting # Input $ Input # Input $ Input # Exclude $ Exclude # Output $ Output # Loans $ Loans # Output $ Output # Output $ Output # Total Input $ Total Input # Input $ Input # Output $ Output # Excluded $ Excluded # Input $ Input # Input $ Input # Output $ Output # Output $ Output # Output $ Output # Output $ Output # Output $ Output # Input $ Input
  • 16.
    Loan Origination Example 16 3rdparty Loans E-Loans Loan Origination Loan Approval Systems Unapproved Loans Loan Processing Systems Financial GL System P&L Reporting Loan Originations Information Management Loan reporting High Level Loan Origination System with multiple data touch points – might lack data visibility. Loan Recon Retail Reporting Mart Risk Warehouse Enterprise Warehouse Internal Risk Reporting Retail Dep. reporting External FFIEC Reporting # Input $ Input # Input $ Input # Exclude $ Exclude # Output $ Output # Loans $ Loans # Output $ Output # Output $ Output # Total Input $ Total Input # Input $ Input # Output $ Output # Excluded $ Excluded # Input $ Input # Input $ Input # Output $ Output # Output $ Output # Output $ Output # Output $ Output # Output $ Output # Input $ Input
  • 17.
    Loan Origination Example 17 DataQuality needs to be measured multiple touch points to ensure KDE are optimal. 3rd party Loans E-Loans Loan Origination Loan Approval Systems Unapproved Loans Loan Processing Systems Financial GL System P&L Reporting Loan Originations Information Management Loan reportingLoan Recon Retail Reporting Mart Risk Warehouse Enterprise Warehouse Internal Risk Reporting Retail Dep. reporting External FFIEC Reporting # Input $ Input # Input $ Input # Exclude $ Exclude # Output $ Output # Loans $ Loans # Output $ Output # Output $ Output # Total Input $ Total Input # Input $ Input # Output $ Output # Excluded $ Excluded # Input $ Input # Input $ Input # Output $ Output # Output $ Output # Output $ Output # Output $ Output # Output $ Output # Input $ Input
  • 18.
    Loan Origination Example 18 ComplexAggregation Rules needs to be validate at each level. 3rd party Loans E-Loans Loan Origination Loan Approval Systems Unapproved Loans Loan Processing Systems Financial GL System P&L Reporting Loan Originations Information Management Loan reportingLoan Recon Retail Reporting Mart Risk Warehouse Enterprise Warehouse Internal Risk Reporting Retail Dep. reporting External FFIEC Reporting # Input $ Input # Input $ Input # Exclude $ Exclude # Output $ Output # Loans $ Loans # Output $ Output # Output $ Output # Total Input $ Total Input # Input $ Input # Output $ Output # Excluded $ Excluded # Input $ Input # Input $ Input # Output $ Output # Output $ Output # Output $ Output # Output $ Output # Output $ Output # Input $ Input
  • 19.
    Loan Origination Example 19 InfogixControls – For Measuring, Monitoring and Quantify Data across the touch points. 3rd party Loans E-Loans Loan Origination Loan Approval Systems Unapproved Loans Loan Processing Systems Financial GL System P&L Reporting Loan Originations Information Management Loan reportingLoan Recon Retail Reporting Mart Risk Warehouse Enterprise Warehouse Internal Risk Reporting Retail Dep. reporting External FFIEC Reporting # Input $ Input # Input $ Input # Exclude $ Exclude # Output $ Output # Loans $ Loans # Output $ Output # Output $ Output # Total Input $ Total Input # Input $ Input # Output $ Output # Excluded $ Excluded # Input $ Input # Input $ Input # Output $ Output # Output $ Output # Output $ Output # Output $ Output # Output $ Output # Input $ Input Control Metadata Metric Reporting Mail Alerts/Warnings
  • 20.
    BCBS 239 –Infogix Control Dashboards
  • 21.
    Infogix – Control& Reporting  Provide KPI Reporting by data groups across DQ gradients  Ability to compare key elements across gradients  Identifying trends and data occurrence by each elements 21
  • 22.
    200+Customers INCLUDING: 20 of the Fortune 100 7 of thetop 10 Commercial Banks 6 of the top 10 P & C Insurers of the top 5 Health Insurers 4 Million wireless cable & broadband subscribers covered 400 30+years as a leader in analyzing data across the enterprise. 500+Employees (and growing) revenue represented by our customers. ›$1 Trillion ›96%ANNUAL CUSTOMER SATISFACTION RATING 1Million+ total Infogix business rules running for our customers. 72% Managing Risk is #1 of customers report it as the key benefit of utilizing Infogix. ›15 YEARS average number of years that customers have partnered with Infogix. 22
  • 23.
    Thank You Visit www.infogix.comfor more information Or contact kparal@infogix.com for more information 23 Infogix Balancing and Reconciliation

Editor's Notes

  • #3 Reliance of Purpose built data infrastructure and Reporting Banks rate their own compliance with risk reporting principles higher than their compliance with Governance, infrastructure and data aggregation principles. Banks tent to appear compliant at group level or at the specific legal entity level – but lack same capability at different aggregation levels – hence do not meet adaptability requirements 2. IT Team in bank has many large scale – Ongoing Projects spanning multiple years – leading to resource availability issues and complex project dependencies – While data landscape keep evolving due to data explosion in the Financial sectors.
  • #23 Mandatory Slide Slide Purpose: Credibility Example Talking Points: To wrap it up, here’s a nice Infographic on Infogix. The #1 reasons customers use Infogix is to Manage Risk – The Infogix Enterprise Data Analysis Platform turns data into a competitive advantage. Over 32 years in Data Analysis business We have 500 employees supporting over 200+ customers. Interesting statistic: Over $1T in revenue is represented by the customer portfolio that we serve (200+ big name customers) Over 1M controls/business rules are running in our customers to ensure data integrity with the outcome of trustworthy data Or…We have over 1M controls/business rules at over 200 customers – Unknown to you, when you shop (retail, banking, insurance, healthcare), or bank your transaction probably went Infogix data analysis. We truly believe in partnering with our customer and we are proud to say that our average customer has been with us for well over 15+ year. We hope to have the same opportunity with you.