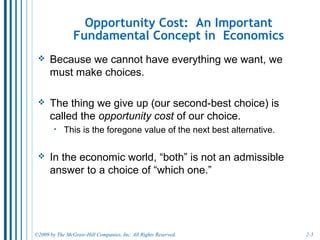
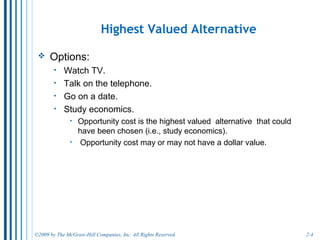
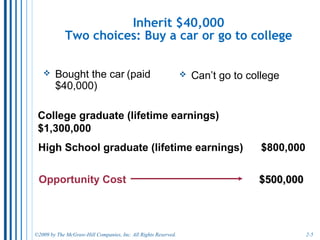
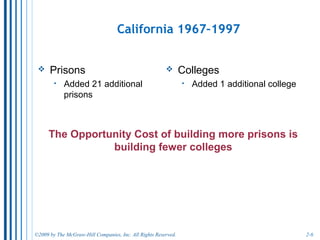
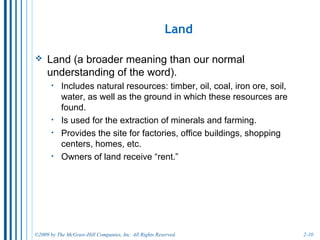
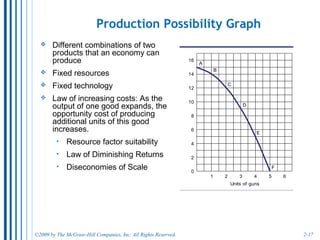
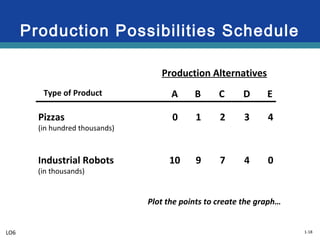
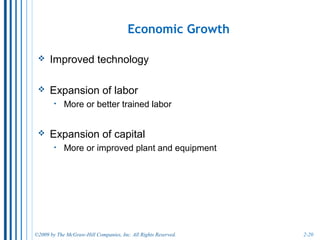
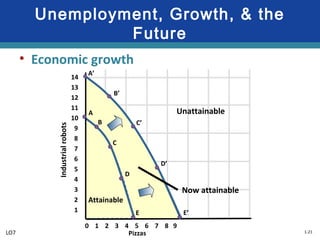
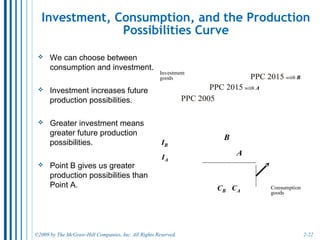
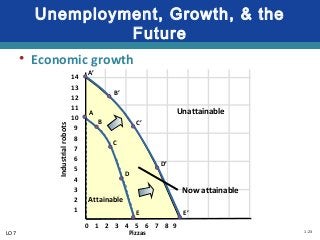
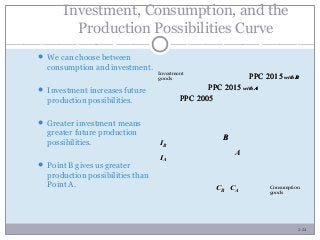
Chapter 2
Resource Utilization
(Limits, Alternatives, and Choices)
2-2
The Central Fact of Economics: SCARCITY
• This definition assumes that scarcity is the
fundamental economic problem:
o There are never enough resources to produce all of the goods
and services that people want.
• Why is there an economic problem?
o The means of production (resources) are limited.
o Economists assume that human wants are unlimited.
• An economy is a system for organizing the
allocation of resources to produce and distribute the
goods and services that satisfy human wants.
o The more efficient the economy is, the more wants we can
satisfy.
2-3
Opportunity Cost: A Fundamental Concept in
Economics
• Opportunity cost is the foregone value of the next
best alternative.
o The value of things we give up (our second-best choice).
• People weigh the costs and benefits of various
options, including opportunity costs.
o Economists assume that we choose the option we find more
valuable.
• In the economic world, “both” is not an admissible
answer to a choice of “which one.”
2-4
Choosing the Highest Valued Alternative
• Because time is linear, we must make choices. Here are your
options:
o spend time on social networking site.
o play video games.
o go to movies with friends.
o study economics.
• Whichever option is chosen, you will miss the value of the other
options.
o If you go to the movie with friends, the direct cost is the movie ticket and
any transportation costs.
o The opportunity cost is the value of the alternatives use of your time (for
example, the benefit of the improvement in your grade from studying).
o Opportunity cost may or may not have a dollar value. But you implicitly
place a value when you make a decision.
2-5
Inherit $40,000
Two choices: Buy a car or go to college
Bought the car (paid
$40,000)
Can’t go to college
College graduate (lifetime earnings) $1,300,000College graduate (lifetime earnings) $1,300,000
High School graduate (lifetime earnings) $800,000High School graduate (lifetime earnings) $800,000
Opportunity Cost $500,000$500,000
2-6
California 1967–1997
Prisons
 Added 21 additional
prisons
Colleges
 Added 1 additional college
The Opportunity Cost of building more prisons is
building fewer colleges
1-7
The Consumer’s Budget Line
12
10
8
6
4
2
0
2 4 6 8 10 12 14
Income = $120
Pdvd = $20
= 6
Income = $120
Pb = $10
= 12
Attainable
Unattainable
LO4
The Budget Line: Combinations of DVDs
and Books Attainable with $120
Units of
DVDs
(Price = $20)
Units of
Books
(Price=$10)
Total
Expenditure
6 0 $120
5 2 $120
4 4 $120
3 6 $120
2 8 $120
1 10 $120
0 12 $120
2-8
Four Economic Resources
• There are four categories of economic resources:
o Land - natural resources
o Labor - work
o Capital - produced goods used to produce other goods and
services
o Entrepreneurial ability - effort to organize the production
process
• In a market economy, each of these resources is
exchanged in markets for a type of income.
o We sell our resources to earn income to purchase goods and
services to satisfy our wants.
2-9
Land Earns Rents
• Land (a broader meaning than our normal
understanding of the word).
o Land includes natural resources like timber, oil, coal, iron ore,
soil, water, as well as the ground in which these resources are
found.
• How is land used in an economy?
o Extraction of minerals (mining) and farming (agriculture)
o It provides the site for factories, office buildings, shopping centers,
homes, etc.
• Owners of land receive rent.
o Economic rent is money received from something that is given
by nature, rather than produced by human effort.
o Rent is earned by establishing ownership over resources.
2-10
Labor Earns Wages.
• Labor:
o is work and time for which one is paid.
o involves human effort.
• Income received for one’s labor is called wages
and/or salaries
o About two-thirds of the total resource cost is the cost of
labor.
o Unpaid labor (housework, volunteer work) can also
contribute to the satisfaction of human wants.
2-11
Capital Earns Interest.
• Capital:
o “human-made” goods used to produce other goods or services.
o includes office buildings, stores, and factories (physical plant),
equipment, and software.
o This is a different use of the term capital than when it means the
money a business uses to buy plant and equipment.
• The income owners of capital receive what is called
interest.
o The purchase of new capital equipment is often funded through
loans, so the lender earns interest from its productivity.
2-12
Entrepreneur Ability Earns Profits.
• The entrepreneur:
o sets up a business.
o assembles the needed resources.
o risks his/her own (or borrowed) money.
o is central to the American economy.
• An entrepreneur earns a profit (or a loss) depending
upon his or her ability to run a business.
• There are over 30 million businesses in the U.S., most
are owned by entrepreneurs.
o The vast majority work for themselves or have one or two
employees.
2-13
Productive Efficiency
Is attained when the maximum possible output
of one good is produced, given the output of
other goods.
 Productive efficiency occurs only when we are operating
on the production possibilities curve.
 Productivity efficiency means that the output of one
good cannot be attained with out reducing the output of
some other good.
2-14
Full Employment and Full Production
Full employment = 5% unemployment rate
From 1971–1996 the unemployment rate was
above 5% (in recent years, this has lingered
below 5%).
Full production— 85–90% plant utilization
rate.
2-15
Underemployment of Resources
An unemployment rate greater than 5%
A capacity utilization rate less than 85%
Discrimination
 A phenomenon that has diminished but has not been
eliminated entirely.
 Probably keeps our output 10–15% below what it could
be.
 If there were truly an efficient allocation of resources.
2-16
The Production Possibilities Curve
• Points A, B, C, D, E, and F are
efficient with full employment
and full production.
• Points X, Y, and Z are points
where economy is producing
below efficiency since either
capital is being under utilized or
the workforce is underemployed.
You can produce more guns
without sacrificing butter, or
vice versa.
• Any point above the production
possibility curve, such as W, is
not achievable.
Production Possibilities Curve
Hypothetical Production
Schedule
Point Units of
Butter
Units of
Guns
A 15 0
B 14 1
C 12 2
D 9 3
E 5 4
F 0 5
This Production Possibilities Curve
shows the range of possible
combinations of guns and butter
extending from 15 units of butter
and no guns at point A to 5 units of
guns and no butter at point F
2-17
Production Possibilities Curve
Hypothetical Production
Schedule
Point Units of
Butter
Units of
Guns
A 15 0
B 14 1
C 12 2
D 9 3
E 5 4
F 0 5
• When you are on the curve,
to get more of one thing you
have to give up some of the
other thing.
• The opportunity cost of
gaining 1 unit of guns was 1
unit of butter
To gain 1 unit of
Guns
Had to give up 1
unit of butter
2-18
2-19
Production Possibility Graph
 Different combinations of two
products that an economy can
produce
 Fixed resources
 Fixed technology
 Law of increasing costs: As the
output of one good expands, the
opportunity cost of producing
additional units of this good
increases.
 Resource factor suitability
 Law of Diminishing Returns
 Diseconomies of Scale
1-20
Production Possibilities Schedule
Type of Product
Pizzas
(in hundred thousands)
Industrial Robots
(in thousands)
Production Alternatives
A B C D E
10 9 7 4 0
0 1 2 3 4
Plot the points to create the graph…
LO6
1-21
Production Possibilities Graph
0 1 2 3 4 5 6 7 8 9
Unattainable
14
13
12
11
10
9
8
7
6
5
4
3
2
1
A
B
C
D
E
Attainable
W
Q
Q
LO6
Pizzas
Industrialrobots
2-22
Economic Growth
Improved technology
Expansion of labor
 More or better trained labor
Expansion of capital
 More or improved plant and equipment
1-23
Unemployment, Growth, & the
Future
• Economic growth
Pizzas
Industrialrobots
Attainable
0 1 2 3 4 5 6 7 8 9
14
13
12
11
10
9
8
7
6
5
4
3
2
1
UnattainableA
B
C
D
E
Now attainable
A’
B’
C’
D’
E’
LO7
2-24
Investment, Consumption, and the
Production Possibilities Curve
 We can choose between
consumption and investment.
 Investment increases future
production possibilities.
 Greater investment means
greater future production
possibilities.
 Point B gives us greater
production possibilities than
Point A.
Investment
goods
Consumption
goods
IA
CA
A
PPC 2015 with BPPC 2015 with BPPC 2015 with B
PPC 2005PPC 2005PPC 2005
PPC 2015 with APPC 2015 with APPC 2015 with A
BB
IB
CB

Resource utilization.2015

  • 1.
    Chapter 2 Resource Utilization (Limits,Alternatives, and Choices)
  • 2.
    2-2 The Central Factof Economics: SCARCITY • This definition assumes that scarcity is the fundamental economic problem: o There are never enough resources to produce all of the goods and services that people want. • Why is there an economic problem? o The means of production (resources) are limited. o Economists assume that human wants are unlimited. • An economy is a system for organizing the allocation of resources to produce and distribute the goods and services that satisfy human wants. o The more efficient the economy is, the more wants we can satisfy.
  • 3.
    2-3 Opportunity Cost: AFundamental Concept in Economics • Opportunity cost is the foregone value of the next best alternative. o The value of things we give up (our second-best choice). • People weigh the costs and benefits of various options, including opportunity costs. o Economists assume that we choose the option we find more valuable. • In the economic world, “both” is not an admissible answer to a choice of “which one.”
  • 4.
    2-4 Choosing the HighestValued Alternative • Because time is linear, we must make choices. Here are your options: o spend time on social networking site. o play video games. o go to movies with friends. o study economics. • Whichever option is chosen, you will miss the value of the other options. o If you go to the movie with friends, the direct cost is the movie ticket and any transportation costs. o The opportunity cost is the value of the alternatives use of your time (for example, the benefit of the improvement in your grade from studying). o Opportunity cost may or may not have a dollar value. But you implicitly place a value when you make a decision.
  • 5.
    2-5 Inherit $40,000 Two choices:Buy a car or go to college Bought the car (paid $40,000) Can’t go to college College graduate (lifetime earnings) $1,300,000College graduate (lifetime earnings) $1,300,000 High School graduate (lifetime earnings) $800,000High School graduate (lifetime earnings) $800,000 Opportunity Cost $500,000$500,000
  • 6.
    2-6 California 1967–1997 Prisons  Added21 additional prisons Colleges  Added 1 additional college The Opportunity Cost of building more prisons is building fewer colleges
  • 7.
    1-7 The Consumer’s BudgetLine 12 10 8 6 4 2 0 2 4 6 8 10 12 14 Income = $120 Pdvd = $20 = 6 Income = $120 Pb = $10 = 12 Attainable Unattainable LO4 The Budget Line: Combinations of DVDs and Books Attainable with $120 Units of DVDs (Price = $20) Units of Books (Price=$10) Total Expenditure 6 0 $120 5 2 $120 4 4 $120 3 6 $120 2 8 $120 1 10 $120 0 12 $120
  • 8.
    2-8 Four Economic Resources •There are four categories of economic resources: o Land - natural resources o Labor - work o Capital - produced goods used to produce other goods and services o Entrepreneurial ability - effort to organize the production process • In a market economy, each of these resources is exchanged in markets for a type of income. o We sell our resources to earn income to purchase goods and services to satisfy our wants.
  • 9.
    2-9 Land Earns Rents •Land (a broader meaning than our normal understanding of the word). o Land includes natural resources like timber, oil, coal, iron ore, soil, water, as well as the ground in which these resources are found. • How is land used in an economy? o Extraction of minerals (mining) and farming (agriculture) o It provides the site for factories, office buildings, shopping centers, homes, etc. • Owners of land receive rent. o Economic rent is money received from something that is given by nature, rather than produced by human effort. o Rent is earned by establishing ownership over resources.
  • 10.
    2-10 Labor Earns Wages. •Labor: o is work and time for which one is paid. o involves human effort. • Income received for one’s labor is called wages and/or salaries o About two-thirds of the total resource cost is the cost of labor. o Unpaid labor (housework, volunteer work) can also contribute to the satisfaction of human wants.
  • 11.
    2-11 Capital Earns Interest. •Capital: o “human-made” goods used to produce other goods or services. o includes office buildings, stores, and factories (physical plant), equipment, and software. o This is a different use of the term capital than when it means the money a business uses to buy plant and equipment. • The income owners of capital receive what is called interest. o The purchase of new capital equipment is often funded through loans, so the lender earns interest from its productivity.
  • 12.
    2-12 Entrepreneur Ability EarnsProfits. • The entrepreneur: o sets up a business. o assembles the needed resources. o risks his/her own (or borrowed) money. o is central to the American economy. • An entrepreneur earns a profit (or a loss) depending upon his or her ability to run a business. • There are over 30 million businesses in the U.S., most are owned by entrepreneurs. o The vast majority work for themselves or have one or two employees.
  • 13.
    2-13 Productive Efficiency Is attainedwhen the maximum possible output of one good is produced, given the output of other goods.  Productive efficiency occurs only when we are operating on the production possibilities curve.  Productivity efficiency means that the output of one good cannot be attained with out reducing the output of some other good.
  • 14.
    2-14 Full Employment andFull Production Full employment = 5% unemployment rate From 1971–1996 the unemployment rate was above 5% (in recent years, this has lingered below 5%). Full production— 85–90% plant utilization rate.
  • 15.
    2-15 Underemployment of Resources Anunemployment rate greater than 5% A capacity utilization rate less than 85% Discrimination  A phenomenon that has diminished but has not been eliminated entirely.  Probably keeps our output 10–15% below what it could be.  If there were truly an efficient allocation of resources.
  • 16.
    2-16 The Production PossibilitiesCurve • Points A, B, C, D, E, and F are efficient with full employment and full production. • Points X, Y, and Z are points where economy is producing below efficiency since either capital is being under utilized or the workforce is underemployed. You can produce more guns without sacrificing butter, or vice versa. • Any point above the production possibility curve, such as W, is not achievable.
  • 17.
    Production Possibilities Curve HypotheticalProduction Schedule Point Units of Butter Units of Guns A 15 0 B 14 1 C 12 2 D 9 3 E 5 4 F 0 5 This Production Possibilities Curve shows the range of possible combinations of guns and butter extending from 15 units of butter and no guns at point A to 5 units of guns and no butter at point F 2-17
  • 18.
    Production Possibilities Curve HypotheticalProduction Schedule Point Units of Butter Units of Guns A 15 0 B 14 1 C 12 2 D 9 3 E 5 4 F 0 5 • When you are on the curve, to get more of one thing you have to give up some of the other thing. • The opportunity cost of gaining 1 unit of guns was 1 unit of butter To gain 1 unit of Guns Had to give up 1 unit of butter 2-18
  • 19.
    2-19 Production Possibility Graph Different combinations of two products that an economy can produce  Fixed resources  Fixed technology  Law of increasing costs: As the output of one good expands, the opportunity cost of producing additional units of this good increases.  Resource factor suitability  Law of Diminishing Returns  Diseconomies of Scale
  • 20.
    1-20 Production Possibilities Schedule Typeof Product Pizzas (in hundred thousands) Industrial Robots (in thousands) Production Alternatives A B C D E 10 9 7 4 0 0 1 2 3 4 Plot the points to create the graph… LO6
  • 21.
    1-21 Production Possibilities Graph 01 2 3 4 5 6 7 8 9 Unattainable 14 13 12 11 10 9 8 7 6 5 4 3 2 1 A B C D E Attainable W Q Q LO6 Pizzas Industrialrobots
  • 22.
    2-22 Economic Growth Improved technology Expansionof labor  More or better trained labor Expansion of capital  More or improved plant and equipment
  • 23.
    1-23 Unemployment, Growth, &the Future • Economic growth Pizzas Industrialrobots Attainable 0 1 2 3 4 5 6 7 8 9 14 13 12 11 10 9 8 7 6 5 4 3 2 1 UnattainableA B C D E Now attainable A’ B’ C’ D’ E’ LO7
  • 24.
    2-24 Investment, Consumption, andthe Production Possibilities Curve  We can choose between consumption and investment.  Investment increases future production possibilities.  Greater investment means greater future production possibilities.  Point B gives us greater production possibilities than Point A. Investment goods Consumption goods IA CA A PPC 2015 with BPPC 2015 with BPPC 2015 with B PPC 2005PPC 2005PPC 2005 PPC 2015 with APPC 2015 with APPC 2015 with A BB IB CB

Editor's Notes

  • #8 Any combination of goods inside the budget line can be purchased, but that combination of goods is not representative of the maximum that could be purchased. Since the blue budget line represents the maximum of goods that can be purchased, any point outside (to the right) of the budget line represents a combination whose price exceeds the available income and therefore can’t be purchased. A budget line clearly illustrates how much of one good must be sacrificed to get more of another good (opportunity costs). If income increases, the budget line will shift to the right to show that now more books and DVDs can be purchased. If income falls, the budget line shifts to the left to show that fewer books and DVDs can be purchased.
  • #17 2-21 We were at Point W right before and during WWII because we had to work double and triple time, move people into the work force temporarily. It is just unsustainable.
  • #21 The production possibilities table shows the combinations of pizzas and robots that can be produced with the resources available. At point A, the economy can produce 10,000 robots by using all of the resources to produce those robots. At point B, the economy is able to produce 100,000 pizzas, but they have to give up some robots to get these pizzas. This is because some resources are re-allocated to producing pizzas instead of robots. As the economy continues to move towards point E, the number of pizzas increases while the number of robots decreases, illustrating that the opportunity cost of more pizzas is fewer robots.
  • #22 Producing anywhere along the blue PPC line means that the economy is producing the maximum amount of pizzas and robots, and this implies that the economy is efficient. The economy can produce at any point inside the PPC, but doing so means that the economy is inefficient. This means that the economy has idle resources and/or resources are not being used to their capacity. When inside the PPC, it is possible to get more of both goods by utilizing idle resources, or using resources to their capacity. Just like with the budget line, any point to the right of the PPC represents a combination of robots and pizzas that is impossible to create with the current resources.
  • #24 Graphically, economic growth is shown as a shift to the right of the PPC. Shifting the PPC to the right shows that more robots and pizzas can now be produced at every point on the PPC. Points that used to be unattainable are now attainable. This means that the economy can now have a higher standard of living.