Research spotlight - Physiological impairment by climate change variables
•
3 likes•958 views

Lecture by Dr. Brad Seibel, University of Rhode Island given at the University of Puerto Rico Rio Piedras 2009.

Recommended
Recommended
More Related Content
What's hot
What's hot (20)
Similar to Research spotlight - Physiological impairment by climate change variables
Similar to Research spotlight - Physiological impairment by climate change variables (20)
More from Loretta Roberson
More from Loretta Roberson (20)
Recently uploaded
Recently uploaded (20)
Research spotlight - Physiological impairment by climate change variables
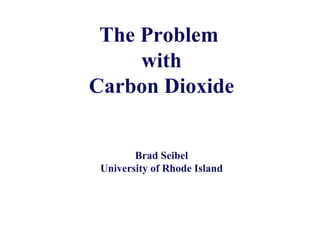
- 1. The Problem with Carbon Dioxide Brad Seibel University of Rhode Island
- 2. 1960s Keeling accurately measures CO 2 in Earth’s atmosphere and detects annual rise. The level is 315 ppm. Charles David Keeling 1928-2005 http://sio.ucsd.edu/keeling/ The “Keeling Curve”
- 3. Source: Jerry Meehl, National Center for Atmospheric Research
- 5. Oxygen minimum zones are expanding with climate change From: Spreading Dead Zones and Consequences for Marine Ecosystems Robert J. Diaz and Rutger Rosenberg Science 15 August 2008: 321 (5891), 926-929.
- 6. Brad Seibel University of Rhode Island Extreme Animals in Extreme Environments The Jumbo Squid in the Oxygen Minimum Zone
- 7. Ocean Acidification: The “Other CO 2 Problem”
- 8. Fins move more water slowly Jet propulsion moves less water at greater speeeds. Squids vs Fishes: Similar thrust, less efficient
- 9. Squids must consume twice as much oxygen to go half as fast as a similar sized fish -O’Dor and Webber, 1986
- 10. High metabolic rates in squids
- 11. Squids as extreme animal models: “ The edge of oxygen limitation” -High O 2 Demand -Low carrying capacity -No venous reserve
- 12. Squids may operate at environmental limits of temperature, oxygen availability and body size -Pörtner, 2002
- 13. “ They are giant raptorial predators with a taste for flesh” Dosidicus gigas
- 14. Blue-water SCUBA
- 16. Dosidicus gigas
- 17. Oxygen (µM) Most of the Eastern Pacific is hypoxic
- 18. Extreme Environment Eastern Tropical Pacific Oxygen Minimum Zone The Atlantic is better oxygenated…
- 19. Are squids in the oxygen minimum layer? (Other top predators avoid it) Hypoxia-based habitat compression of tropical pelagic fishes ERIC D. PRINCE and C. PHILLIP GOODYEAR Abstract Large areas of cold hypoxic water occur as distinct strata in the eastern tropical Pacific (ETP) and Atlantic oceans as a result of high productivity initiated by intense nutrient upwelling. We show that this stratum restricts the depth distribution of tropical pelagic marlins, sailfish, and tunas by compressing the acceptable physical habitat into a narrow surface layer. This layer extends downward to a variable boundary defined by a shallow thermocline, often at 25 m, above a barrier of cold hypoxic water.…
- 20. Lloyd Trueblood Dr. Rui Rosa Albert Nyack Leanne Birden
- 21. R/V New Horizon Sea of Cortez
- 22. Monterey Bay Aquarium Research Inst. Remotely Operated Vehicles
- 23. Depth (m) Daytime Depth Distribution of Dosidicus gigas Zeidberg et al., 2006
- 25. Doscidicus food!
- 26. Day and Night Depth Distribution of Dosidicus gigas Gilly et al., 2006, MEPS Number of Samples 500 400 300 200 100 0 Depth (m) 0 100 200 300 400 500
- 27. Diel Vertical Migration by an Individual Squid Gilly et al. 2006
- 28. Vertical Migration in an Oxygen Minimum Zone
- 29. Squid Jigging
- 30. HOtTUB Humbolt Oxygen Temperature Utilization Basin
- 31. The pressure generated by mantle contractions during swimming is correlated with metabolism Generating Field Metabolic Rates Increasing Activity Routine Activity
- 35. Dr. Rui Rosa Metabolic depression at high CO 2 ?
- 37. Epipelagic squids have high metabolic rates Y = 8.6M -0.10
- 39. Blood-Oxygen Dissociation Curve Insert fig.16.34 % Hc-O 2 Saturation
- 40. Highly pH-sensitive oxygen binding Bohr Coefficient = ∆logP 50 ∆pH -1 Bohr = -1.1
- 42. ATP turnover = Aerobic + Anaerobic Energy Equivalents Aerobic ~ O 2 consumed Anaerobic ~ ∆[octopine] + ∆[ATP] + ∆[Arg-P] Calculation of Metabolic Suppression
- 43. Depressing Effect of Hypoxia On Respiration Rate at 10°C 1% Oxygen 20% Oxygen
- 44. Anaerobic metabolism results in a small amount of octopine accumulation during hypoxic exposure… … but not enough to compensate for reduced oxygen availability. Thus, total metabolism is reduced during hypoxic exposure. a b A B C a * b * c **
- 45. Anoxia tolerance (days) ATP turnover (% control) Hand, 1998 Anoxia tolerance correlates with metabolic suppression
- 46. Lloyd Trueblood Dr. Rui Rosa Albert Nyack Leanne Birden
- 47. But… Oxygen Minimum also a CO 2 Maximum Zone
- 48. Dr. Rui Rosa Metabolic depression at high CO 2 ?
- 49. No effect of CO 2 at low temperature and low activity
- 52. CO 2 effect on oxygen consumption rates Most pronounced at high activity levels MO 2 0.1% CO 2 Control MO 2
- 53. Metabolism is reduced at 0.1% CO2 and 20°C Not significant at 10°C
- 54. Cycles in Oxygen Consumption and Activity
- 55. Activity is reduced at 0.1% CO 2
- 57. Thus, ocean acidification and warming may create a ceiling that precludes these squids from near surface waters, while the expanding hypoxic zone may elevate the floor below which they cannot penetrate during their night-time recovery from hypoxia. The synergistic effect of these three climate-related variables may be to vertically-compress the habitable night-time depth range of the species -Rosa and Seibel, 2008 PNAS
- 58. Acknowledgements
- 59. Rui Rosa Albert Nyack Lloyd Trueblood Amy Maas Leanne Birden Stephanie Bush Christine Huffard Steven Haddock William Gilly Cesar Salinas Bruce Robison Christine Cass Dale Webber Alison Sweeney Trisha Towanda Jillian Schneider
Editor's Notes
- From Jerry Meehl This slide shows the time evolution of globally averaged surface air temperature from multiple ensemble simulations of 20th century climate from the NCAR Parallel Climate Model (PCM) compared to observations. The simulations start in the late 19th century, and continue to the year 2000. The temperature scale at left is in degrees Centigrade, and temperature anomalies are calculated relative to a reference period averaged from 1890 to 1919. The black line shows the observed data, or the actual, recorded globally averaged surface air temperatures from the past century. The blue and red lines are the average of four simulations each from the computer model. The pink and light blue shaded areas depict the range of the four simulations for each experiment, giving an idea of the uncertainty of a given realization of 20th century climate from the climate model. The blue line shows the average from the four member ensemble of the simulated time evolution of globally average surface air temperature when only "natural" influences (solar variability and volcanic eruptions) are included in the model. Therefore, the blue line represents what the model says global average temperatures would have been if there had been no human influences. The red line shows the average of the four member ensemble experiment when natural forcings AND anthropogenic influences (greenhouse gases including carbon dioxide, sulfate aerosols from air pollution, and ozone changes) are included in the model. Note that this model can reproduce the actual, observed data very well only if the combined effects of natural and anthropogenic factors are included. The conclusion that can be drawn is that naturally occuring influences on climate contributed to most of the warming that occurred before WWII, but that the large observed temperature increases since the 1970s can only be simulated in the model if anthropogenic factors are included. This confirms the conclusion of the IPCC Third Assessment Report that most of the warming we have observed in the latter part of the 20th century has been due to human influences.
- Vampire squid in 1 liter of air-saturated water would survive about 16 hours, an epipelagic squid would survive only 3.8 minutes at 5°C.