Download to read offline


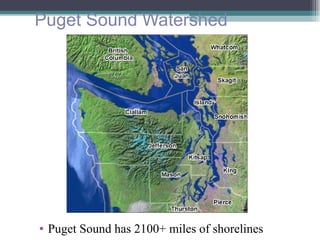
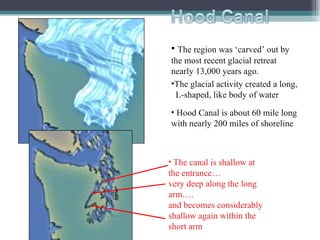
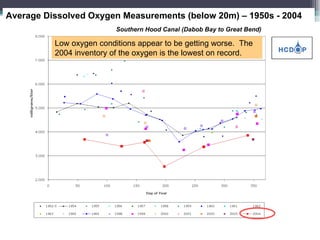
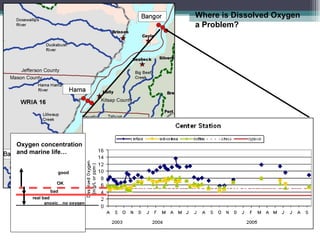
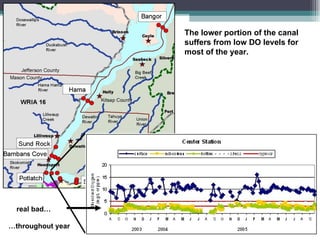
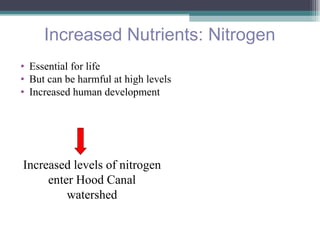
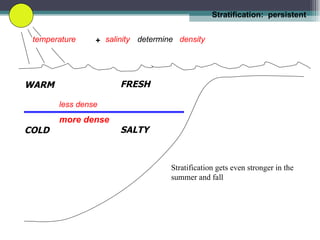
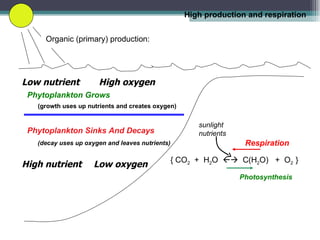
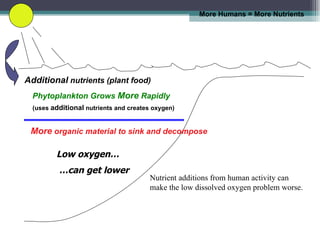
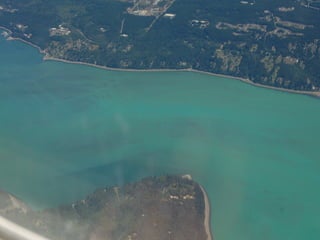
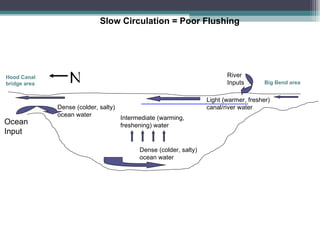
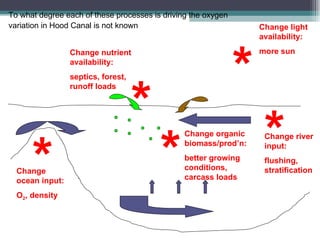
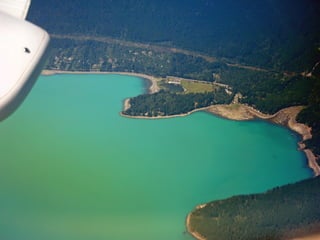


- Hood Canal is a long, L-shaped body of water located in Washington state that has experienced declining dissolved oxygen levels, particularly in southern Hood Canal. - Multiple factors contribute to low dissolved oxygen in Hood Canal, including strong stratification that prevents mixing of deep waters, slow circulation, and high productivity that leads to decomposition of organic matter and oxygen depletion. - Increasing human development in the area has elevated nutrient levels in Hood Canal waters, fueling more rapid algal growth and higher oxygen demand when this material decomposes.


