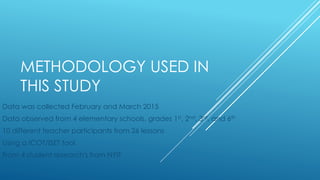
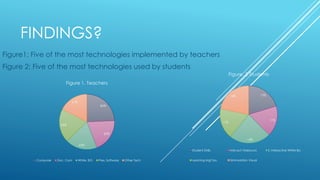
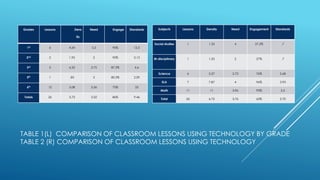
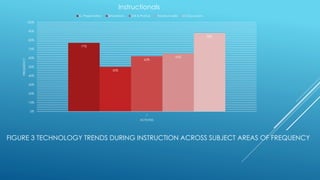
HOW TEACHERS ARE INTEGRATING
TECHNOLOGY IN THE CLASSROOM?
Joan Shakes
New York Institute of Technology
Masters of Science in Adolescent Education Specialist in Science
EDPC 691-FT3-2015
Dr. Minaz Fazal
Spring 2015
HOW?
Teachers are integrating technology to guide and facilitate instruction.
Technology did not dictate teaching practices.
Facilitated: instructional note, daily tasks, homework, and whole class
teaching with less down time by less fondling with papers.
METHODOLOGY USED IN
THIS STUDY
Data was collected February and March 2015
Data observed from 4 elementary schools, grades 1st, 2nd, 3rd, and 6th
10 different teacher participants from 26 lessons
Using a ICOT/ISET tool
From 4 student research's from NYIT
FINDINGS?
Figure1: Five of the most technologies implemented by teachers
Figure 2: Five of the most technologies used by students
85%
69%
65%
69%
61%
Figure 1. Teachers
Computer Doc. Cam White. BO. Pres. Software Other Tech
13%
11%
15%
11%
14%
Figure. 2 Students
Student Driils Inte-act Videocon S. Interactive White Bo.
Learning Mgt Sys. Simmulation Visual
TABLE 1(L) COMPARISON OF CLASSROOM LESSONS USING TECHNOLOGY BY GRADE
TABLE 2 (R) COMPARISON OF CLASSROOM LESSONS USING TECHNOLOGY
Grades Lessons Dens
ity
Need Engage Standards
1st 6 4.54 5.5 96% 12.5
2nd 2 1.95 2 95% 3.13
3rd 5 6.25 3.75 87.5% 4.6
5th 1 .83 2 80.5% 2.09
6th 12 5.08 3.36 75% 25
Totals 26 3.73 3.32 86% 9.46
Subjects Lessons Density Need Engagement Standards
Social studies 1 1.33 4 27.2% .7
M-disciplinary 1 1.33 2 27% .7
Science 6 5.37 2.75 76% 2.68
ELA 7 7.87 4 96% 3.93
Math 11 11 3.96 93% 5.5
Total 26 6.72 3.76 63% 2.70
FIGURE 3 TECHNOLOGY TRENDS DURING INSTRUCTION ACROSS SUBJECT AREAS OF FREQUENCY
77%
50%
62%
65%
88%
0%
10%
20%
30%
40%
50%
60%
70%
80%
90%
100%
1
FREQUENCY
ACTIVTIES
Instructionals
G. Presentation Simulations Drill & Pratice Hands-on-skills S.Discussions
NEED FOR THE STUDY?
All students benefit from targeted meaningful technology integrated in lessons. Strong correlation
of full integration of technology exposure for all student leaners for college and career readiness
(Cauley, et, al. 2009)
To improve technology integration proper matching and daily exposure is imperative for student
learning needs to maximize learning potentials (Tindal, et al., 1999)
Children learn best with differential instruction and specific software is designed to meet individuals
levels of all students (Anderson-Inman et al., 2007) and (Gardener 1993)
SUMMARY AND IMPLICATIONS
In this study there were patterns of learning activity’s by each grade that were in direct correlation
to engagement with technology. Based on the meaningful patterns of technology initial findings on
ICOT observation tool results indicate teachers maintain a constant integrations of instruction,
presentations, interactive directions and modeling in each elementary grade. Subsequently,
student grouping, grades levels, learning activities were related to different needs of engagements
and NETS standards met with technology. It can be concluded to meet NETS standards student
centered based creativity and communication with technology instructions need to be
implemented.
LIMITATION AND RECOMMENDATION
Major limitation of this study teacher participants were aware of research observations.
Another limitation could have been avoided if equal amounts of subjects and grade
level as comparable variables were observed. As with amounts of 26 lessons analyzed
highest in ELA and Math to have a total of 18 lesson out the 26, with remaining social
studies, science and the least M-disciplinary studies. To increase relationship variables of
lesson by grades with subject area, closer approximation in each grade and subject
area needs to be analyzed. The results showed in each grade with different subject
areas multiple different percent’s of needs and NETS standards met. However, to
increase equal amounts of grade variables in subject areas more time would be need
for analysis but the increased time would disclose a close NETS and ICOT data standards
met
APPENDIX: 1 AND 2
ICOT/ISET OBSERVATION TOOL
NIH CERTIFICATE

Research Presentation 2015

  • 1.
    HOW TEACHERS AREINTEGRATING TECHNOLOGY IN THE CLASSROOM? Joan Shakes New York Institute of Technology Masters of Science in Adolescent Education Specialist in Science EDPC 691-FT3-2015 Dr. Minaz Fazal Spring 2015
  • 2.
    HOW? Teachers are integratingtechnology to guide and facilitate instruction. Technology did not dictate teaching practices. Facilitated: instructional note, daily tasks, homework, and whole class teaching with less down time by less fondling with papers.
  • 3.
    METHODOLOGY USED IN THISSTUDY Data was collected February and March 2015 Data observed from 4 elementary schools, grades 1st, 2nd, 3rd, and 6th 10 different teacher participants from 26 lessons Using a ICOT/ISET tool From 4 student research's from NYIT
  • 4.
    FINDINGS? Figure1: Five ofthe most technologies implemented by teachers Figure 2: Five of the most technologies used by students 85% 69% 65% 69% 61% Figure 1. Teachers Computer Doc. Cam White. BO. Pres. Software Other Tech 13% 11% 15% 11% 14% Figure. 2 Students Student Driils Inte-act Videocon S. Interactive White Bo. Learning Mgt Sys. Simmulation Visual
  • 5.
    TABLE 1(L) COMPARISONOF CLASSROOM LESSONS USING TECHNOLOGY BY GRADE TABLE 2 (R) COMPARISON OF CLASSROOM LESSONS USING TECHNOLOGY Grades Lessons Dens ity Need Engage Standards 1st 6 4.54 5.5 96% 12.5 2nd 2 1.95 2 95% 3.13 3rd 5 6.25 3.75 87.5% 4.6 5th 1 .83 2 80.5% 2.09 6th 12 5.08 3.36 75% 25 Totals 26 3.73 3.32 86% 9.46 Subjects Lessons Density Need Engagement Standards Social studies 1 1.33 4 27.2% .7 M-disciplinary 1 1.33 2 27% .7 Science 6 5.37 2.75 76% 2.68 ELA 7 7.87 4 96% 3.93 Math 11 11 3.96 93% 5.5 Total 26 6.72 3.76 63% 2.70
  • 6.
    FIGURE 3 TECHNOLOGYTRENDS DURING INSTRUCTION ACROSS SUBJECT AREAS OF FREQUENCY 77% 50% 62% 65% 88% 0% 10% 20% 30% 40% 50% 60% 70% 80% 90% 100% 1 FREQUENCY ACTIVTIES Instructionals G. Presentation Simulations Drill & Pratice Hands-on-skills S.Discussions
  • 7.
    NEED FOR THESTUDY? All students benefit from targeted meaningful technology integrated in lessons. Strong correlation of full integration of technology exposure for all student leaners for college and career readiness (Cauley, et, al. 2009) To improve technology integration proper matching and daily exposure is imperative for student learning needs to maximize learning potentials (Tindal, et al., 1999) Children learn best with differential instruction and specific software is designed to meet individuals levels of all students (Anderson-Inman et al., 2007) and (Gardener 1993)
  • 8.
    SUMMARY AND IMPLICATIONS Inthis study there were patterns of learning activity’s by each grade that were in direct correlation to engagement with technology. Based on the meaningful patterns of technology initial findings on ICOT observation tool results indicate teachers maintain a constant integrations of instruction, presentations, interactive directions and modeling in each elementary grade. Subsequently, student grouping, grades levels, learning activities were related to different needs of engagements and NETS standards met with technology. It can be concluded to meet NETS standards student centered based creativity and communication with technology instructions need to be implemented.
  • 9.
    LIMITATION AND RECOMMENDATION Majorlimitation of this study teacher participants were aware of research observations. Another limitation could have been avoided if equal amounts of subjects and grade level as comparable variables were observed. As with amounts of 26 lessons analyzed highest in ELA and Math to have a total of 18 lesson out the 26, with remaining social studies, science and the least M-disciplinary studies. To increase relationship variables of lesson by grades with subject area, closer approximation in each grade and subject area needs to be analyzed. The results showed in each grade with different subject areas multiple different percent’s of needs and NETS standards met. However, to increase equal amounts of grade variables in subject areas more time would be need for analysis but the increased time would disclose a close NETS and ICOT data standards met
  • 10.
  • 11.
  • 12.