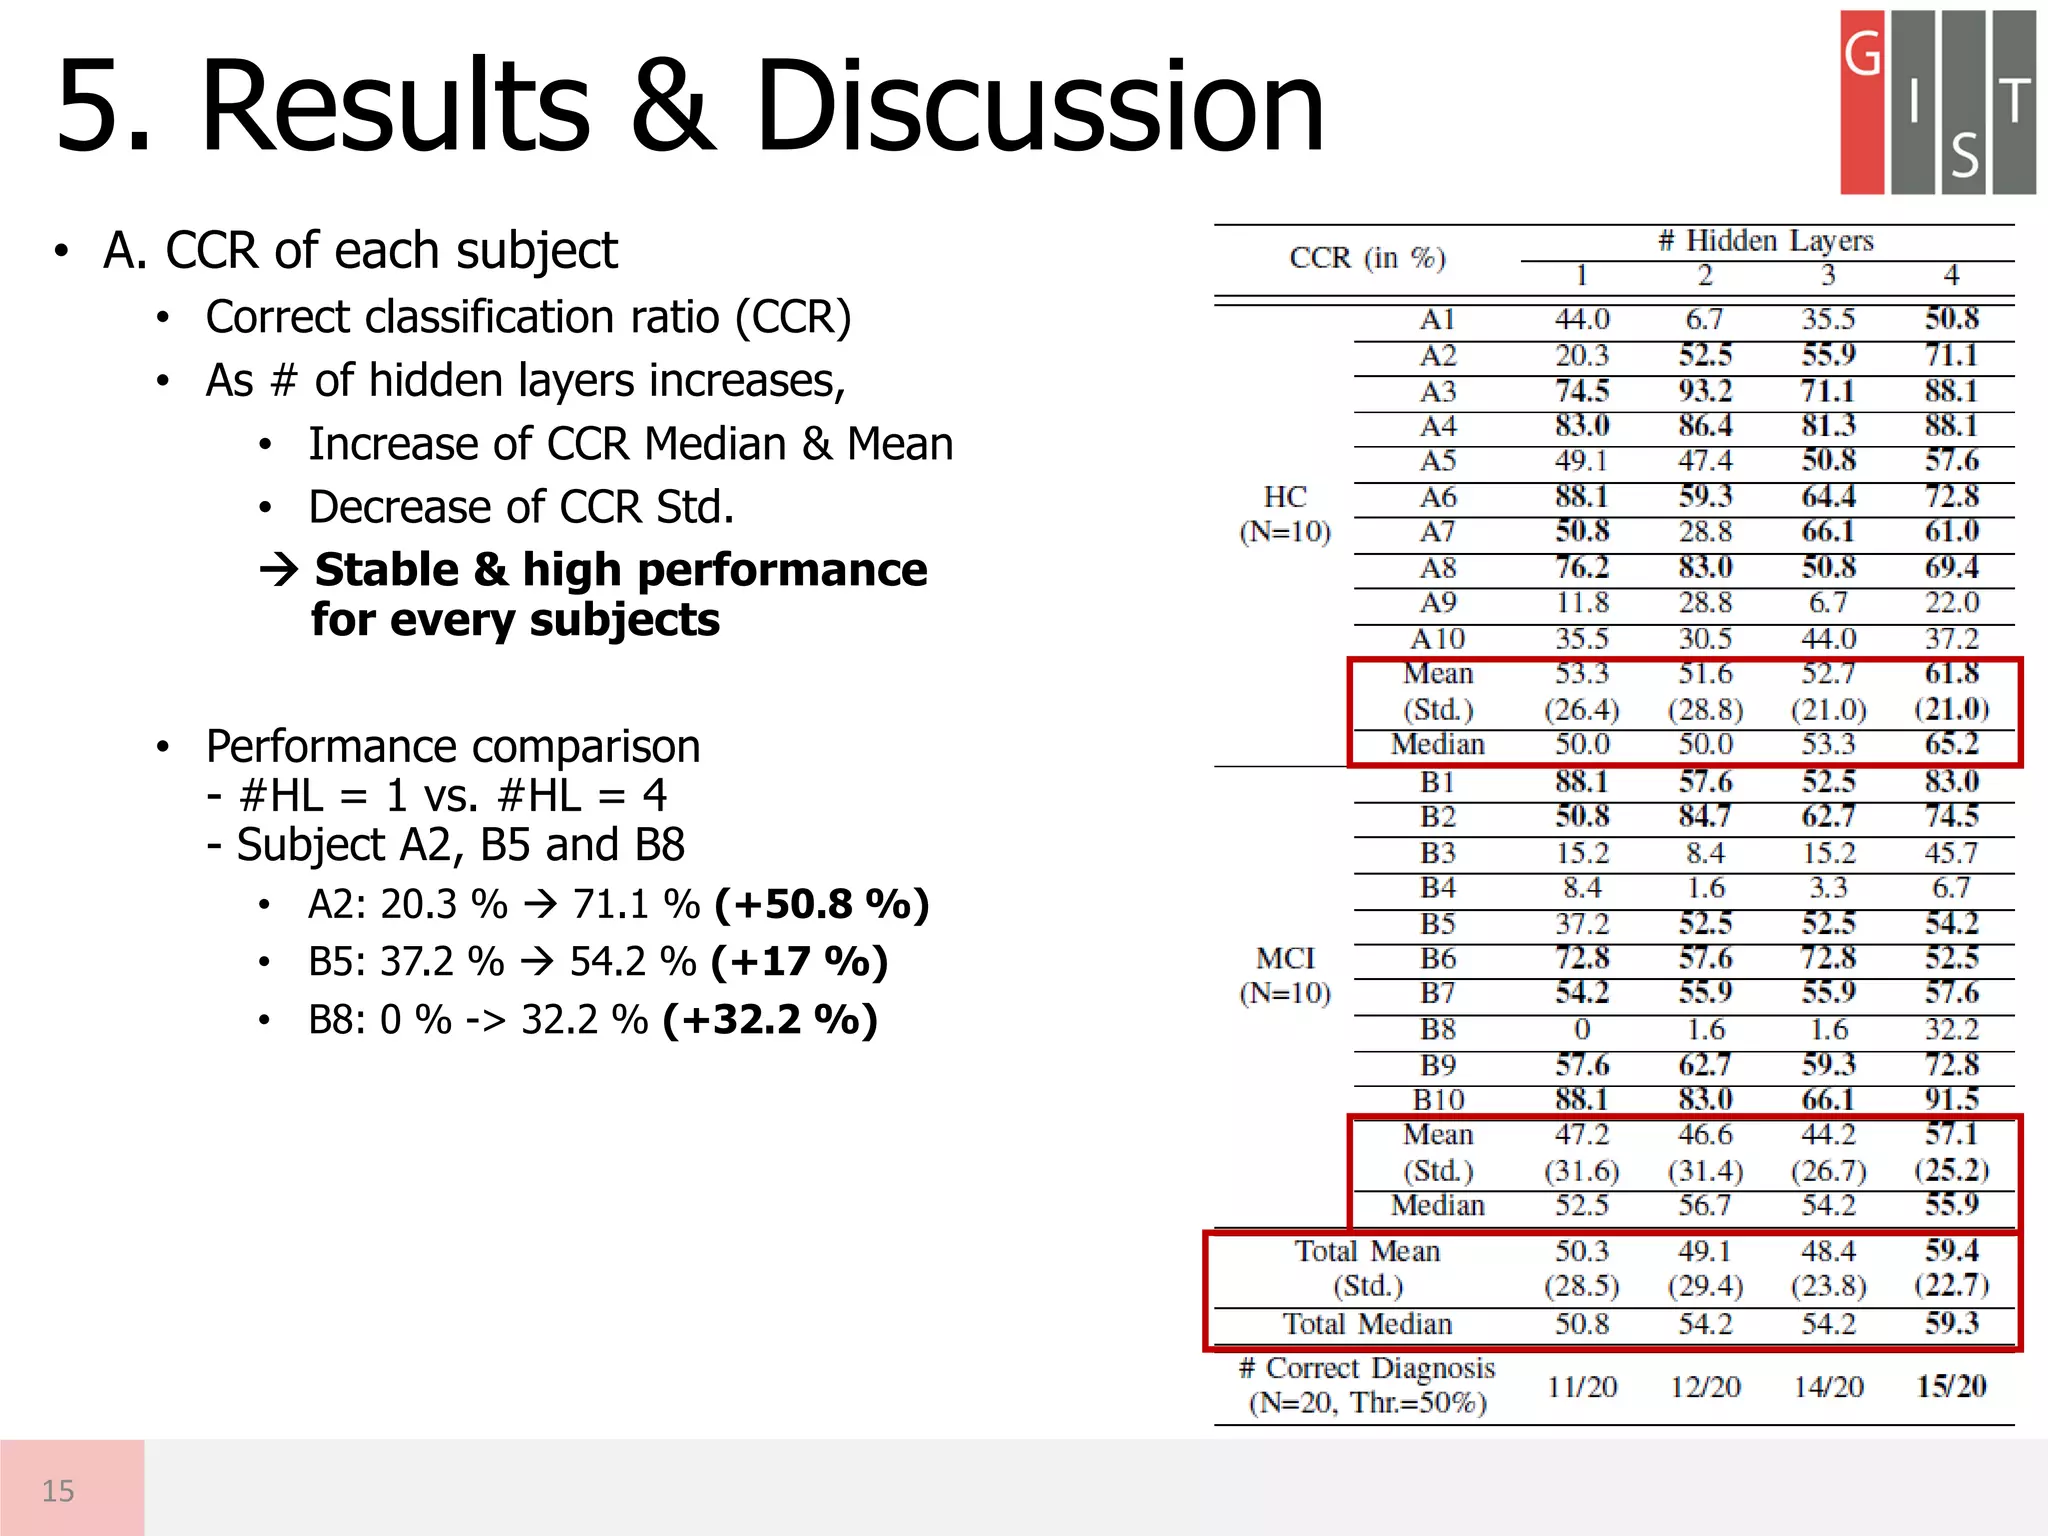
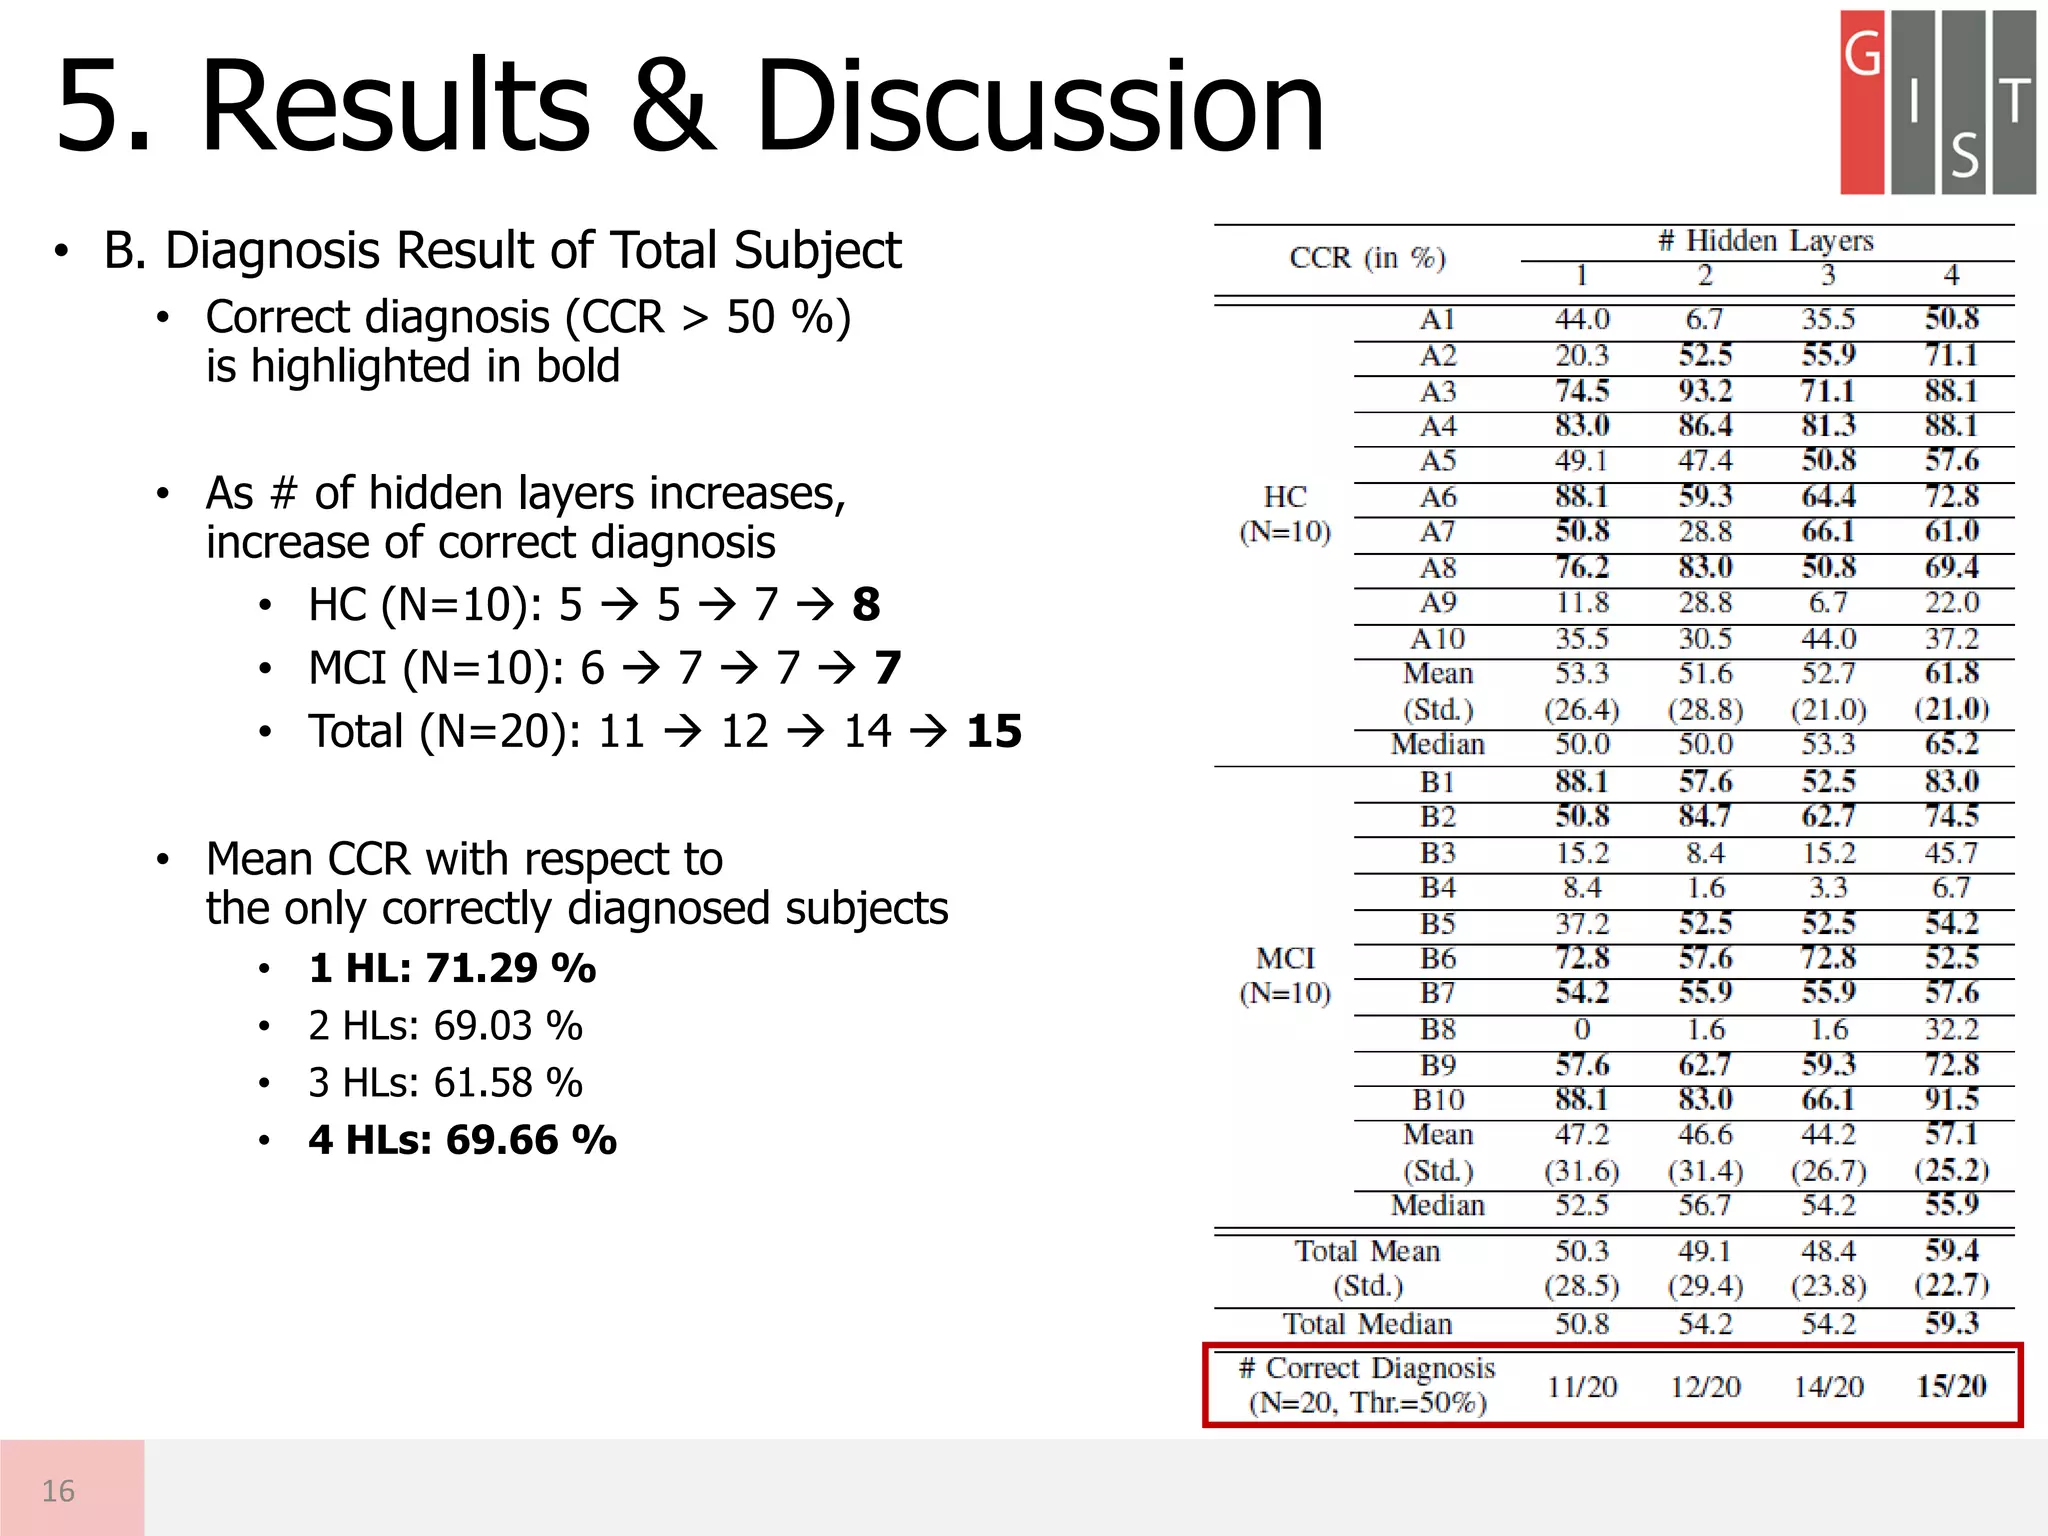
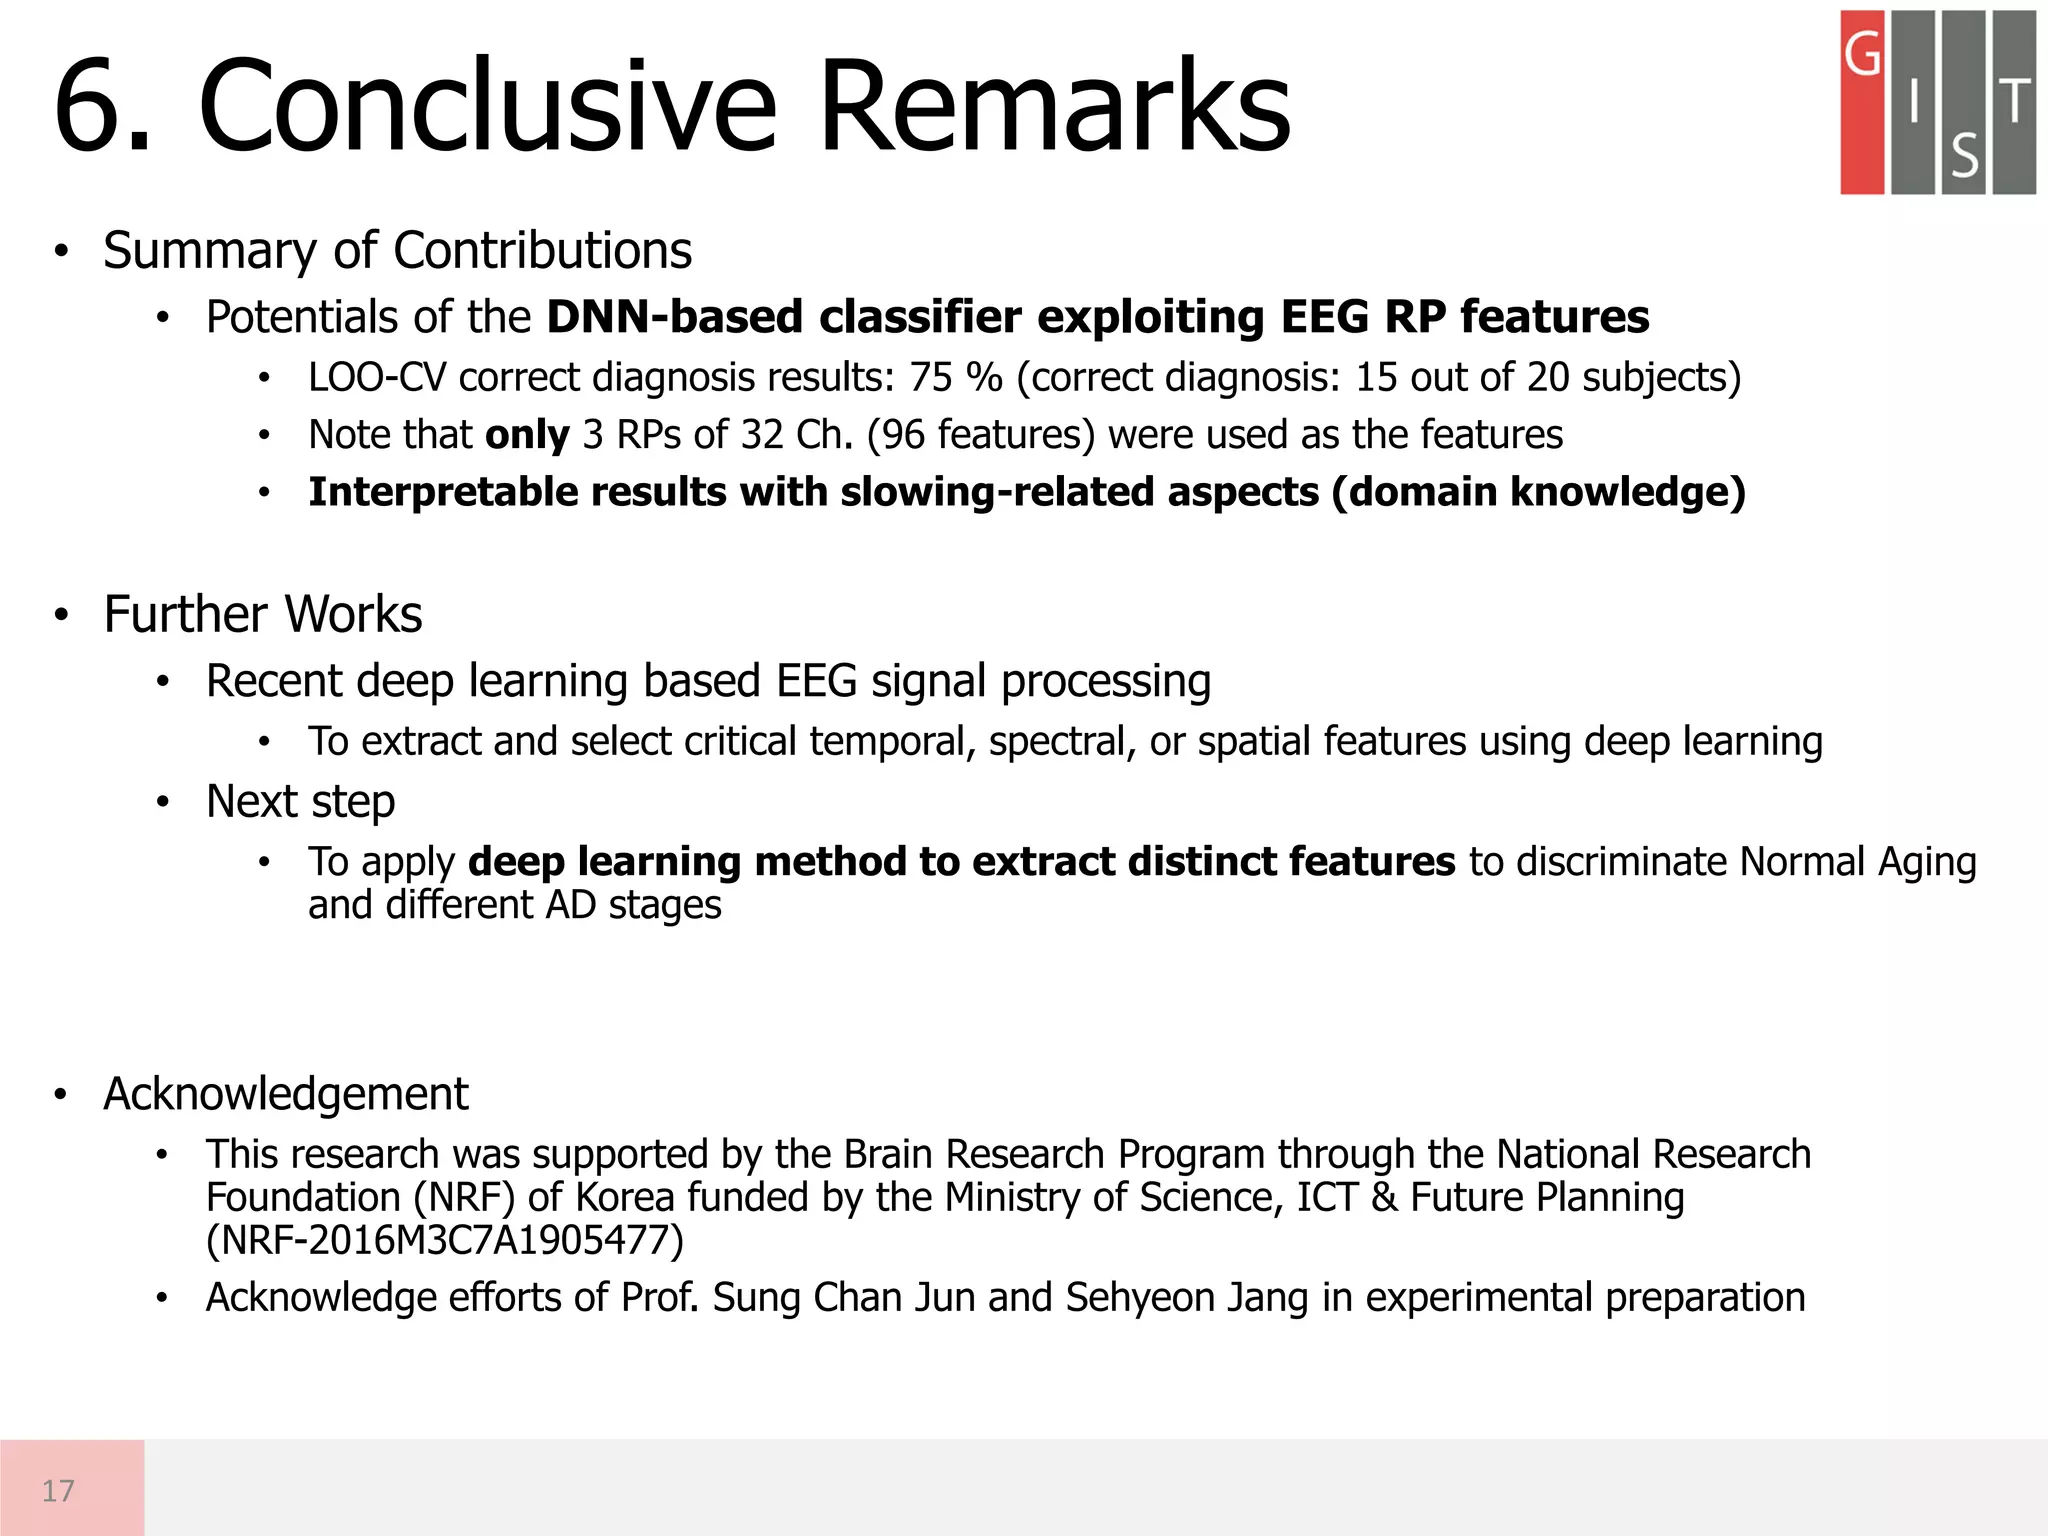
The document discusses the detection of early-stage Alzheimer's disease (AD) using EEG relative power and deep neural networks, highlighting the importance of early diagnosis for effective intervention. It outlines the methodology, including data collection from subjects, feature extraction, and classification using different neural network architectures. Results indicate that a deep neural network can significantly improve diagnostic accuracy compared to traditional methods, showing promise for further research in EEG-based AD detection.
![• Background: Alzheimer’s Disease (AD)
• AD Pathology [R. J. Perrin, ’09]
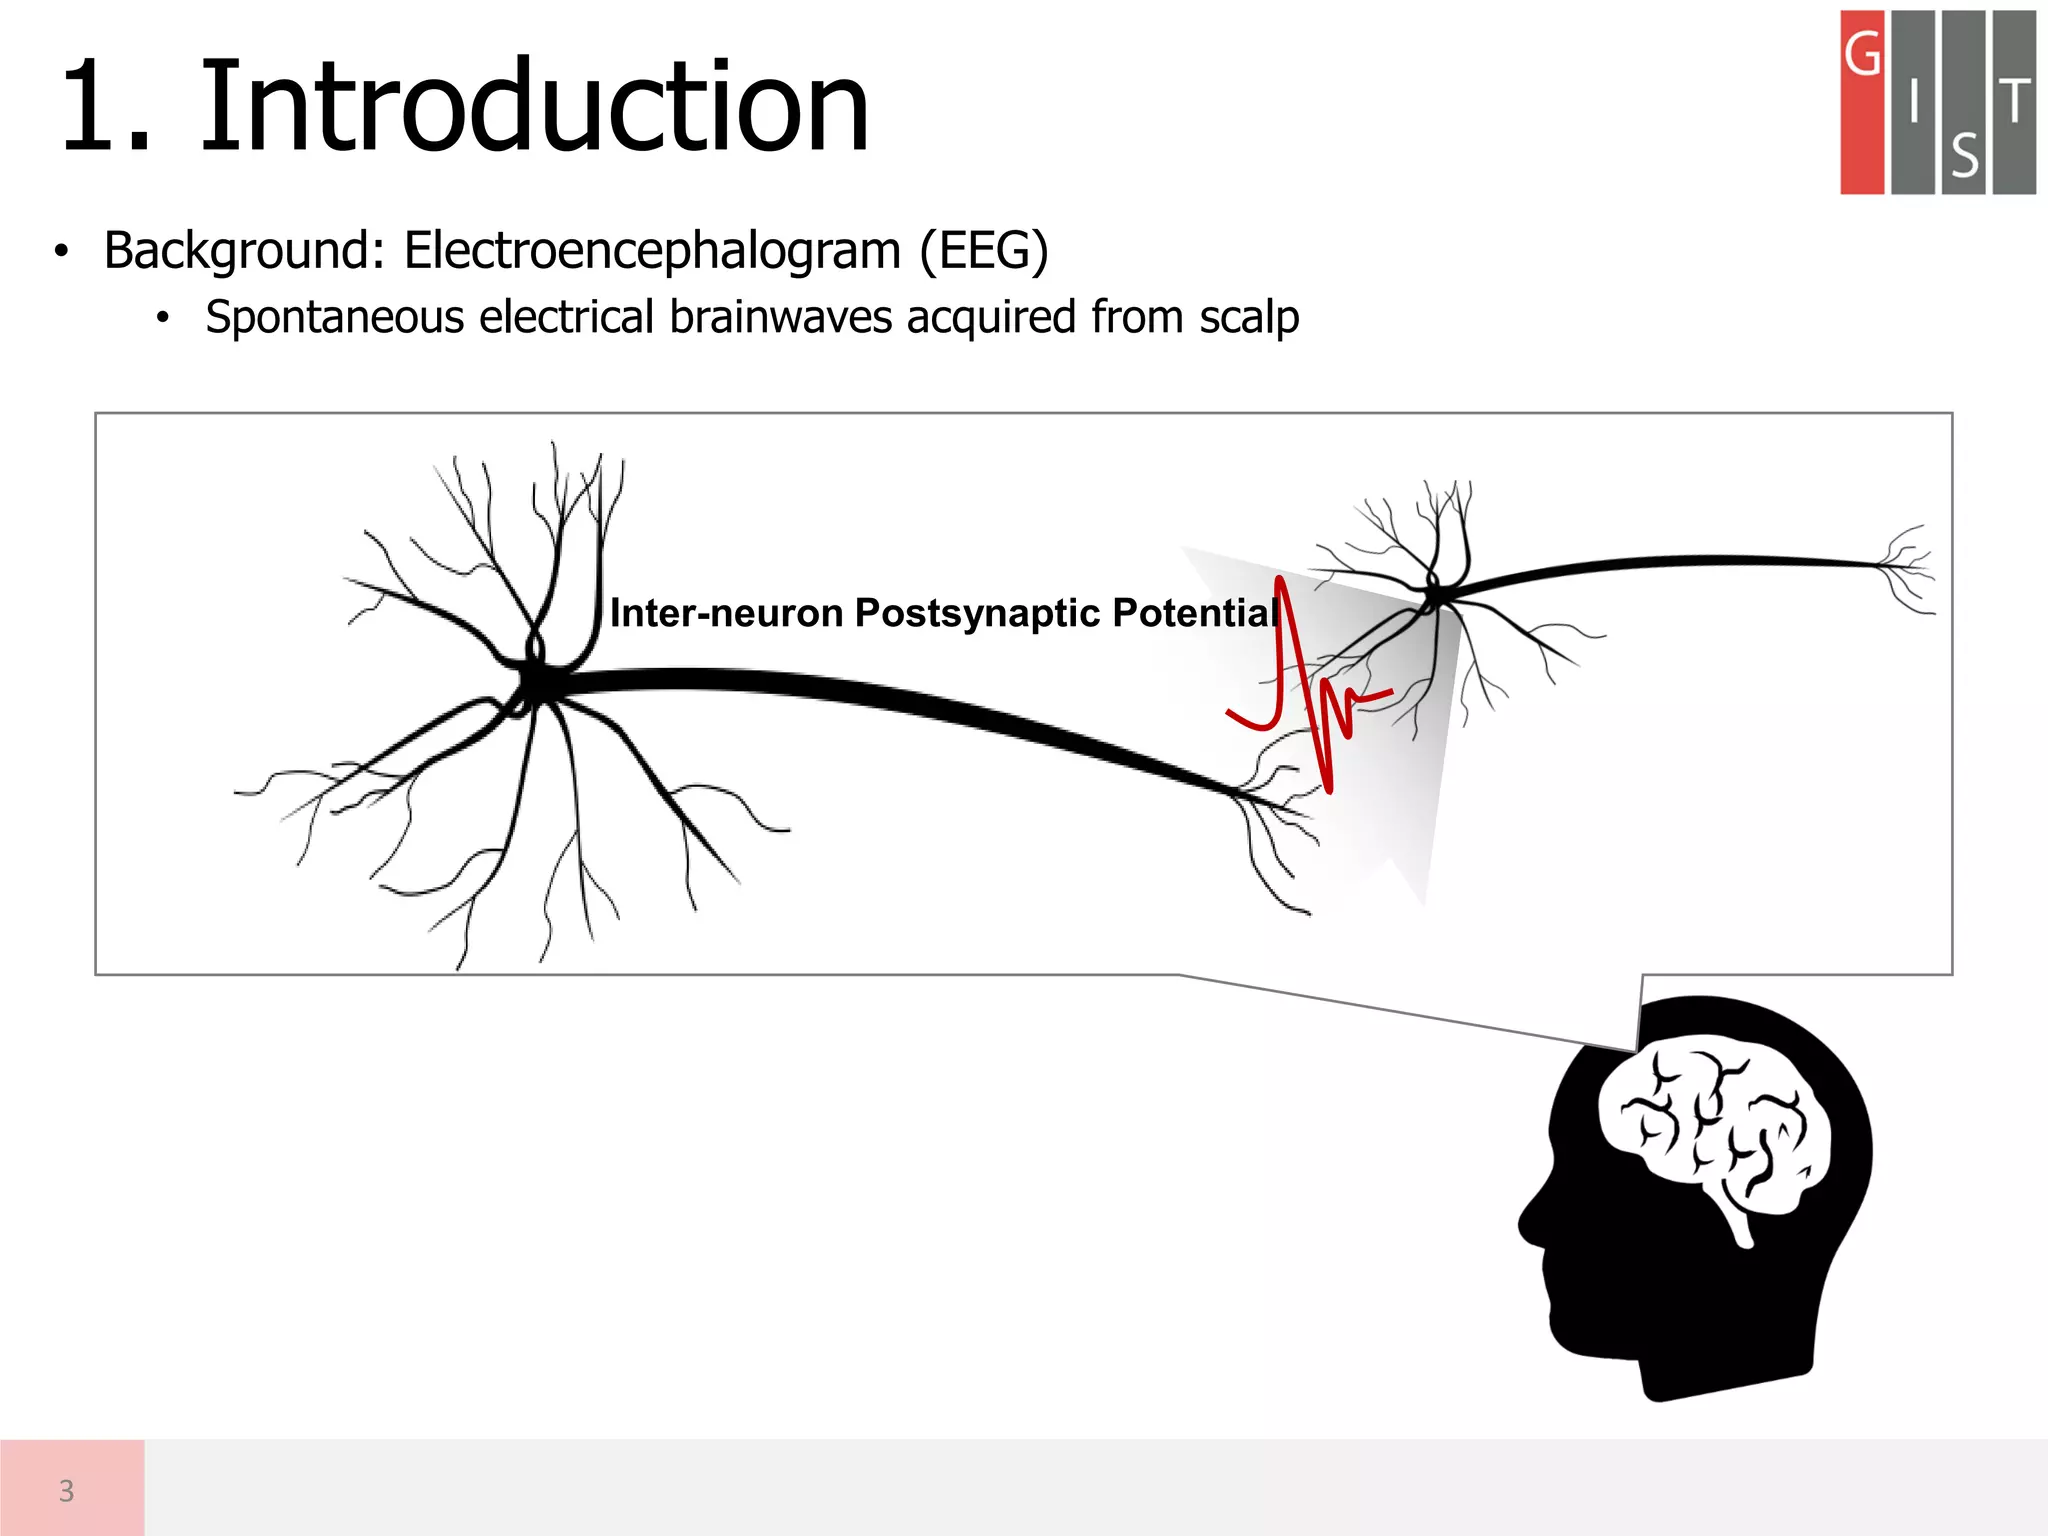
1. Introduction
4
Senile Plaques
Amyloid-beta (Aβ)
Amyloid Plaques
Tau-protein (τ)
Neurofibrillary
Tangles (NFTs)
Accumulation
Accumulation
Brain/ Body/
Behavioral
Problems
Cognitive
decline
A decrease of
neuronal activation
& synaptic coupling
Aβ
τ
Synaptic loss,
neuronal deaths
Plaques
NFTs
Accumulation Interference
Toxicity](https://image.slidesharecdn.com/20180619a-gisteegaddiagnosisdkimconference-180622113717/75/Research-Detection-of-MCI-using-EEG-Relative-Power-DNN-4-2048.jpg)
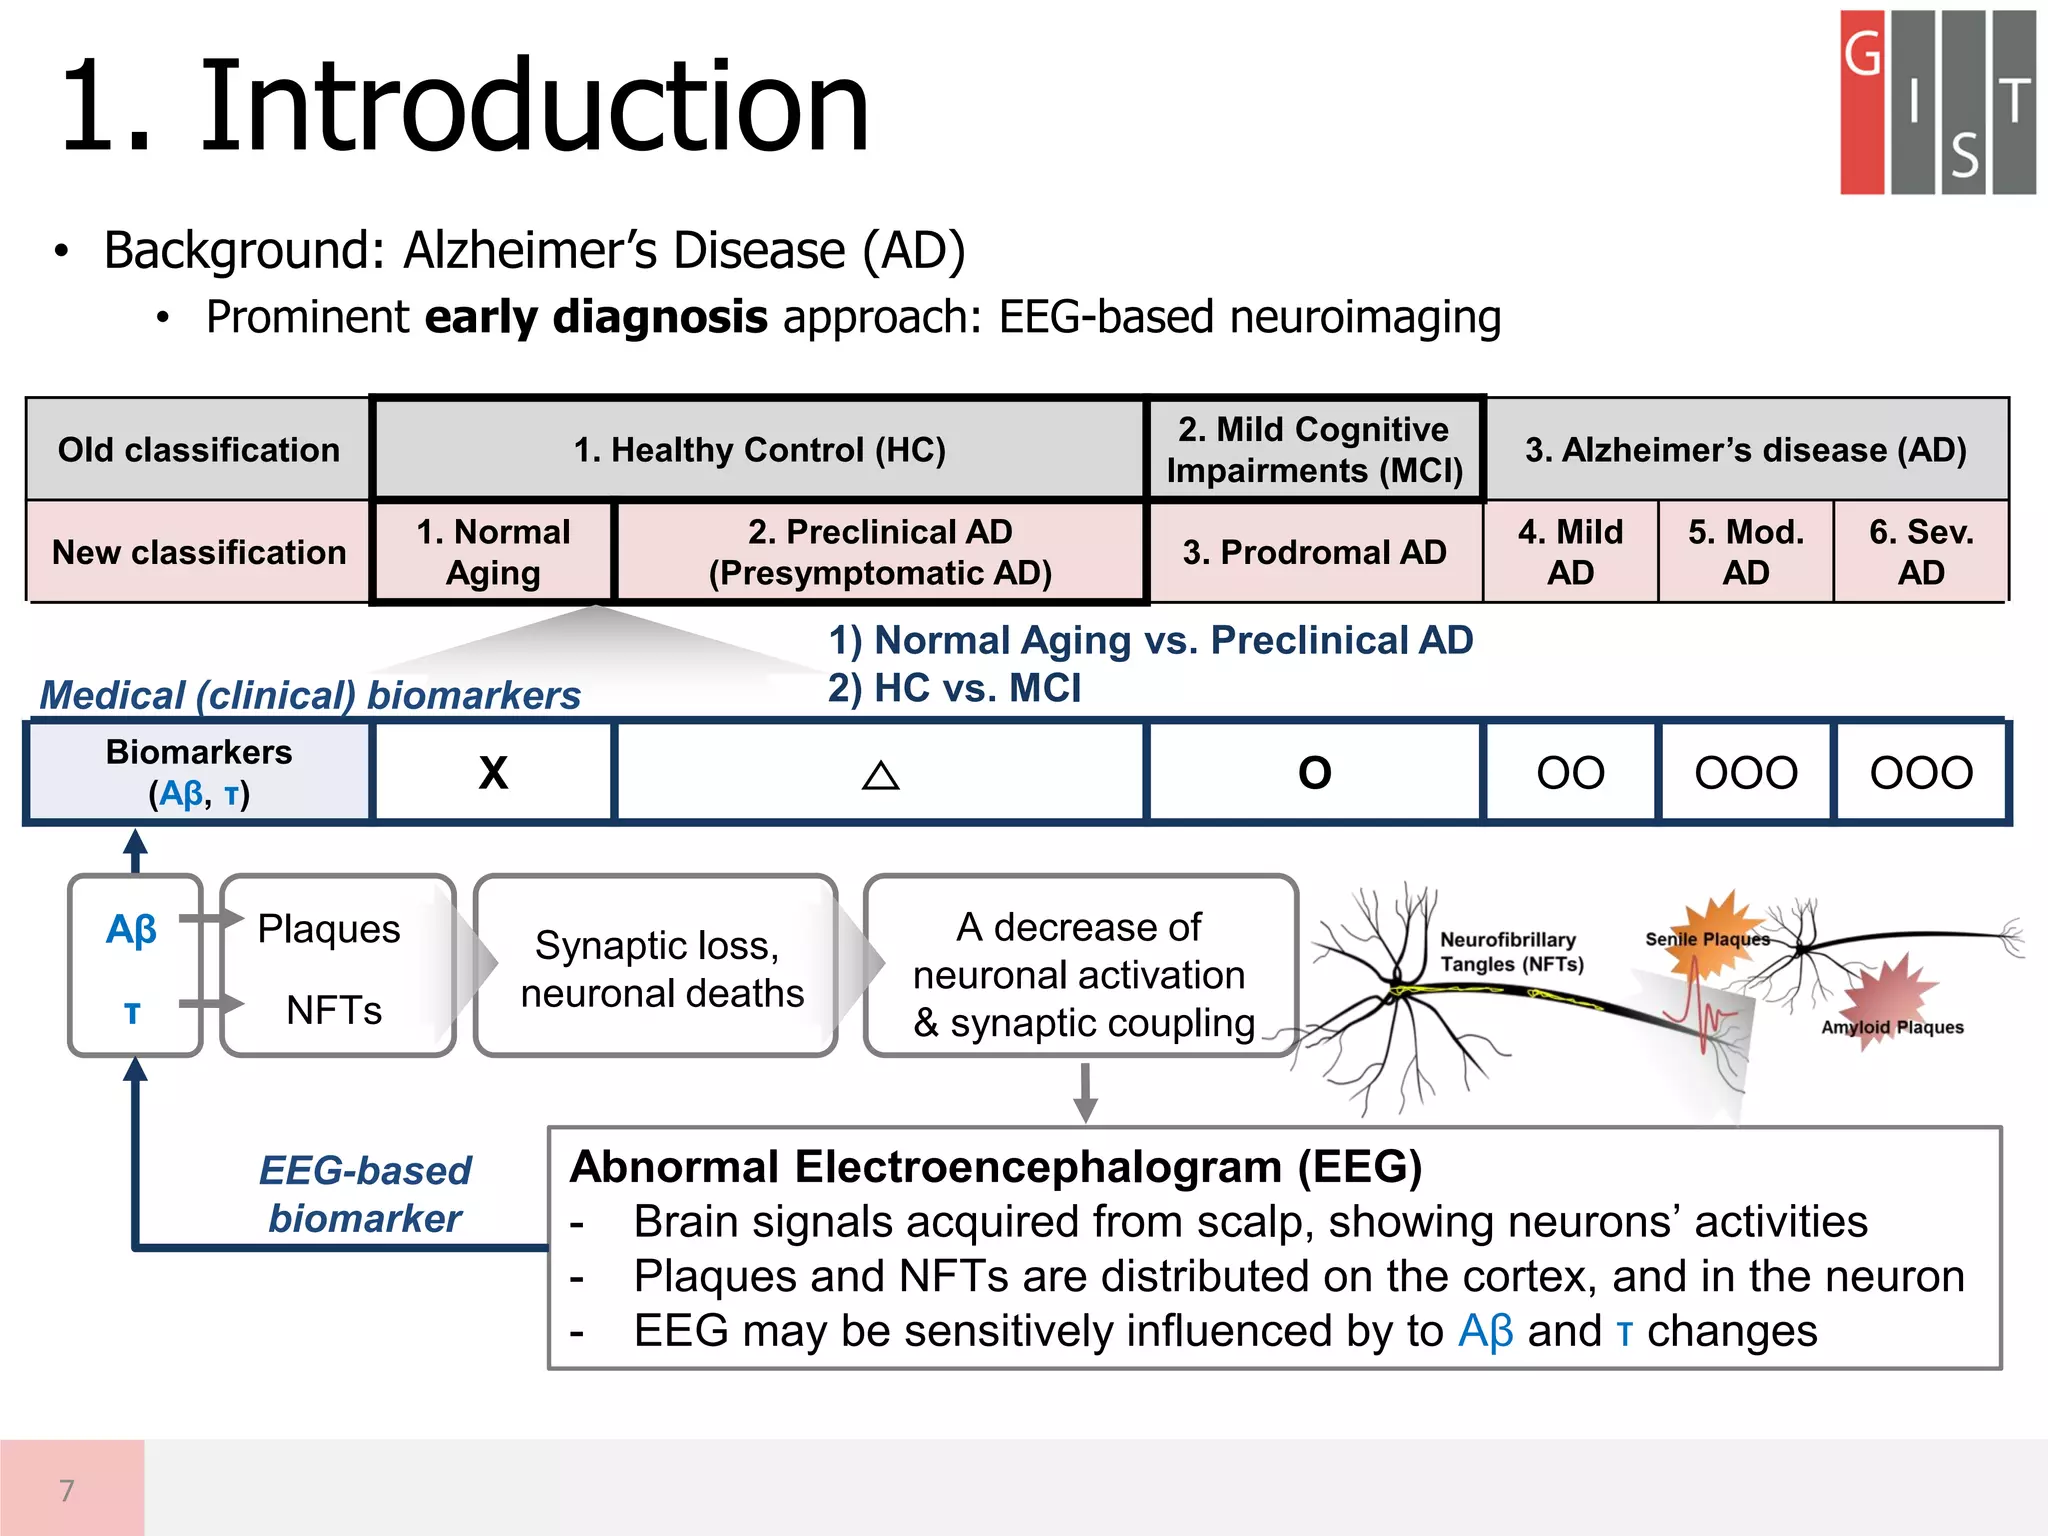
![• Background: Alzheimer’s Disease (AD)
• Clinical AD diagnosis criteria [R. J. Perrin,’09][B. Dubois, ’10]
1. Introduction
5
Old classification 1. Healthy Control (HC)
2. Mild Cognitive
Impairments (MCI)
3. Alzheimer’s disease (AD)
New classification
1. Normal
Aging
2. Preclinical AD
(Presymptomatic AD)
3. Prodromal AD
4. Mild
AD
5. Mod.
AD
6. Sev.
AD
Cognitively
normal O O △ X XX XXX
Biomarkers
(Aβ, τ) X △ O OO OOO OOO
Neuronal integrity
Amyloid plaques
Neurofibrillary tangles
Max.
Min.](https://image.slidesharecdn.com/20180619a-gisteegaddiagnosisdkimconference-180622113717/75/Research-Detection-of-MCI-using-EEG-Relative-Power-DNN-5-2048.jpg)
![• Background: Alzheimer’s Disease (AD)
• Clinical AD diagnosis criteria [R. J. Perrin,’09][B. Dubois, ’10]
1. Introduction
6
Neuronal integrity
Amyloid plaques
Neurofibrillary tangles
Max.
Min.
Old classification 1. Healthy Control (HC)
2. Mild Cognitive
Impairments (MCI)
3. Alzheimer’s disease (AD)
New classification
1. Normal
Aging
2. Preclinical AD
(Pre-symptomatic AD)
3. Prodromal AD
4. Mild
AD
5. Mod.
AD
6. Sev.
AD
Cognitively
normal O O △ X XX XXX
Biomarkers
(Aβ, τ) X △ O OO OOO OOO
Detection of
Preclinical AD or
Prodromal AD (MCI)
is most important
issues for early
diagnosis of AD](https://image.slidesharecdn.com/20180619a-gisteegaddiagnosisdkimconference-180622113717/75/Research-Detection-of-MCI-using-EEG-Relative-Power-DNN-6-2048.jpg)
![• Abnormal EEG Patterns as the AD biomarker [J. Jeong ‘04]
• Remarks
• Most related studies have focused on AD vs. HC
• No previous literature for Normal vs. Preclinical AD using EEG slowing
• Important issue: (1) Which frequency bands? (2) Which region?
2. Related Works
8
Slowing: Slow brain waves of EEG
# Subjects # Channels Features (Spectral bands for RP)
[C. Besthorn ’97] 50 AD / 42 HC 17 δ, θ, α1, α2, β1, β2
[V. Jelic ’00] 15 AD / 27 MCI/ 16 HC 8 δ, θ, α, β
[K. Bennys, ‘01] 35 AD / 35 HC 6
δ, θ, α, β1, β2,
Ratio: θ/(α+β1) & (δ+θ)/(α+β1+β2)
[V. Knott ‘01] 35 AD / 30 HC 21 δ, θ, α, β
[PM. Rossini ‘08]
115 MCI /
171 HC
19 δ, θ, α1, α2, β1, β2, γ
[DV. Moretti ‘12] 79 MCI 19 δ, θ, α1, α2, α3, β1, β2, γ
[N.Benz ‘14] 20 AD / 20 HC 256 δ, θ, α, β, γ
[JC. Mcbride ‘14] 17 AD / 16 MCI/ 15 HC 32 θ, α1, α2, β1, β2, γ
[M. Dauwan ‘16] 66 AD / 66 HC 21 δ, θ, α1, α2, β, γ, Ratio: θ/(θ+α1+α2)
[J. Wang ‘17] 8 AD / 12 HC 32 δ, θ, α, β, γ](https://image.slidesharecdn.com/20180619a-gisteegaddiagnosisdkimconference-180622113717/75/Research-Detection-of-MCI-using-EEG-Relative-Power-DNN-8-2048.jpg)
![• Motivation
• Objective
① To implement the shallow neural network classifier (1-hidden layer)
exploiting conventional EEG relative powers (RPs) for MCI detection
② To design deep neural network (DNN) based system exploiting RPs and
to compare the performance with the SNN-based method
3. Motivation & Objective
9
Key Challenges
(1) Which Spatial Feature?
(2) Which Spectral Feature?
Deep Neural Network using multi-channel EEG RPs
- Potential of DNN classifier exploiting domain knowledge
- Interpretable DNN-based classifier for AD detection
SlowingAβ
τ
Abnormal
EEG
Plaques
NFTs
Spatial Feature
Spectral Feature
Multi-channel
Relative Power
Absolute Power
Power Ratio
Necessity of Early Diagnosis on
Normal Aging vs. Preclinical AD
(Conventional Works: HC vs. MCI)
[R.J. Perrin, ’09]
[B. Dubois, ’10] [J. Jeong ‘04]
[N.Benz ‘14],[JC. Mcbride ‘14]
[M. Dauwan ‘16], [J. Wang ‘17]
[W. Zheng ‘15]
[NS. Kwak ‘17]
[L. Vareka ‘17]](https://image.slidesharecdn.com/20180619a-gisteegaddiagnosisdkimconference-180622113717/75/Research-Detection-of-MCI-using-EEG-Relative-Power-DNN-9-2048.jpg)
![• Summary of LOO-CV Procedures
4. Methods (5 / 5)
14
HC
MCI
Train EEG
[Ns x Nc x Nt]
x (Nsubj-1)
Nsubj = 20 (10 HC, 10 MCI)
Ns = 1,000 Samples (2 s. x 500 Hz)
Nc = 32 Channels
Nt = 59 Trials
Relative Power
[Nb x Nc x Nt]
x (Nsubj-1)
Nb = 3 spectral bands
Features
[Nf x Ntrain]
Nf = (Nb x Nc) features
Ntrain = Nt x (Nsubj-1)
Ntest = Nt x 1
Learn
Neural Network
[Nf x Ntrain]
Dataset Feature Extraction Classification Result (A)
Test EEG
[Ns x Nc x Nt] x 1
Relative Power
[Nb x Nc x Nt] x 1
Features
[Nf x Ntest]
Test
Neural Network
[Nf x Ntest]
Classification
Diagnosis
Result
[Ntest x 1] [HC or MCI]
(A) CCR = Ncc / Ntest
Correct Classification Rate
Ncc: # Correct Classification
(B) Diagnosis = N or Prec.
Based on major votes
Result (B)](https://image.slidesharecdn.com/20180619a-gisteegaddiagnosisdkimconference-180622113717/75/Research-Detection-of-MCI-using-EEG-Relative-Power-DNN-14-2048.jpg)


![[기초개념] Graph Convolutional Network (GCN)](https://cdn.slidesharecdn.com/ss_thumbnails/agistdkimgcn190507-190507153736-thumbnail.jpg?width=640&height=640&fit=bounds)
![[기초개념] Recurrent Neural Network (RNN) 소개](https://cdn.slidesharecdn.com/ss_thumbnails/agistpurnndkim190430-190430140949-thumbnail.jpg?width=640&height=640&fit=bounds)
![[컨퍼런스] 모두콘 2018 리뷰](https://cdn.slidesharecdn.com/ss_thumbnails/agistmoducon2018reviewdonghyeonkim190226-190226151647-thumbnail.jpg?width=640&height=640&fit=bounds)
![[논문리뷰] Data Augmentation for 1D 시계열 데이터](https://cdn.slidesharecdn.com/ss_thumbnails/20181204a-gistdataugwearableeegdkim-181212141033-thumbnail.jpg?width=640&height=640&fit=bounds)
![[GDG DevFest Gwangju 2018] 나도쓰고싶다 딥러닝: 통신/ IoT/ 웨어러블/ 에너지/ 의료헬스케어 적용하기](https://cdn.slidesharecdn.com/ss_thumbnails/gdgdevfestgwangju2018dkim-181212140243-thumbnail.jpg?width=640&height=640&fit=bounds)
![[논문리뷰] 딥러닝 적용한 EEG 연구 소개](https://cdn.slidesharecdn.com/ss_thumbnails/20180404a-gistintroeegdldkim-180622112533-thumbnail.jpg?width=640&height=640&fit=bounds)


