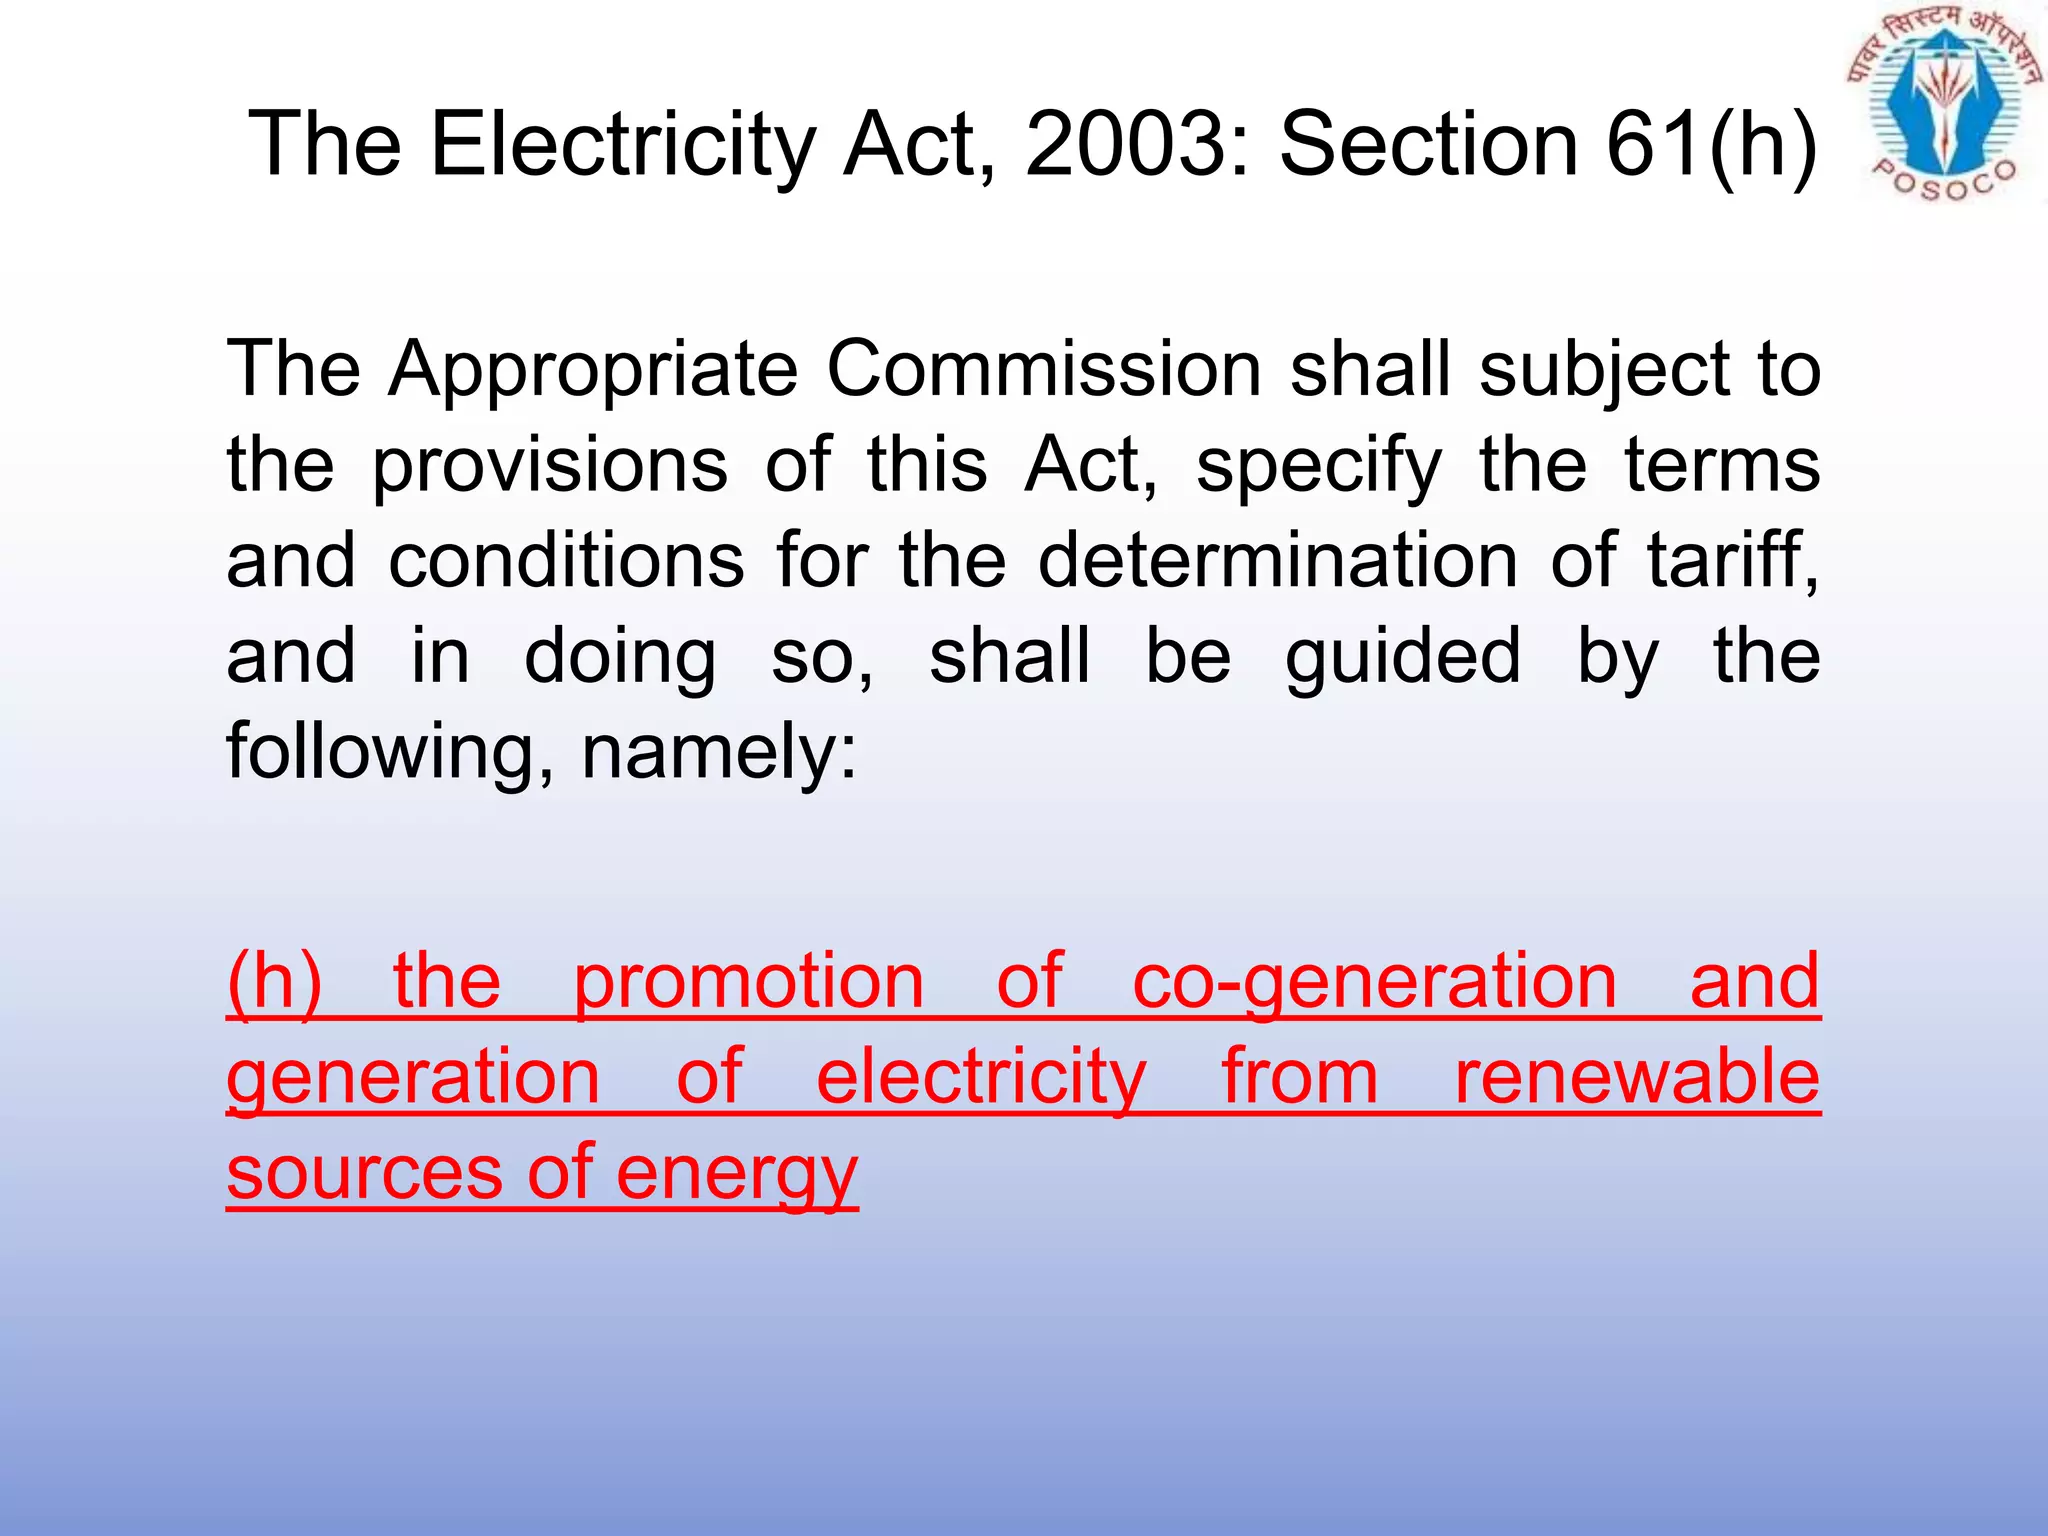
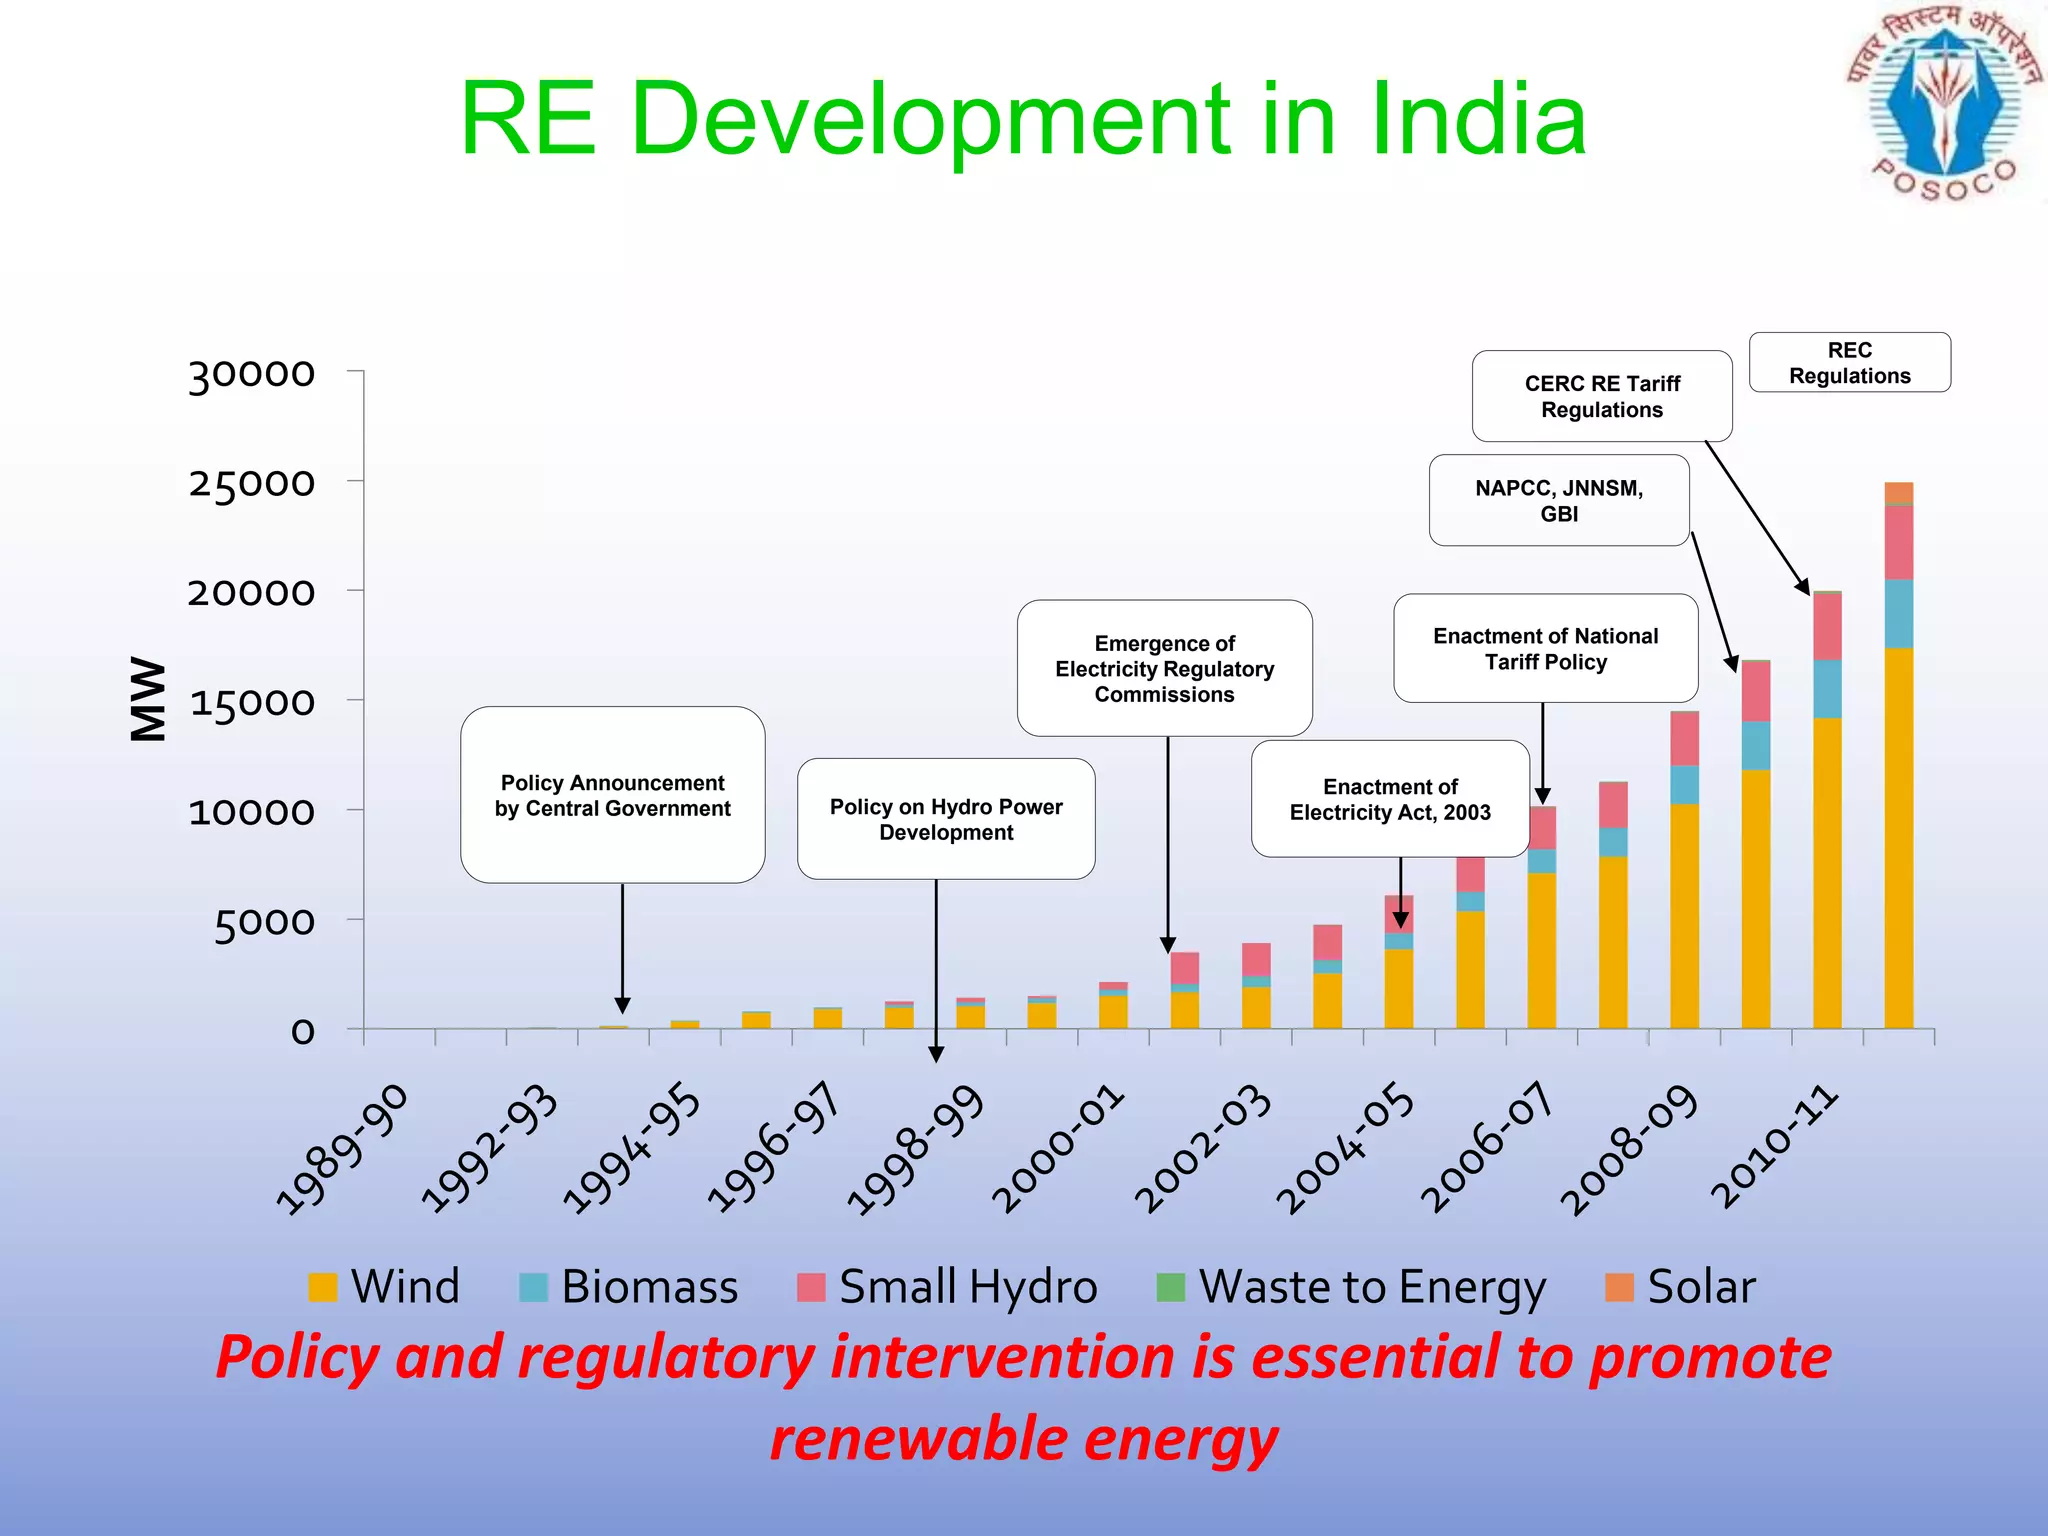
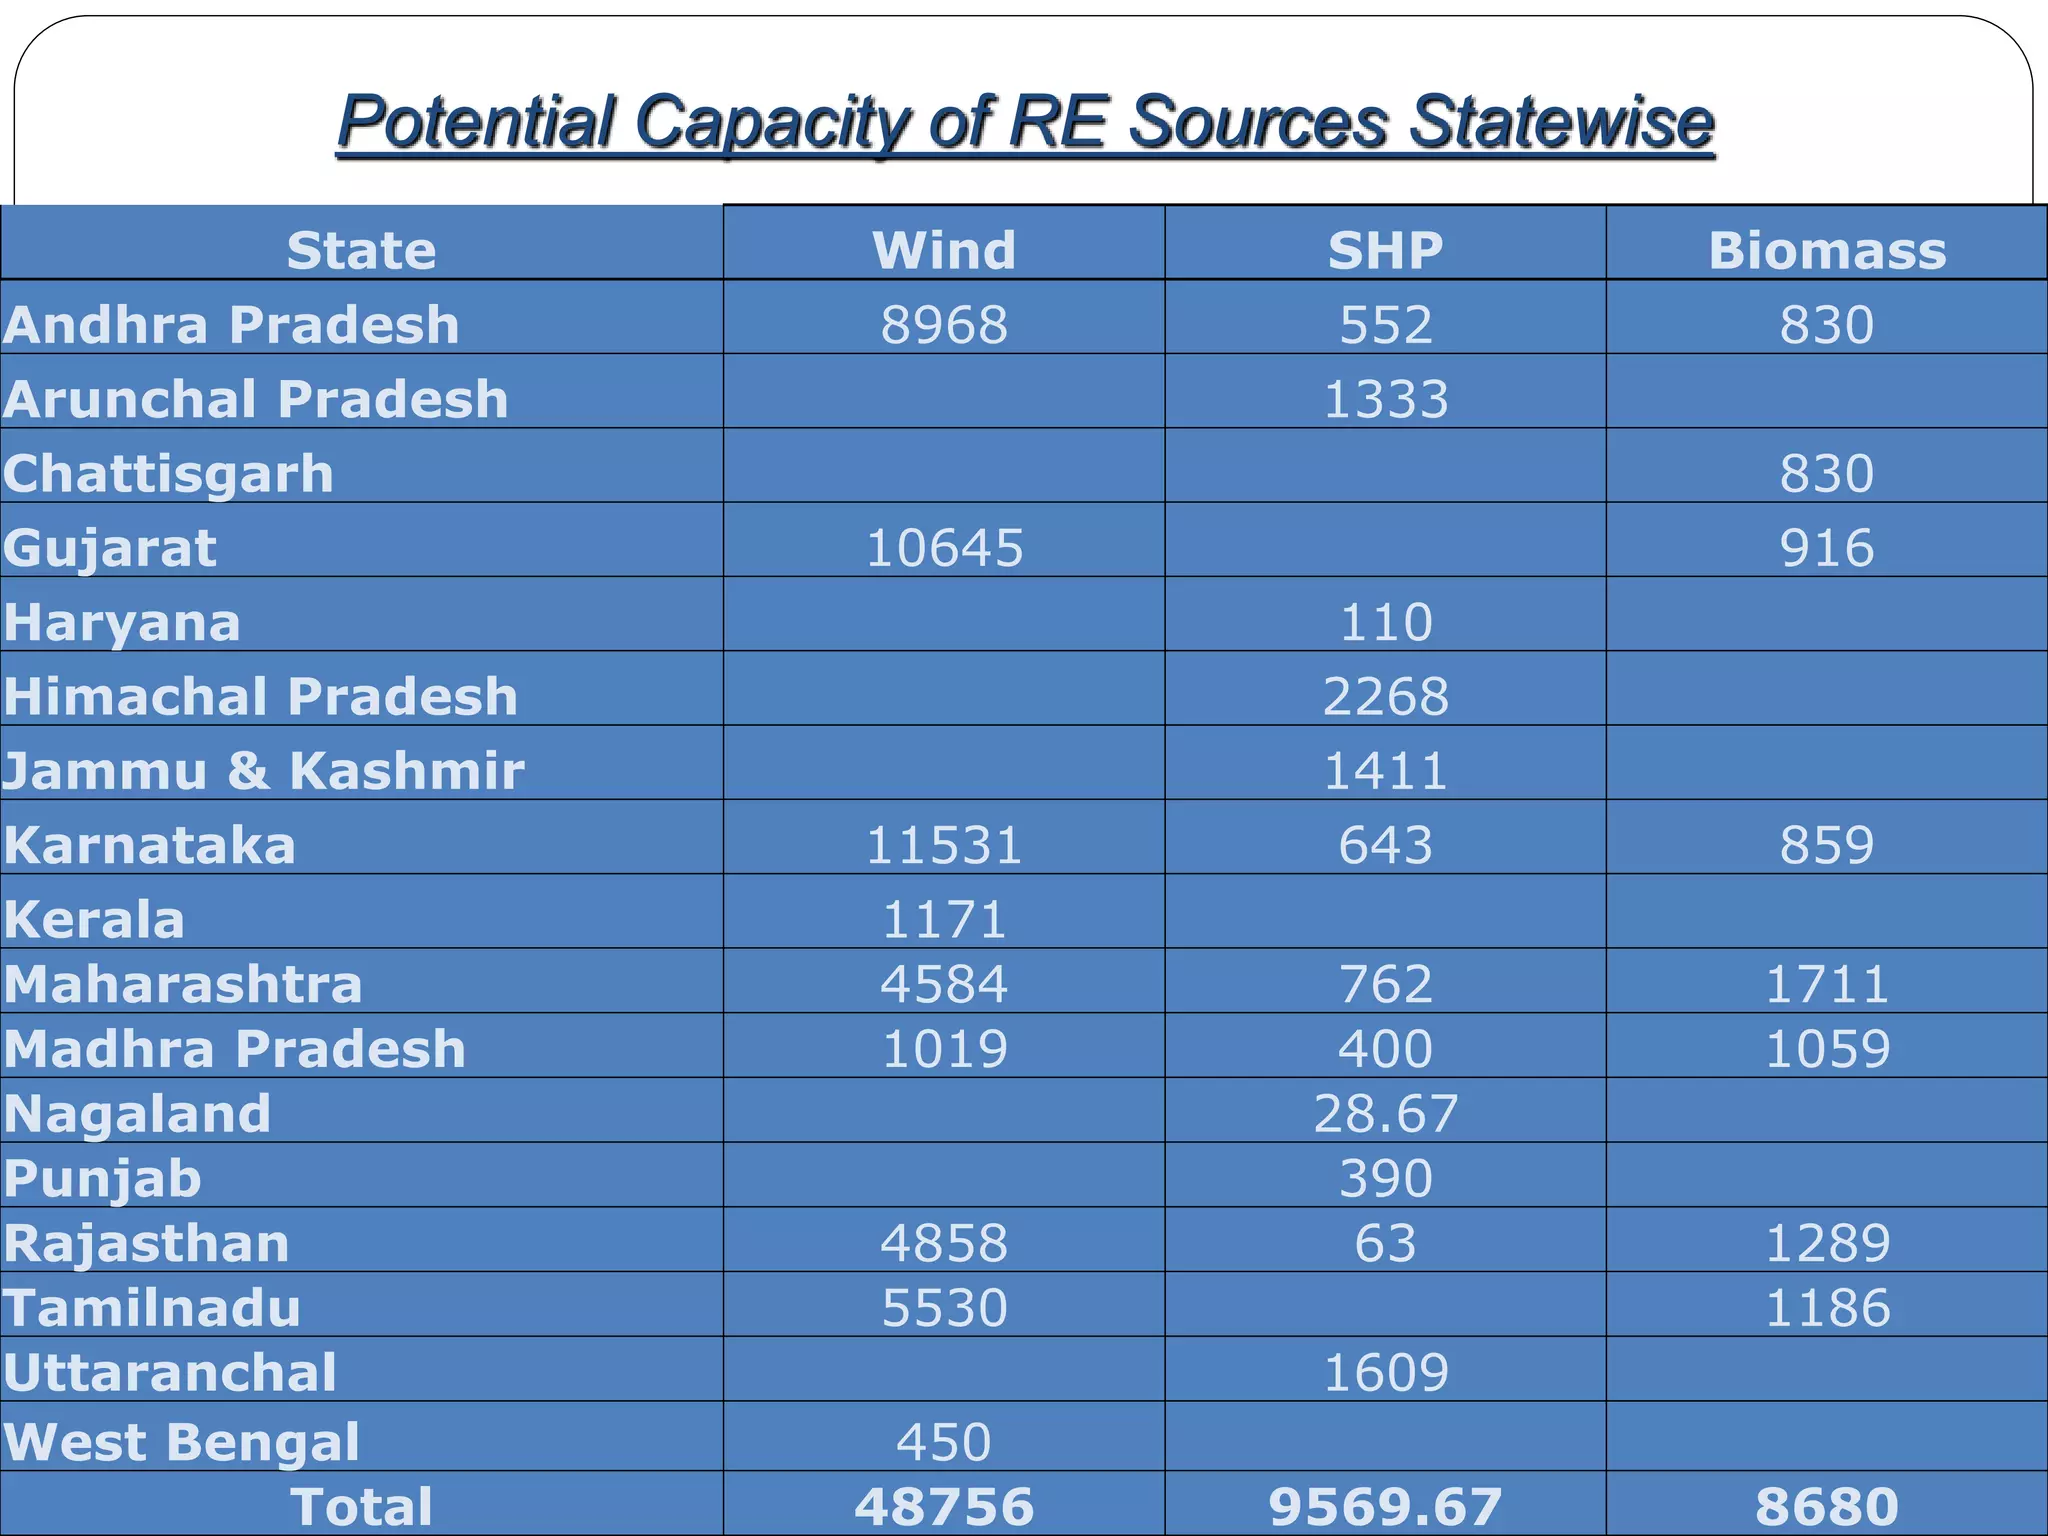
2. 10/1/2023 ERLDC: POSOCO 2
Contents
• Indian Power Sector – At Present
- Factors compel us to worry
• Drivers for alternative Energy Source
– Legal provision
– Emerging Renewable Scenario
– International Position
– Wind and Solar potential in India
• Need for REC Mechanism
• Integration of Renewables
• Implementation of RRF
• Future Scenario
3. Region wise Installed Generating Capacity
Captive generating capacity as on 31st March 2011 = 34,445 MW
Source: CEA website
4. Thermal
Nuclear
Hydro
Renewables
NPTI, Bangalore
Installed capacity of power plants in India till 31st
December, 2013 was around 233 GW of which
• Thermal contribution is about 65.8%
• Nuclear provides 2.4% of electricity generated
• Hydro contribution is about 19.5% (Exploitable potential
60% at 84000 MW)
• Renewables –12.3%
8. Limited Fuels:
at present consumption levels
Crude oil will last only for
18 years.
Gas will last for 26 years.
Coal will be finished in
nearly 200 years.
Ever thought of a world
without gas and oil???
9. Factors which compel us to worry
• World got used to cheap oil
• Economy vulnerable to growing
imports
Volatility in
Prices: oil and
gas
• Imports from unstable parts of the
world
Energy
Security
• Emissions of criteria pollutants from
fossil fuel burning
Environmental
concerns:
10. Climate has changed and
continues to change..
– Global mean temperature has
increased 0 .5-1 o
F
– Global sea level has risen 4-10 inches
–Global precipitation over land has
increased 1%
– Projected temperature increase of 3.6 o
F
by 2100 (1.8-6.3 o
F)
– Projected sea level rise of 20 inches by
2100 (6-38 inches)
– Likely increase in precipitation intensity
11. Estimates indicate that approximately 80 percent of all
anthropogenic carbondioxide emissions currently come
from fossil fuel combustion.
Hence, WORLD ENERGY USE has emerged as the
center of the CLIMATE CHANGE DEBATE
14. Climate Impacts in South Asia
AFG BLD BHU IND PAK NEP MAL
Sea Level Rise - Very
High
- Modest Low - Very High
Glacier
Melt
High High High High High High --
Temp Increase Very
High
High Very
High
High High Very High Modest
Flooding
Worsens
? Very
High
Likely High High High High
(SLR)
Drought
More Frequent
? High
some
areas
? High Very
High
? Possible --
15.
16.
17. Drivers for Alternate energy sources
Oil crisis in 1970s.
Limited natural Resources (Oil, Coal).
Energy Security.
International mandate for development of CDM technologies and to
reduce Carbon/Sulpher/Green House Gas emissions, phase out
fossil fuel generation and develop alternate Energy sources.
IPCC(Inter-governmental Panel for Climate Change) under
UNEP(1998)
UNFCCC Rio De Janeiro 1992
Kyoto protocol 1997
Copenhagen Summit 2009
Indian initiatives
NAPCC (National Action Plan for Climate Change)
JNNSM (Jawaharlal Nehru National Solar Mission)
19. The Ex-President’s Message:
Independence
Cut down energy losses
Utilize technologies to provide
a diverse supply of
environmentally friendly energy
“We must achieve Energy
Independence by 2030”,
including a cut down in ALL
sectors
Increase the power generated
through renewable energy
sources from 5% to 25%
This is the nation’s “first and
highest priority”
Ex-President A.P.J. Abdul Kalam
(Rocket Scientist)
20. The Electricity Act, 2003 : Enabling provisions
Section 86(1)(e) : Specify Renewable Purchase
Obligation (RPO), grid connectivity
Section 61(h) : Tariff regulations to be guided by
promotion of renewable energy sources
Section 3 : National Electricity Policy, Tariff Policy
and Plan
Section 4 : National Policy permitting stand alone
systems including renewable sources of energy for
rural areas
21. The Electricity Act, 2003:
Section 86(1) (e)
The State Commission shall discharge the following
functions, namely:
“promote cogeneration and generation of electricity from
renewable sources of energy by providing suitable
measures for connectivity with the grid and sale of
electricity to any person, and also specify, for purchase of
electricity from such sources, a percentage of the total
consumption of electricity in the area of a distribution
licensee;”
22. The Electricity Act, 2003: Section 61(h)
The Appropriate Commission shall subject to
the provisions of this Act, specify the terms
and conditions for the determination of tariff,
and in doing so, shall be guided by the
following, namely:
(h) the promotion of co-generation and
generation of electricity from renewable
sources of energy
23. National Electricity Policy: 2005
• Urgent need for promotion of non-conventional and
renewable sources of energy.
• Efforts need to be made to reduce the capital cost of
such projects.
• Adequate promotional measures would have to be taken
for development of technologies and sustained growth of
these sources.
• SERCs to provide suitable measures for connectivity
with grid and fix percentage of purchase from
Renewable sources.
• Progressively such share of electricity need to be
increased.
24. Tariff Policy:2006
• Appropriate Commission shall fix RPO and
SERCs shall fix tariff.
• In future Discoms to procure Renewable Energy
through competitive bidding within suppliers
offering same type of RE.
• In long-term, RE technologies need to compete
with all other sources in terms of full costs.
25. National Action Plan on Climate Change (NAPCC), 2008
National level target for RE Purchase
5% of total grid purchase in 2010, to be increased by 1%
each year for 10 years: 15% by 2020.
SERCs may set higher target. Appropriate authorities may
issue certificates that procure RE in excess of the national
standard.
Such certificates may be tradable, to enable utilities falling
short to meet their RPO.
RE generation capacity needed: From 25000 to 45000
MW by 2015.
26. National Solar Mission, 2009
1000
4000
20000
200 1000 2000
0
5000
10000
15000
20000
25000
Phase 1 Phase 2 Phase 3
Grid solar power (MW)
Off-grid Applicationa (MW)
Mission aims to achieve grid tariff parity by 2022 through
Bundling of solar power with un-allocated quota of central
stations by NVVNL for resale to utilities
To deploy 20 million solar lighting systems for rural areas by
2022
Large scale utilization
R&D, Local manufacturing
In addition,100 MW capacity distributed small grid
connected power plants during Phase - 1.
7
15
20
0
5
10
15
20
25
Phase-1
(2010-13)
Phase-2
(2013-17)
Phase-3
(2017-22)
Solar Thermal Collectors (Million
Square Meters)
MW
27. RE Development in India
0
5000
10000
15000
20000
25000
30000
MW
Wind Biomass Small Hydro Waste to Energy Solar
Policy Announcement
by Central Government Policy on Hydro Power
Development
Enactment of
Electricity Act, 2003
NAPCC, JNNSM,
GBI
Emergence of
Electricity Regulatory
Commissions
Enactment of National
Tariff Policy
CERC RE Tariff
Regulations
REC
Regulations
Policy and regulatory intervention is essential to promote
renewable energy
28. Various types of Renewable Energy
• Wind
– On shore
– Off shore
• Solar
– Solar PV (Photo Voltaic, Concentrated PhotoVoltaic)
– Solar Thermal (Solar Concentrated, Parabolic trough/dish, Fresnel
collector, Heliostat & Solar Tower receiver, Solar updraft receiver)
• Small Hydel (upto 25 MW)
• Biomass
– Bagasse (the dry fibrous waste that is left after sugarcane has been
processed)
– rice husk, cotton stalk, mustard stalk, groundnut shell, coconut fronds,
waste cotton stalks, roots of trees, cane trash, poultry litter etc.)
• Co - generation
• Municipal Solid waste
• Geo -Thermal
• Hydro kinetics
– Tidal power
– Wave technology
31. Renewable Energy sources (RES)
Renewable Energy Installed Capacity Potential
Wind Power 16179.00 48561
Small Hydro Power 3300.13 14292
Biomass Power 1142.60 8680
Bagasse Cogeneration 1952.53 5000
Waste to Power 73.66 7000
Solar Power (SPV) 481.48 200000
Total 23129.40 283533
Capacities in MW as on
31.01.12
Source: MNRE
32. Wind Power Potential Andhra
Pradesh
19%
Gujarat
22%
Karnataka
24%
Madhya
Pradesh
2%
Maharasht
ra
9%
Rajasthan
10%
Tamil
Nadu
11%
Kerala
2% Orissa
1%
Sl.No. Sources Potential in MW
1 Andhra Pradesh 8968
2 Gujarat 10645
3 Karnataka 11531
4 Madhya Pradesh 1019
5 Maharashtra 4584
6 Rajasthan 4858
7 Tamil Nadu 5530
8 Kerala 1171
9 Orissa 255
48561
Total
State Wise -Wind potential in India
33. Wind Energy Installed Capacity, INDIA
10240MW
0
2000
4000
6000
8000
10000
12000
1992 1994 1996 1998 2000 2002 2004 2006 2008 2010
INSTALLED
CAPACITY
(MW)
YEAR
34. Growth of Wind Capacity(By end 2012)
2,599
5,912
12,210
25,104
44,733
62,733
75,564
11,603
16,819
25,170
35,159
40,200
46,919
60,007
20,622
22,247
23,903
25,777
27,214
29,060
31,332
11,630
15,145
16,740
19,149
20,676
21,674
22,796
6,270
7,850
9,587
10,925
13,064
16,084
18,421
0
10,000
20,000
30,000
40,000
50,000
60,000
70,000
80,000
2006 2007 2008 2009 2010 2011 2012
IC
in
MW
China United States Germany Spain India
35. Criteria for Site Selection
SITE SELECTION – PLAIN TERRAINS
SITE SELECTION – HILLY TERRAINS
High annual average Wind Speed ( > 7
m/sec.)
Altitude of the proposed site.
Nature of Ground (soil for proper foundation
/ civil work ).
Favorable environmental condition to
prevent corrosion & not prone to cyclone.
Availability of electrical infrastructure for
evacuation of electricity generated .
36. Solar in India : Potential & Prospects
1. India receives the highest global solar radiation on a
horizontal surface. According to solar energy experts, India
has considerable scope for solar energy production. India is
bestowed with solar irradiation ranging from 4-7 kWh/
sq. m/ day across the country.
2. The desert areas in India have the solar radiation required for
CSP(concentrating solar power technology) production. A 60
km x 60 km area can produce 1,00,000 MW of power. India
has a desert area of 2,08,110 Sq Kms in Rajasthan and
Gujarat. Even if India uses only 15,000 Sq. Kms of the
desert, it can produce 3,00,000 MW of power.
3. Government of India is currently envisaging large-scale
expansion of solar power capacity by 2022.
37. Country-wise Solar PV installed Capacity
32,509
16,987
8,043 7,665
6,704
4,214 3,843
2,291 1,831 1,427
0
5,000
10,000
15,000
20,000
25,000
30,000
35,000
Germany Italy China United
States
Japan Spain France Australia United
Kingdom
India
IC
(MW)
38. Tidal energy & India
Long coastline offers huge potential.
Identified tidal power potential: 9000 MW
Need to be utilized with hydel power plants.
India predominantly agricultural
country.
Annual production of agro-forest
and processing residues: 350 million
tons.
Power generation potential > 22,000
MW
Advantages:
Decentralized generation: close to
rural load centers.
Technology reasonably well
developed
Biomass
Feedstock Examples Potential Installed
Agro-forest
residues
Wood
chips,
mulberry,
coconut
shells
17,000 MW 50 MW
Processing
residues
Rice husk,
sugarcane
bagasse
5,000 MW 1000 MW
39. Geothermal energy & India
Yet to be tapped .
Potential capacity over 10000 MW .
Puga valley in Ladakh has an experimental 1
KW generator in geothermal field .
North-western Himalayas & Western coast
are considered Geothermal areas.
40. Typical arrangement of an Small Hydro Power station
SHP station on a canal SHP station on a river
Small Hydro & India
Potential capacity over 10000 MW.
Non polluting, high prime mover efficiency, low operational cost
Availabilty - seasonal and intermittent
41. Integration issues of Wind
• Planning criterion for RE
• Variability and Intermittency
• Forecasting and Scheduling
• SCADA / telemetry
• Network related Problems and Congestion
• Protection
• Commercial mechanism implementation
42. Planning Transmission system for
RE
At lower penetration RE treated as
an energy rather than capacity
addition.
As the penetration of the RE
increases, RE treated in terms of
MW capacity.
Network development and O&M
up to the pooling station by the wind
developer.
43. TN WIND GENERATION
TAMILNADU WIND GENERATION ON MAXIMUM GENERATION DAY
59.61 MU on 16-07-2010
2000
2500
3000
0:00
1:00
2:00
3:00
4:00
5:00
6:00
7:00
8:00
9:00
10:00
11:00
12:00
13:00
14:00
15:00
16:00
17:00
18:00
19:00
20:00
21:00
22:00
23:00
0:00
TIME ?
Data taken from SCADA TIME →
(28% of Energy)
SR Maximum Wind -17.08.10 AT 18:59 HRS
% of Wind in SR I/C – 17%
% of Wind Gen in SR Demand Met – 14.9 %
% of Wind in TN I/C – 39.4 %
% of Wind Gen in TN Demand - 31.3 %
Intermittancy: not continuously available
Variability : variable in magnitude
Uncertainity : Variations may not be as Expected
44. MAX WIND DAY:KARNATAKA 13/07/2011
– 22.31 MU GENERATED,
15.7% OF TOTAL STATE CONSUMPTION
48.5
49
49.5
50
50.5
51
0
200
400
600
800
1000
1200
1400
1600
0 2 4 6 8 10 12 14 16 18 20 22 0
MW
WIND GENERATION IN MW
FREQUENCY
MAX: 1400 MW, MIN 1050 MW
45. Need for
Accurate
Forecasting
Maintain Load
Generation
balance
Increasing
penetration of
RE
Absence of
spinning
reserve
Perennial
deficits in
Generation
Effect of
Higher
Intermittency
of RE
Thrust on
Market
participation
of RE
Ensure level
playing field
to Buyers of
RE
Favorable
policy to RE
vis-à-vis
Accountability
of RE gen
Forecasting
with accuracy
of 70% for
wind– IEGC
mandate
Day ahead
forecast for 15
min time
blocks
46. IEGC mandates…
Wind farms shall have communication channel which
is continuously available to system operator.
Data Acquisition System facility shall be provided for
transfer of information to concerned SLDC and RLDC
WIND MILLS TELEMETRY
TYPICAL LAYOUT
110 kV Bus
33kV or
11 kV Bus
LOADS
Untelemetered
X MW injected
to 110kV Bus
(Telemetered)
WIND MILLS
47. SCADA and telemetry
Due to dispersed and distributed nature of the wind
generation across a large geo-graphical area, telemetering
the data is a challenge
Real time data from wind turbines is metered and shall be
transmitted to the local control centre of each wind farm.
The net injection of the wind farm is also measured at the
pooling station and transmitted to the Area control centre
(SubLDC), which in turn is re-transmitted to SLDC
As of now only partial data is transmitted to RLDC.
Sometimes manually replaced data is sent
48. Protection requirements for RE
Reactive Compensation (to operate in the pf
range 0.95 lag to 0.95 lead)
Fault Ride Through (FRT) – A capability of a wind
generator s to be able to operate through periods
of lower grid voltage.
Preferred configuration of the grid connecting transformer
is delta connection on the wind farm side and grounded
wye connection on the transmission system (grid) side to
block the harmonics current and to detect the earth faults
on the grid side .
49. Efforts of Indian Regulators and policy
makers
• Creation of Power Market post ABT, Open Access, Power
Exchange
• ‘Cost-plus’ return on investment thro’ preferential tariff or
Feed In Tariff (FIT)
• Solar power is exempted from sharing transmission charges
and losses
• Accelerated Depreciation (AD) or Generation Based Incentive
(GBI) @50 paise/unit
• Capital/ interest subsidy, concessional excise and customs
duties etc.
• UI upto +/-30% socialised
50. • RE Sources Not evenly distributed across India
• Inhibits the SERCs of potential deficit states from high
RPO
• Potential rich states
• Already set higher RPO, still avenues left for new
plants
• Very high cost of generation from RE sources
(discourages local DISCOM to purchase beyond RPO)
• REC to address the mismatch between availability of
RE sources and the requirement of RPO
51. Government Initiative: National Action Plan
on Climate Change (NAPCC), 2008
10/1/2023
National level target for RE Purchase
5%of total grid purchase in 2010, to be increased by 1% each year
for 10 years: 15% by 2020
SERCs may set higher target
Appropriate authorities may issue certificates that procure RE in excess of
the national standard
Such certificates may be tradable, to enable utilities falling short to
meet their RPO
RE generation capacity needed: From 18000 to 45500 MW by FY2015
52. Eligibility of Wind Farms/Solar Generators for REC
Wind farms – 10 MW and above and Solar plants -
5MW and above, connected at 33 KV and above :
• Connectivity details to concerned SLDC/RLDC
• Declaration about agreement if any
• Provide details of Contracts and Contracted path to
the concerned SLDC RLDCRPC
• Generation forecast with periodic updates to
SLDC/RLDC
• To provide Data Acquisition System (DAS) facility to
SLDC/RLDC
54. Options for DISCOMs to fulfill RPO
RPO
Buy Power
@ Preferential Tariff
Buy REC
What is RPO ?
Obligation to purchase Renewable Energy directly through power purchase
or indirectly through purchase of Renewable energy Certificate
Renewable Purchase Obligation specified by SERC. It will :
Incentivise the RE generator
Reduce the Geographical imbalances in RE spread
55. NLDC 55
Electricity
Component
* Self consumption by CPPs based upon renewable generation are eligible for RECs
RE Generation*
Sale at
Preferential
Tariff
REC Component
Obligated Entities /
Voluntary Buyers
Distribution Company
/ Third Party Sale/
Power Exchange
Obligated Entities
58. Non Solar
Capacity
(MW) Number
Wind 1054 254
Small Hydro 90 14
Bio Mass 525 51
Bio Fuel
Cogeneration 618 50
Others 2 1
Total 2288 370
Solar
Capacity
(MW) Number
Solar Thermal 0 0
Solar PV 8.5 1
Total 8.5 1
Accredited Capacity ~ 2297 MW
59. Non Solar
Capacity
(MW) Number
Wind 900 204
Small Hydro 88 13
Bio Mass 446 38
Bio Fuel
Cogeneration 606 49
Urban &
Municipal Waste 0 0
Total 2039 304
Solar
Capacity
(MW) Number
Solar Thermal 0 0
Solar PV 0 0
Total 0 0
Registered Capacity Surpassed CERC estimate of most optimistic
scenario in REC Fees and Charges Order
Registered Capacity ~ 2039 MW
60.
61.
62. Measures under implementation stage :
• Forecasting and Scheduling of Grid connected wind and Solar
generators
• Eligible generators would be required to forecast their generation
with a minimum accuracy of + 30%.
• Any deviation upto + 30% will not have any cost implication to the
Renewable Energy generator.
• The RE generator can enter in to contract to supply power to any
entity located any where in the country under Short Term Open
Access at a price negotiated bilaterally.
63. Approach thro’ Renewable Regulatory Fund:
• Achieve better generation prediction using weather
forecasting tools
• Immune wind generators from paying deviation in UI
charges up to a certain level of variation
• No UI charges payable/receivable by Solar Generator
• Socialise the deviation charges arrived due to variations
amongst different state utilities
• Develop a self sustaining mechanism towards better
acceptance of intermittent generation
64. Conclusion
•With Larger Grid interconnection …
The variability can be better handled.
•With Forecasting…
Operational planning can be better
executed
•With Scheduling ….
Accountability is induced
•With REC mechanism and trading across
seams…
RE will be an attractive business