Downloaded 77 times


![2.2 HYDRO POWER
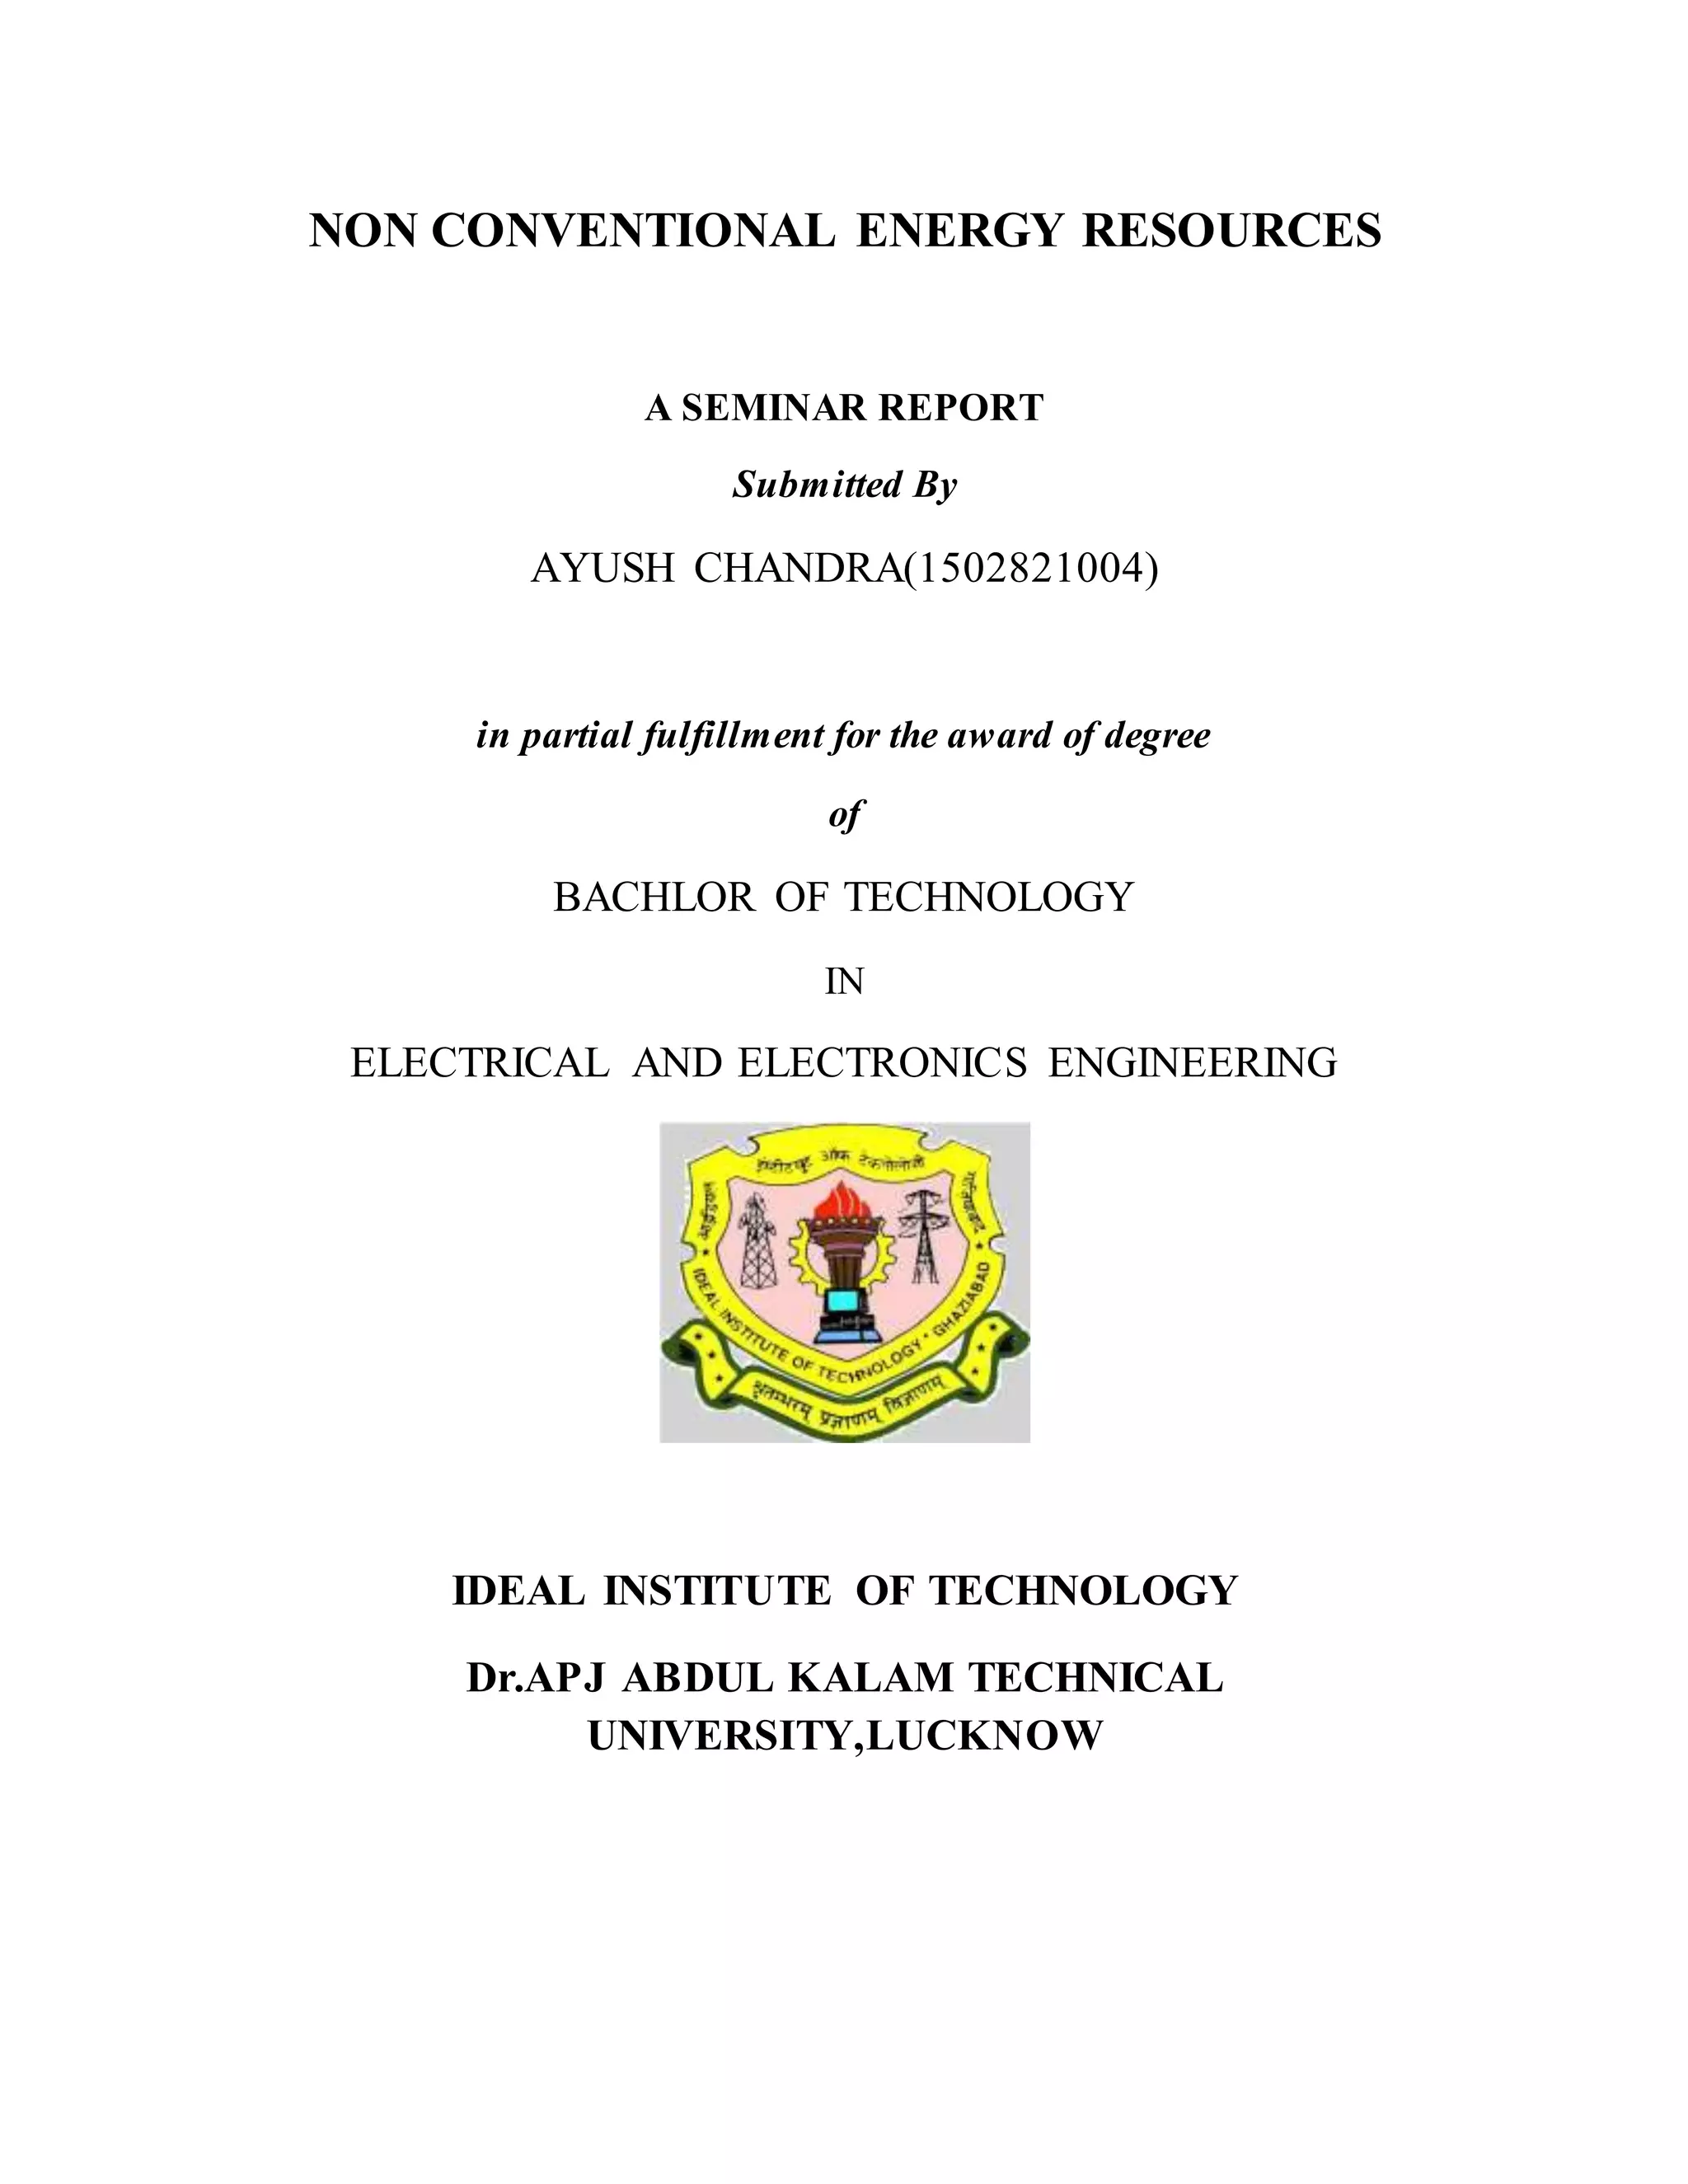
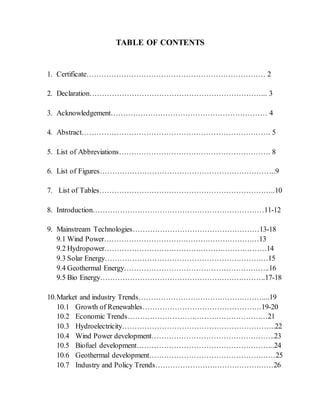
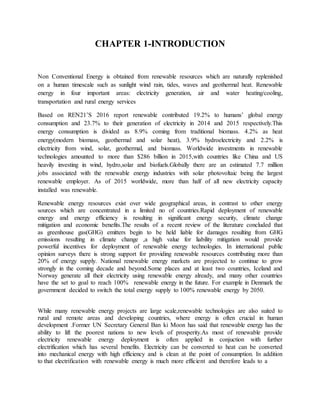
In 2015 hydropower generated 16.6% of the worlds total electricity and 70% of all renewable
electricity. Since water is about 800 times denser than air, even a slow flowing stream of water,
or moderate sea swell, can yield considerable amounts of energy. There are many forms of water
energy:
Historically hydroelectric power came from constructing large hydroelectric dams and
reservoirs, which are still popular in third world countries. The largest of which is
the Three Gorges Dam(2003) in China and the Itaipu Dam(1984) built by Brazil and
Paraguay.
Small hydro systems are hydroelectric power installations that typically produce up to 50
MW of power. They are often used on small rivers or as a low impact development on
larger rivers. China is the largest producer of hydroelectricity in the world and has more
than 45,000 small hydro installations.[46]
Run-of-the-river hydroelectricity plants derive kinetic energy from rivers without the
creation of a large reservoir. This style of generation may still produce a large amount of
electricity, such as the Chief Joseph Dam on the Columbia river in the United States.
Hydropower is produced in 150 countries, with the Asia-Pacific region generating 32 percent of
global hydropower in 2010. For countries having the largest percentage of electricity from
renewables, the top 50 are primarily hydroelectric. China is the largest hydroelectricity producer,
with 721 terawatt-hours of production in 2010, representing around 17 percent of domestic
electricity use. There are now three hydroelectricity stations larger than 10 GW: the Three
Gorges Dam in China, Itaipu Damacross the Brazil/Paraguay border, and Guri Dam in
Venezuela.
Wave power, which captures the energy of ocean surface waves, and tidal power, converting the
energy of tides, are two forms of hydropower with future potential; however, they are not yet
widely employed commercially. A demonstration project operated by the Ocean Renewable
Power Company on the coast of Maine, and connected to the grid, harnesses tidal power from
the Bay of Fundy, location of world's highest tidal flow. Ocean thermal energy conversion,
which uses the temperature difference between cooler deep and warmer surface waters, has
currently no economic feasibility.
Figure 2.2 The Three Gorges Dam on the Yangtze River in China](https://image.slidesharecdn.com/nonconventionalenergyresources-180417080627/85/Non-conventional-energy-resources-seminar-report-14-320.jpg)
![2.4 GEOTHERMAL ENERGY
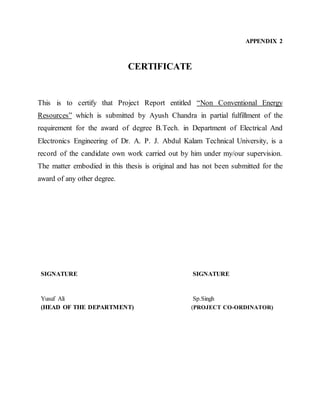
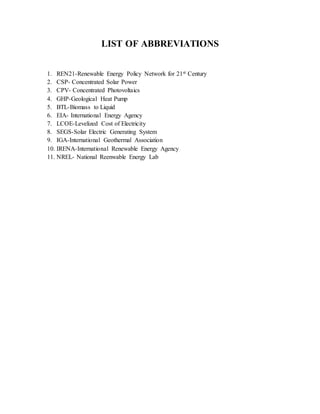
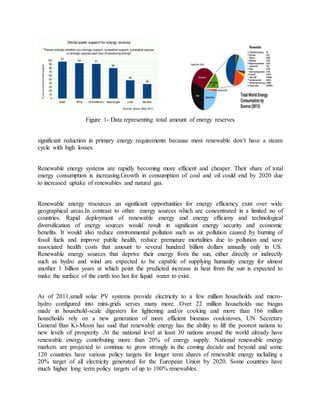
High Temperature Geothermal energy is from thermal energy generated and stored in the Earth.
Thermal energy is the energy that determines the temperature of matter. Earth's geothermal
energy originates from the original formation of the planet and from radioactive decay of
minerals (in currently uncertain but possibly roughly equal proportions). The geothermal
gradient, which is the difference in temperature between the core of the planet and its surface,
drives a continuous conduction of thermal energy in the form of heat from the core to the
surface. The adjective geothermal originates from the Greek roots geo, meaning earth,
and thermos, meaning heat.
The heat that is used for geothermal energy can be from deep within the Earth, all the way down
to Earth's core – 4,000 miles (6,400 km) down. At the core, temperatures may reach over
9,000 °F (5,000 °C). Heat conducts from the core to surrounding rock. Extremely high
temperature and pressure cause some rock to melt, which is commonly known as magma.
Magma convects upward since it is lighter than the solid rock. This magma then heats rock and
water in the crust, sometimes up to 700 °F (371 °C).
From hot springs, geothermal energy has been used for bathing since Paleolithic times and for
space heating since ancient Roman times, but it is now better known for electricity generation.[58]
Low Temperature GeothermaL refers to the use of the outer crust of the earth as a Thermal
Battery to facilitate Renewable thermal energy for heating and cooling buildings, and other
refrigeration and industrial uses. In this form of Geothermal, a Geothermal Heat
Pump and Ground-coupled heat exchanger are used together to move heat energy into the earth
(for cooling) and out of the earth (for heating) on a varying seasonal basis. Low temperature
Geothermal (generally referred to as "GHP") is an increasingly important renewable technology
because it both reduces total annual energy loads associated with heating and cooling, and it also
flattens the electric demand curve eliminating the extreme summer and winter peak electric
supply requirements. Thus Low Temperature Geothermal/GHP is becoming an increasing
national priority with multiple tax credit support and focus as part of the ongoing movement
toward Net Zero Energy. New York City has even just passed a law to require GHP anytime is
shown to be economical with 20 year financing including the Socialized Cost of Carbon.
Figure2.4 Nasjeveller Geothermal Power Plant in Iceland](https://image.slidesharecdn.com/nonconventionalenergyresources-180417080627/85/Non-conventional-energy-resources-seminar-report-16-320.jpg)
![2.5 BIO ENERGY
Biomass is biological material derived from living, or recently living organisms. It most often
refers to plants or plant-derived materials which are specifically called lignocellulosic
biomass. As an energy source, biomass can either be used directly via combustion to produce
heat, or indirectly after converting it to various forms of biofuel. Conversion of biomass to
biofuel can be achieved by different methods which are broadly classified
into: thermal, chemical, and biochemical methods. Wood remains the largest biomass energy
source today; examples include forest residues – such as dead trees, branches and tree stumps –,
yard clippings, wood chips and even municipal solid waste. In the second sense, biomass
includes plant or animal matter that can be converted into fibers or other industrial chemicals,
including biofuels. Industrial biomass can be grown from numerous types of plants,
including miscanthus, switchgrass, hemp, corn, poplar, willow, sorghum, sugarcane, bamboo,[66]
and a variety of tree species, ranging from eucalyptus to oil palm (palm oil).
Plant energy is produced by crops specifically grown for use as fuel that offer high biomass
output per hectare with low input energy. Some examples of these plants are wheat, which
typically yield 7.5–8 tonnes of grain per hectare, and straw, which typically yield 3.5–5 tonnes
per hectare in the UK. The grain can be used for liquid transportation fuels while the straw can
be burned to produce heat or electricity. Plant biomass can also be degraded
from cellulose to glucose through a series of chemical treatments, and the resulting sugar can
then be used as a first generation biofuel.
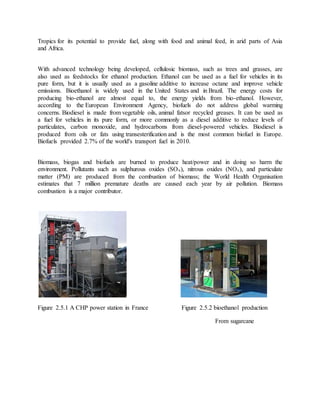
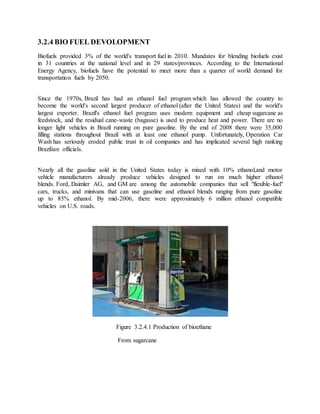
Biomass can be converted to other usable forms of energy like methane gas or transportation
fuels like ethanol and biodiesel. Rotting garbage, and agricultural and human waste, all release
methane gas – also called landfill gas or biogas. Crops, such as corn and sugarcane, can be
fermented to produce the transportation fuel, ethanol. Biodiesel, another transportation fuel, can
be produced from left-over food products like vegetable oils and animal fats. Also, biomass to
liquids (BTLs) and cellulosic ethanol are still under research. There is a great deal of research
involving algal fuel or algae-derived biomass due to the fact that it's a non-food resource and can
be produced at rates 5 to 10 times those of other types of land-based agriculture, such as corn and
soy. Once harvested, it can be fermented to produce biofuels such as ethanol, butanol, and
methane, as well as biodiesel and hydrogen. The biomass used for electricity generation varies
by region. Forest by-products, such as wood residues, are common in the United States.
Agricultural waste is common in Mauritius (sugar cane residue) and Southeast Asia (rice husks).
Animal husbandry residues, such as poultry litter, are common in the United Kingdom.
Biofuels include a wide range of fuels which are derived from biomass. The term
covers solid, liquid, and gaseous fuels.Liquid biofuels include bioalcohols, such as bioethanol,
and oils, such as biodiesel. Gaseous biofuels include biogas, landfill gas and synthetic
gas. Bioethanol is an alcohol made by fermenting the sugar components of plant materials and it
is made mostly from sugar and starch crops. These include maize, sugarcane and, more
recently, sweet sorghum. The latter crop is particularly suitable for growing in dryland
conditions, and is being investigated by International Crops Research Institute for the Semi-Arid](https://image.slidesharecdn.com/nonconventionalenergyresources-180417080627/85/Non-conventional-energy-resources-seminar-report-17-320.jpg)
![CHAPTER 3-MARKET AND INDUSTRY TRENDS
3.1 GROWTHOF RENEWABLES
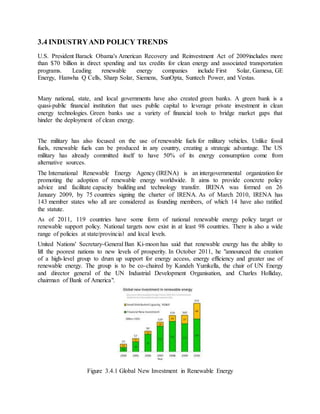
From the end of 2004, worldwide renewable energy capacity grew at rates of 10–60% annually
for many technologies. In 2015 global investment in renewables rose 5% to $285.9 billion,
breaking the previous record of $278.5 billion in 2011. 2015 was also the first year that saw
renewables, excluding large hydro, account for the majority of all new power capacity (134 GW,
making up 53.6% of the total). Of the renewables total, wind accounted for 72 GW and solar
photovoltaics 56 GW; both record-breaking numbers and sharply up from 2014 figures (49 GW
and 45 GW respectively). In financial terms, solar made up 56% of total new investment and
wind accounted for 38%.
Projections vary. The EIA has predicted that almost two thirds of net additions to power capacity
will come from renewables by 2020 due to the combined policy benefits of local pollution,
decarbonisation and energy diversification. Some studies have set out roadmaps to power 100%
of the world’s energy with wind, hydroelectric and solar by the year 2030.
According to a 2011 projection by the International Energy Agency, solar power generators may
produce most of the world's electricity within 50 years, reducing the emissions of greenhouse
gases that harm the environment. Cedric Philibert, senior analyst in the renewable energy
division at the IEA said: "Photovoltaic and solar-thermal plants may meet most of the world's
demand for electricity by 2060 – and half of all energy needs – with wind, hydropower and
biomass plants supplying much of the remaining generation". "Photovoltaic and concentrated
solar power together can become the major source of electricity", Philibert said.
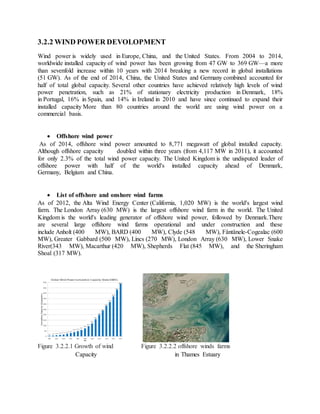
In 2014 global wind power capacity expanded 16% to 369,553 MW. Yearly wind energy
production is also growing rapidly and has reached around 4% of worldwide electricity
usage,[83] 11.4% in the EU,[84] and it is widely used in Asia, and the United States. In 2015,
worldwide installed photovoltaics capacity increased to 227 gigawatts (GW), sufficient to supply
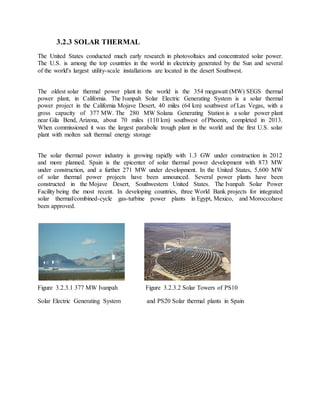
1 percent of global electricity demands. Solar thermal energy stations operate in the USA and
Spain, and as of 2016, the largest of these is the 392 MW Ivanpah Solar Electric Generating
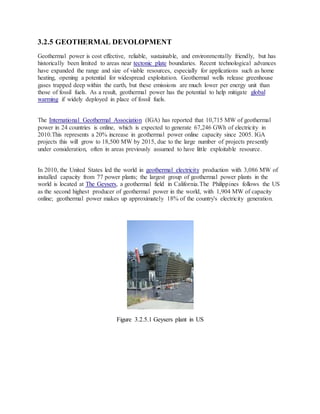
System in California. The world's largest geothermal power installation is The Geysers in
California, with a rated capacity of 750 MW. Brazil has one of the largest renewable energy
programs in the world, involving production of ethanol fuel from sugar cane, and ethanol now
provides 18% of the country's automotive fuel. Ethanol fuel is also widely available in the USA.](https://image.slidesharecdn.com/nonconventionalenergyresources-180417080627/85/Non-conventional-energy-resources-seminar-report-19-320.jpg)
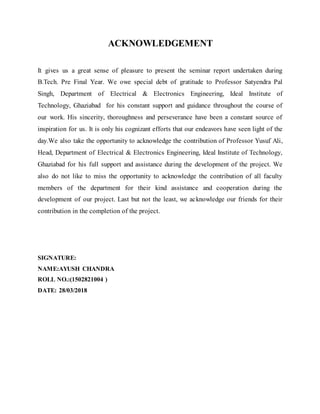
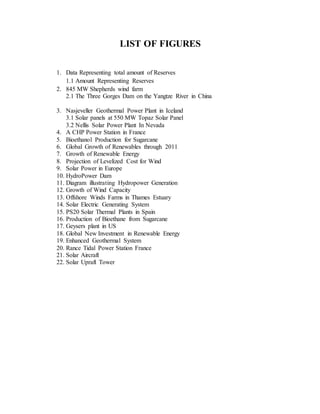
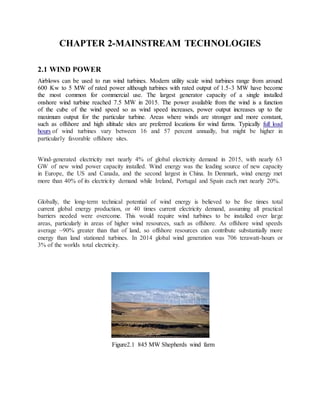
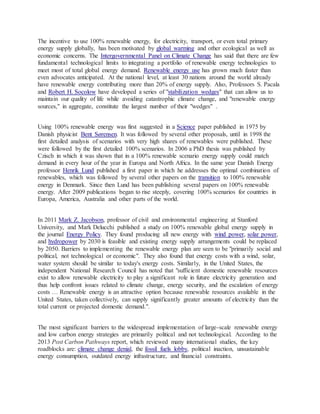
![Selected renewable energy global
indicators
2008 2009 2010 2011 2012 2013 2014 2015 2016
Investment in new renewable capacity
(annual) (109
USD)[88] 182 178 237 279 256 232 270 285 241
Renewables power capacity (existing)
(GWe)
1,140 1,230 1,320 1,360 1,470 1,578 1,712 1,849 2,017
Hydropower capacity (existing)
(GWe)
885 915 945 970 990 1,018 1,055 1,064 1,096
Wind power capacity (existing)
(GWe)
121 159 198 238 283 319 370 433 487
Solar PV capacity (grid-connected)
(GWe)
16 23 40 70 100 138 177 227 303
Solar hot water capacity (existing)
(GWth)
130 160 185 232 255 373 406 435 456
Ethanol production (annual)
(109
litres)
67 76 86 86 83 87 94 98 98.6
Biodiesel production (annual)
(109
litres)
12 17.8 18.5 21.4 22.5 26 29.7 30 30.8
Countries with policy targets
for renewable energy use
79 89 98 118 138 144 164 173 176
Source: The Renewable Energy Policy Network for the 21st Century (REN21)–Global Status ReporT
Figure3.1.1Global Growth of Renewables Figure 3.1.2 Growth of Renewable
through 2011 Energy](https://image.slidesharecdn.com/nonconventionalenergyresources-180417080627/85/Non-conventional-energy-resources-seminar-report-20-320.jpg)

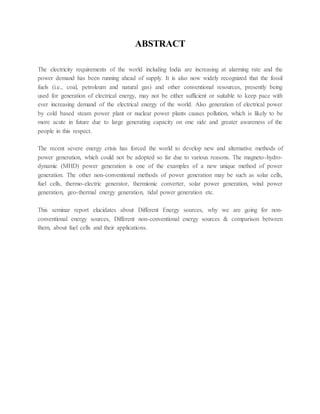
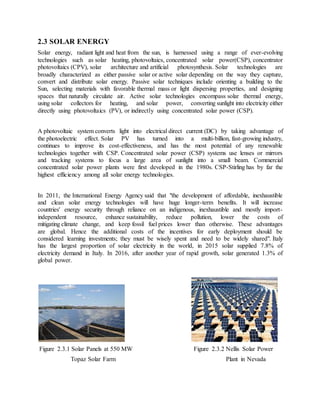
![3.2.1 HYDROELECTRICITY
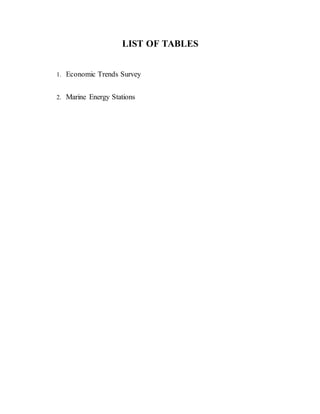
Only a quarter of the worlds estimated hydroelectric potential of 14,000 TWh/year has been
developed, the regional potentials for the growth of hydropower around the world are, 71%
Europe, 75% North America, 79% South America, 95% Africa, 95% Middle East, 82% Asia
Pacific. However, the political realities of new reservoirs in western countries, economic
limitations in the third world and the lack of a transmission system in undeveloped areas, result
in the possibility of developing 25% of the remaining potential before 2050, with the bulk of that
being in the Asia Pacific area. There is slow growth taking place in Western counties, but not in
the conventional dam and reservoir style of the past. New projects take the form of run-of-the-
river and small hydro, neither using large reservoirs.
It is popular to repower old dams thereby increasing their efficiency and capacity as well as
quicker responsiveness on the grid.] Where circumstances permit existing dams like the Russell
Dam built in 1985 may be updated with "pump back" facilities for pumped-storage which is
useful for peak loads or to support intermittent wind and solar power. Countries with large
hydroelectric developments like Canada and Norway are spending billions to expand their grids
to trade with neighboring countries having limited hydro.
Figure3.2.1.1 Hydro Power Dam Figure 3.2.1.2 Diagram illustrating
Hydropower Generation](https://image.slidesharecdn.com/nonconventionalenergyresources-180417080627/85/Non-conventional-energy-resources-seminar-report-22-320.jpg)
![CHAPTER 4-EMERGING TECHNOLOGIES
Other renewable energy technologies are still under development, and include cellulosic
ethanol, hot-dry-rock geothermal power, and marine energy. These technologies are not yet
widely demonstrated or have limited commercialization. Many are on the horizon and may have
potential comparable to other renewable energy technologies, but still depend on attracting
sufficient attention and research, development and demonstration (RD&D) funding.[154]
There are numerous organizations within the academic, federal, and commercial sectors
conducting large scale advanced research in the field of renewable energy. This research spans
several areas of focus across the renewable energy spectrum. Most of the research is targeted at
improving efficiency and increasing overall energy yields. Multiple federally supported research
organizations have focused on renewable energy in recent years. Two of the most prominent of
these labs are Sandia National Laboratories and the National Renewable Energy
Laboratory (NREL), both of which are funded by the United States Department of Energy and
supported by various corporate partners. Sandia has a total budget of $2.4 billion while NREL
has a budget of $375 million.
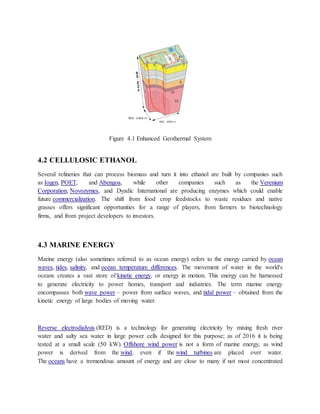
4.1 ENHANCED GEOTHERMALSYSTEM
Enhanced geothermal systems (EGS) are a new type of geothermal power technologies that do
not require natural convective hydrothermal resources. The vast majority of geothermal energy
within drilling reach is in dry and non-porous rock.EGS technologies "enhance" and/or create
geothermal resources in this "hot dry rock (HDR)" through hydraulic stimulation. EGS and HDR
technologies, like hydrothermal geothermal, are expected to be baseload resources which
produce power 24 hours a day like a fossil plant.
Distinct from hydrothermal, HDR and EGS may be feasible anywhere in the world, depending
on the economic limits of drill depth. Good locations are over deep granitecovered by a thick (3–
5 km) layer of insulating sediments which slow heat loss. There are HDR and EGS systems
currently being developed and tested in France, Australia, Japan, Germany, the U.S. and
Switzerland. The largest EGS project in the world is a 25 megawatt demonstration plant
currently being developed in the Cooper Basin, Australia. The Cooper Basin has the potential to
generate 5,000–10,000 MW.](https://image.slidesharecdn.com/nonconventionalenergyresources-180417080627/85/Non-conventional-energy-resources-seminar-report-30-320.jpg)
![In May 2008, the Far Niente Winery in Oakville, California, pioneered the world's first
floatovoltaic system by installing 994 solar PV modules with a total capacity of 477 kW onto
130 pontoons and floating them on the winery's irrigation pond.Utility-scale floating PV farms
are starting to be built. Kyocera will develop the world's largest, a 13.4 MW farm on the
reservoir above Yamakura Dam in Chiba Prefecture using 50,000 solar panels. Salt-water
resistant floating farms are also being constructed for ocean use. The largest so far announced
floatovoltaic project is a 350 MW power station in the Amazon region of Brazil.
4.4 ARTIFICIAL PHOTOSYNTHESIS
Artificial photosynthesis uses techniques including nanotechnology to store solar
electromagnetic energy in chemical bonds by splitting water to produce hydrogen and then using
carbon dioxide to make methanol. Researchers in this field are striving to design molecular
mimics of photosynthesis that utilize a wider region of the solar spectrum, employ catalytic
systems made from abundant, inexpensive materials that are robust, readily repaired, non-toxic,
stable in a variety of environmental conditions and perform more efficiently allowing a greater
proportion of photon energy to end up in the storage compounds, i.e., carbohydrates (rather than
building and sustaining living cells). However, prominent research faces hurdles, Sun Catalytix a
MIT spin-off stopped scaling up their prototype fuel-cell in 2012, because it offers few savings
over other ways to make hydrogen from sunlight.
4.5 ALGAE FUELS
Producing liquid fuels from oil-rich varieties of algae is an ongoing research topic. Various
microalgae grown in open or closed systems are being tried including some system that can be
set up in brownfield and desert lands.
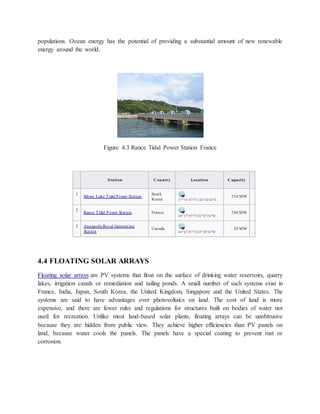
4.6 SOLAR AIRCRAFT
An electric aircraft is an aircraft that runs on electric motors rather than internal combustion
engines, with electricity coming from fuel cells, solar cells, ultracapacitors, power
beaming,[183] or batteries.
Currently, flying manned electric aircraft are mostly experimental demonstrators, though many
small unmanned aerial vehicles are powered by batteries. Electrically powered model
aircraft have been flown since the 1970s, with one report in 1957. The first man-carrying
electrically powered flights were made in 1973. Between 2015–2016, a manned, solar-powered
plane, Solar Impulse 2, completed a circumnavigation of the Earth.](https://image.slidesharecdn.com/nonconventionalenergyresources-180417080627/85/Non-conventional-energy-resources-seminar-report-33-320.jpg)
![REFERENCES
1. https://www.e-education.psu.edu/eme807/node/715
2. Ellabban, Omar; Abu-Rub, Haitham; Blaabjerg, Frede (2014). "Renewable energy
resources: Current status, future prospects and their enabling technology". Renewable
and Sustainable Energy Reviews. 39: 748–764 [749]. doi:10.1016/j.rser.2014.07.113.
3. ^ Jump up to:a b REN21 (2010). Renewables 2010 Global Status Report p. 15.
4. Jump up^ REN21, Global Status Report 2016. Retrieved 8th June 2016.
5. Jump up^ IRENA, Renewable energy and jobs, Annual review 2015, IRENA.
6. Jump up^ Vaughan, Adam (25 October 2016). "Renewables made up half of net
electricity capacity added last year" – via The Guardian.
7. ^ Jump up to:a b International Energy Agency (2012). "Energy Technology Perspectives
2012" (PDF).
8. Jump up^ Heidari, Negin; Pearce, Joshua M. (2016). "A Review of Greenhouse Gas
Emission Liabilities as the Value of Renewable Energy for Mitigating Lawsuits for
Climate Change Related Damages". Renewable and Sustainable Energy Reviews. 55C:
899–908. doi:10.1016/j.rser.2015.11.025.
9. ^ Jump up to:a b c "Global Trends in Sustainable Energy Investment 2007: Analysis of
Trends and Issues in the Financing of Renewable Energy and Energy Efficiency in
OECD and Developing Countries" (PDF). unep.org. United Nations Environment
Programme. 2007. p. 3. Archived (PDF) from the original on 13 October 2014.
Retrieved 13 October 2014.
10. ^ Jump up to:a b REN21 (2013). "Renewables global futures report 2013" (PDF).[permanent
dead link]
11. Jump up^ Vad Mathiesen, Brian; et al. (2015). "Smart Energy Systems for coherent
100% renewable energy and transport solutions". Applied Energy. 145: 139–
154. doi:10.1016/j.apenergy.2015.01.075.
12. Jump up^ World Energy Assessment (2001). Renewable energy technologies Archived 9
June 2007 at the Wayback Machine., p. 221.
13. ^ Jump up to:a b c Steve Leone (25 August 2011). "U.N. Secretary-General: Renewables
Can End Energy Poverty". Renewable Energy World.
14. Jump up^ Armaroli, Nicola; Balzani, Vincenzo (2011). "Towards an electricity-powered
world". Energy and Environmental Science. 4: 3193–3222. doi:10.1039/c1ee01249e.
15. Jump up^ Armaroli, Nicola; Balzani, Vincenzo (2016). "Solar Electricity and Solar Fuels:
Status and Perspectives in the Context of the Energy Transition". Chemistry – A
European Journal. 22: 32–57. doi:10.1002/chem.201503580.
16. Jump up^ Volker Quaschning, Regenerative Energiesysteme. Technologie – Berechnung
– Simulation. 8th. Edition. Hanser (Munich) 2013, p. 49.
17. Jump up^ Electric cars and cheap solar 'could halt fossil fuel growth by 2020' The
Guardian](https://image.slidesharecdn.com/nonconventionalenergyresources-180417080627/85/Non-conventional-energy-resources-seminar-report-36-320.jpg)


The seminar report by Ayush Chandra addresses non-conventional energy resources and highlights the growing demand for electricity, especially in India, while emphasizing the limitations of fossil fuels. It discusses various alternative energy generation methods, including solar, wind, and hydropower, and their potential to meet future energy needs sustainably. The report also underscores the importance of renewable energy in mitigating climate change and boosting economic development globally.


