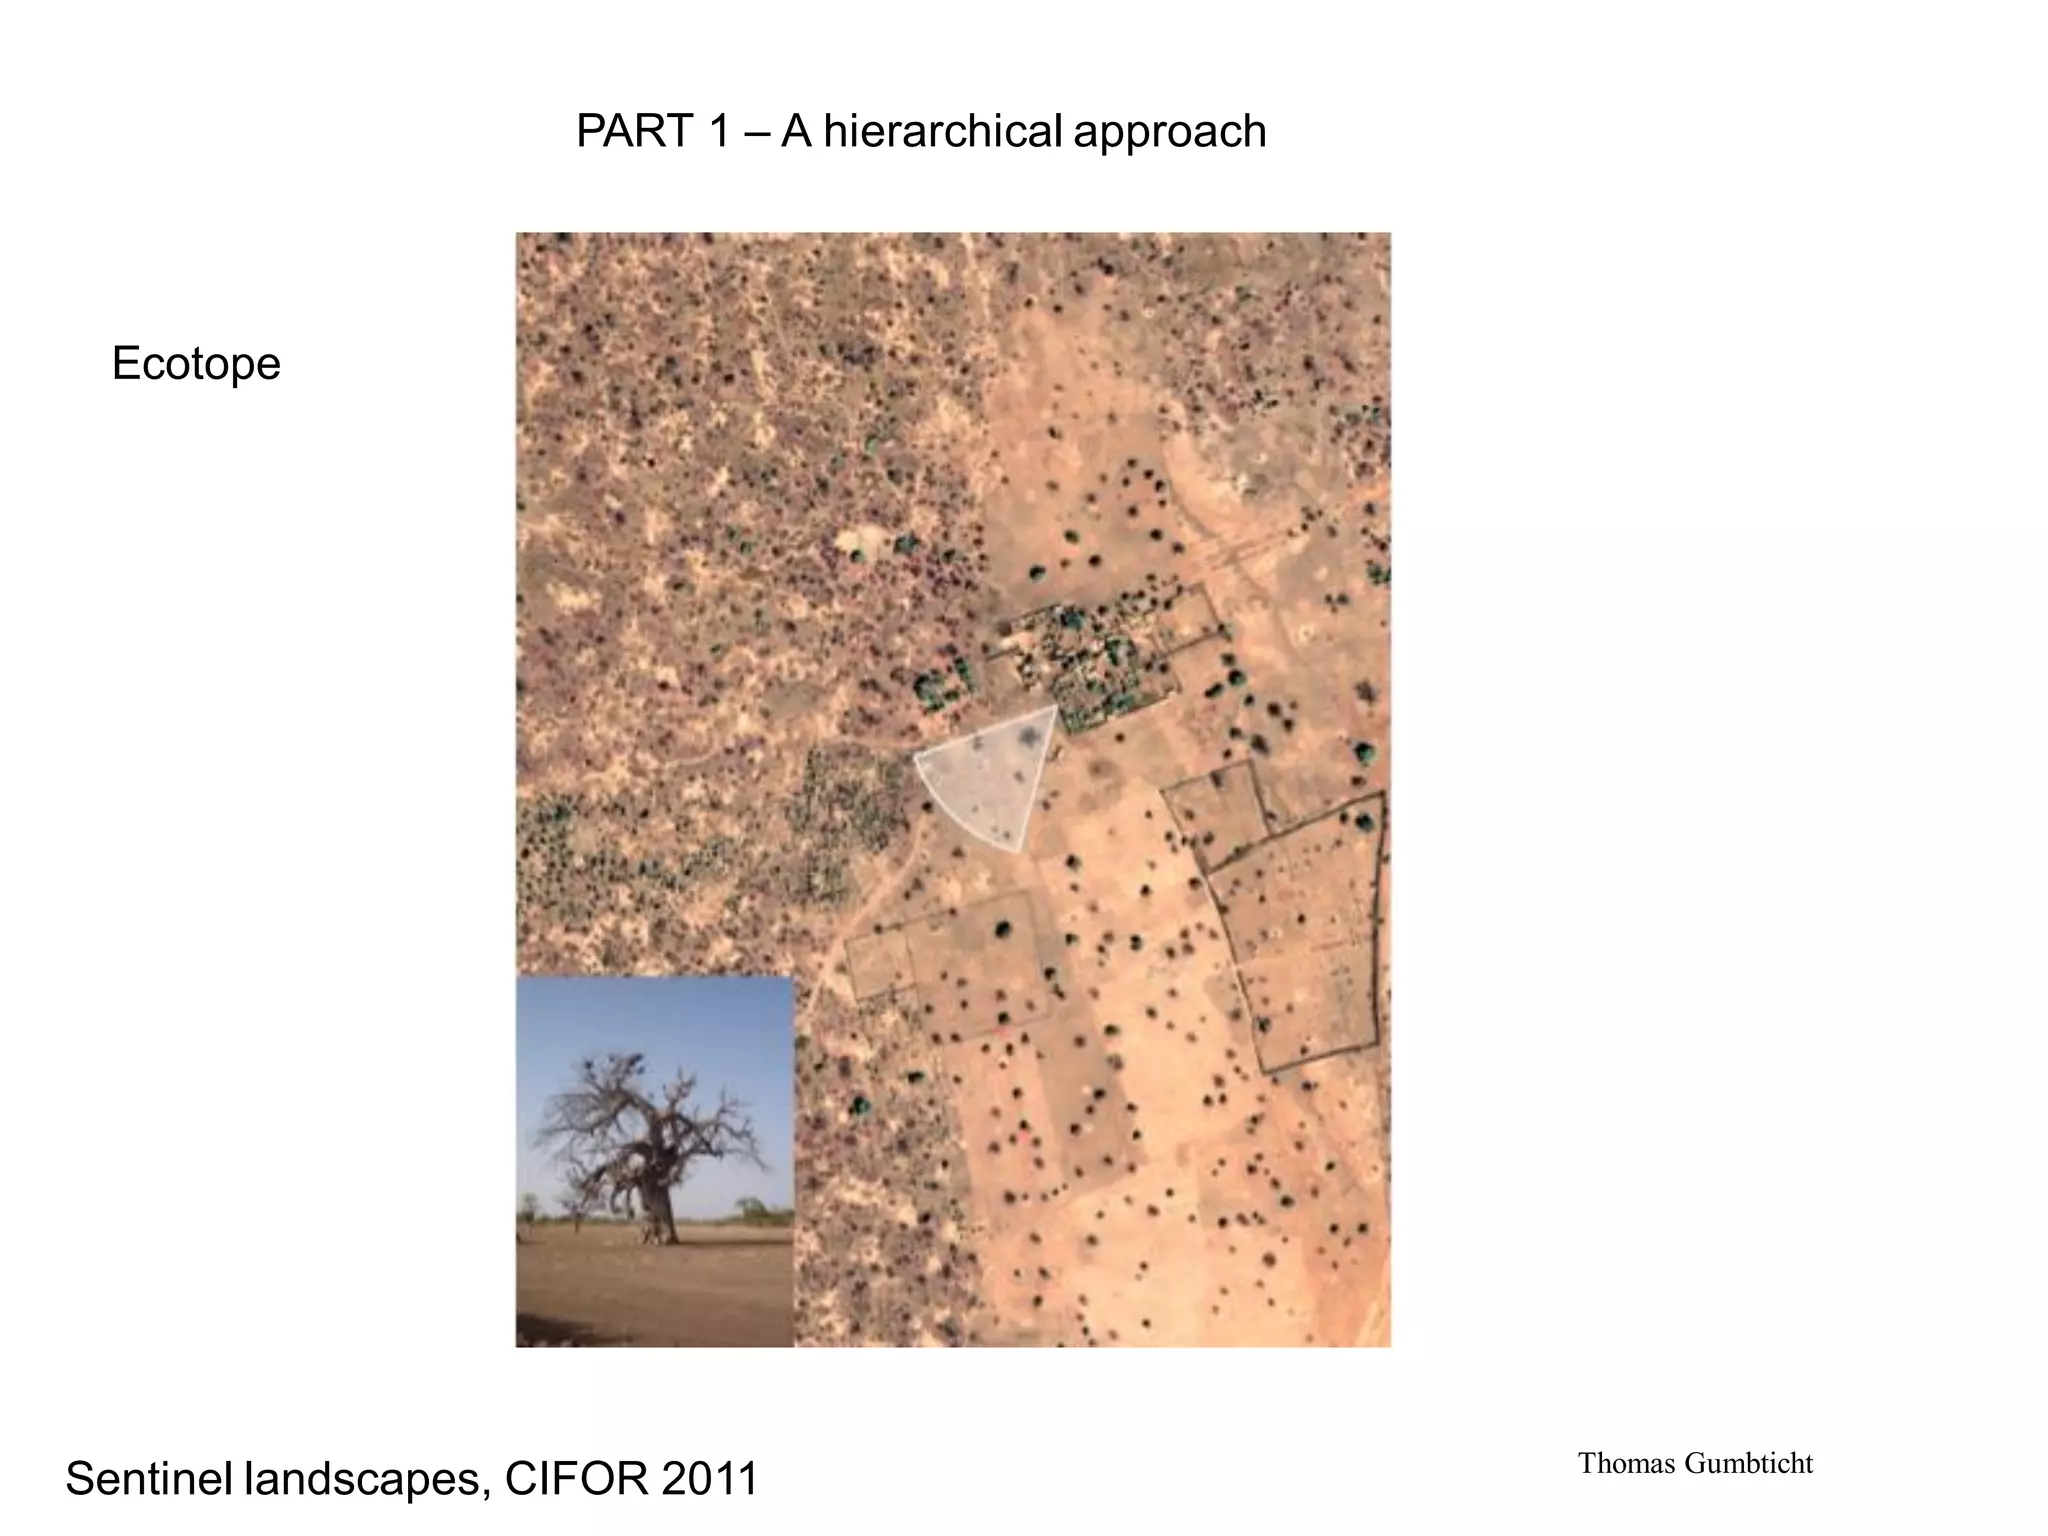
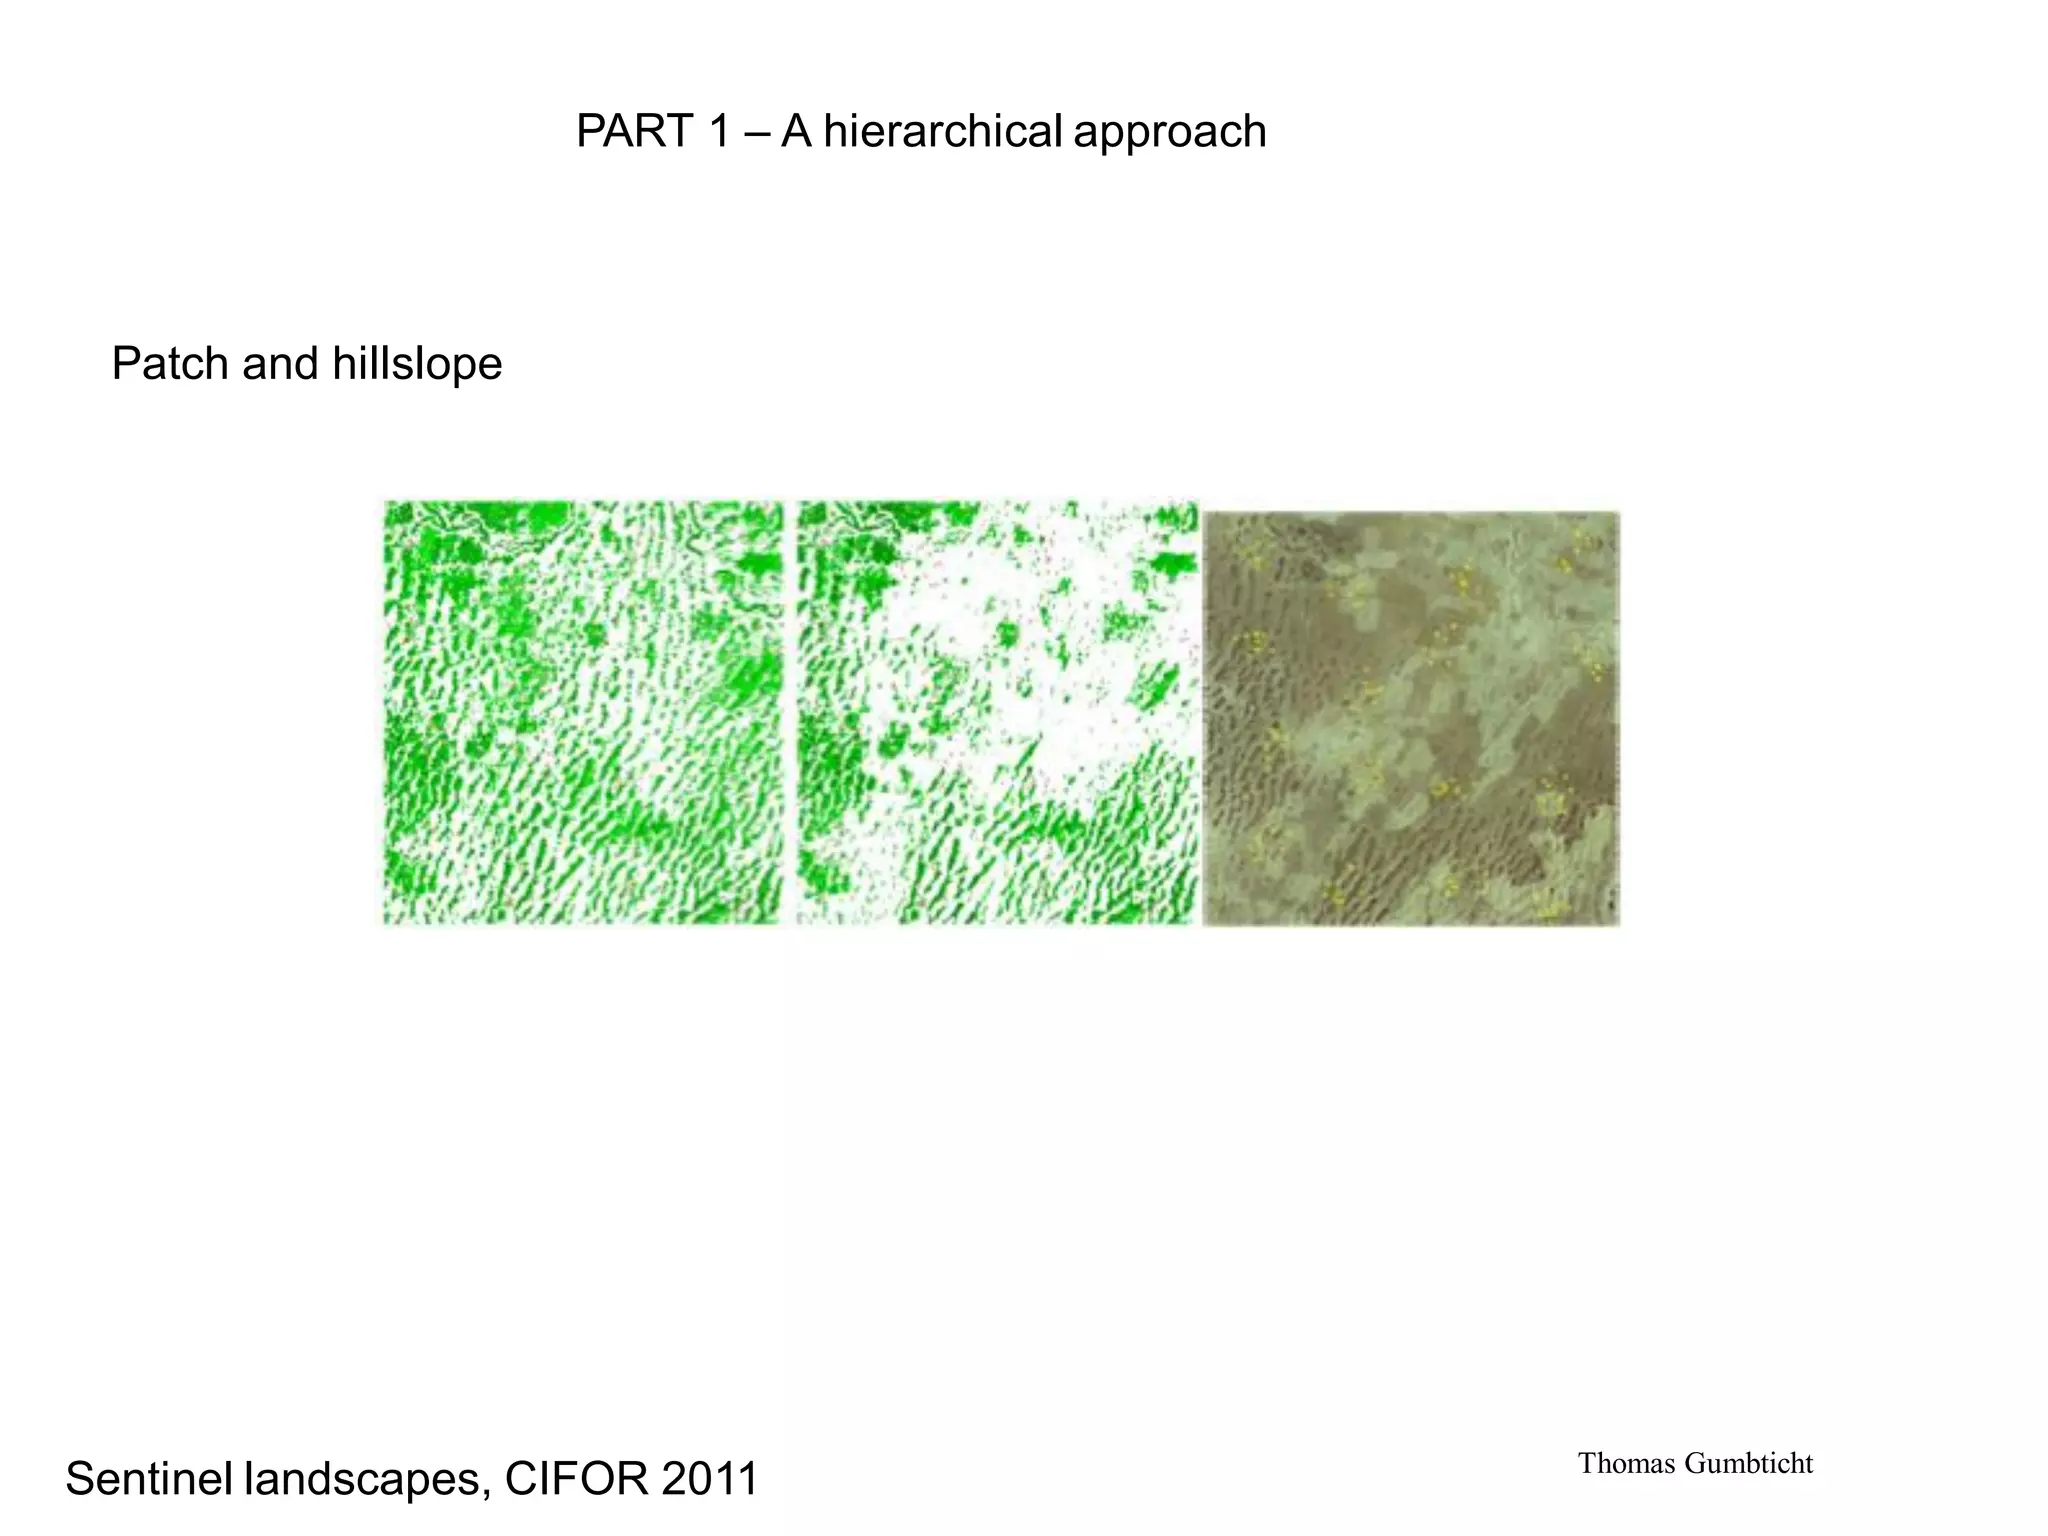
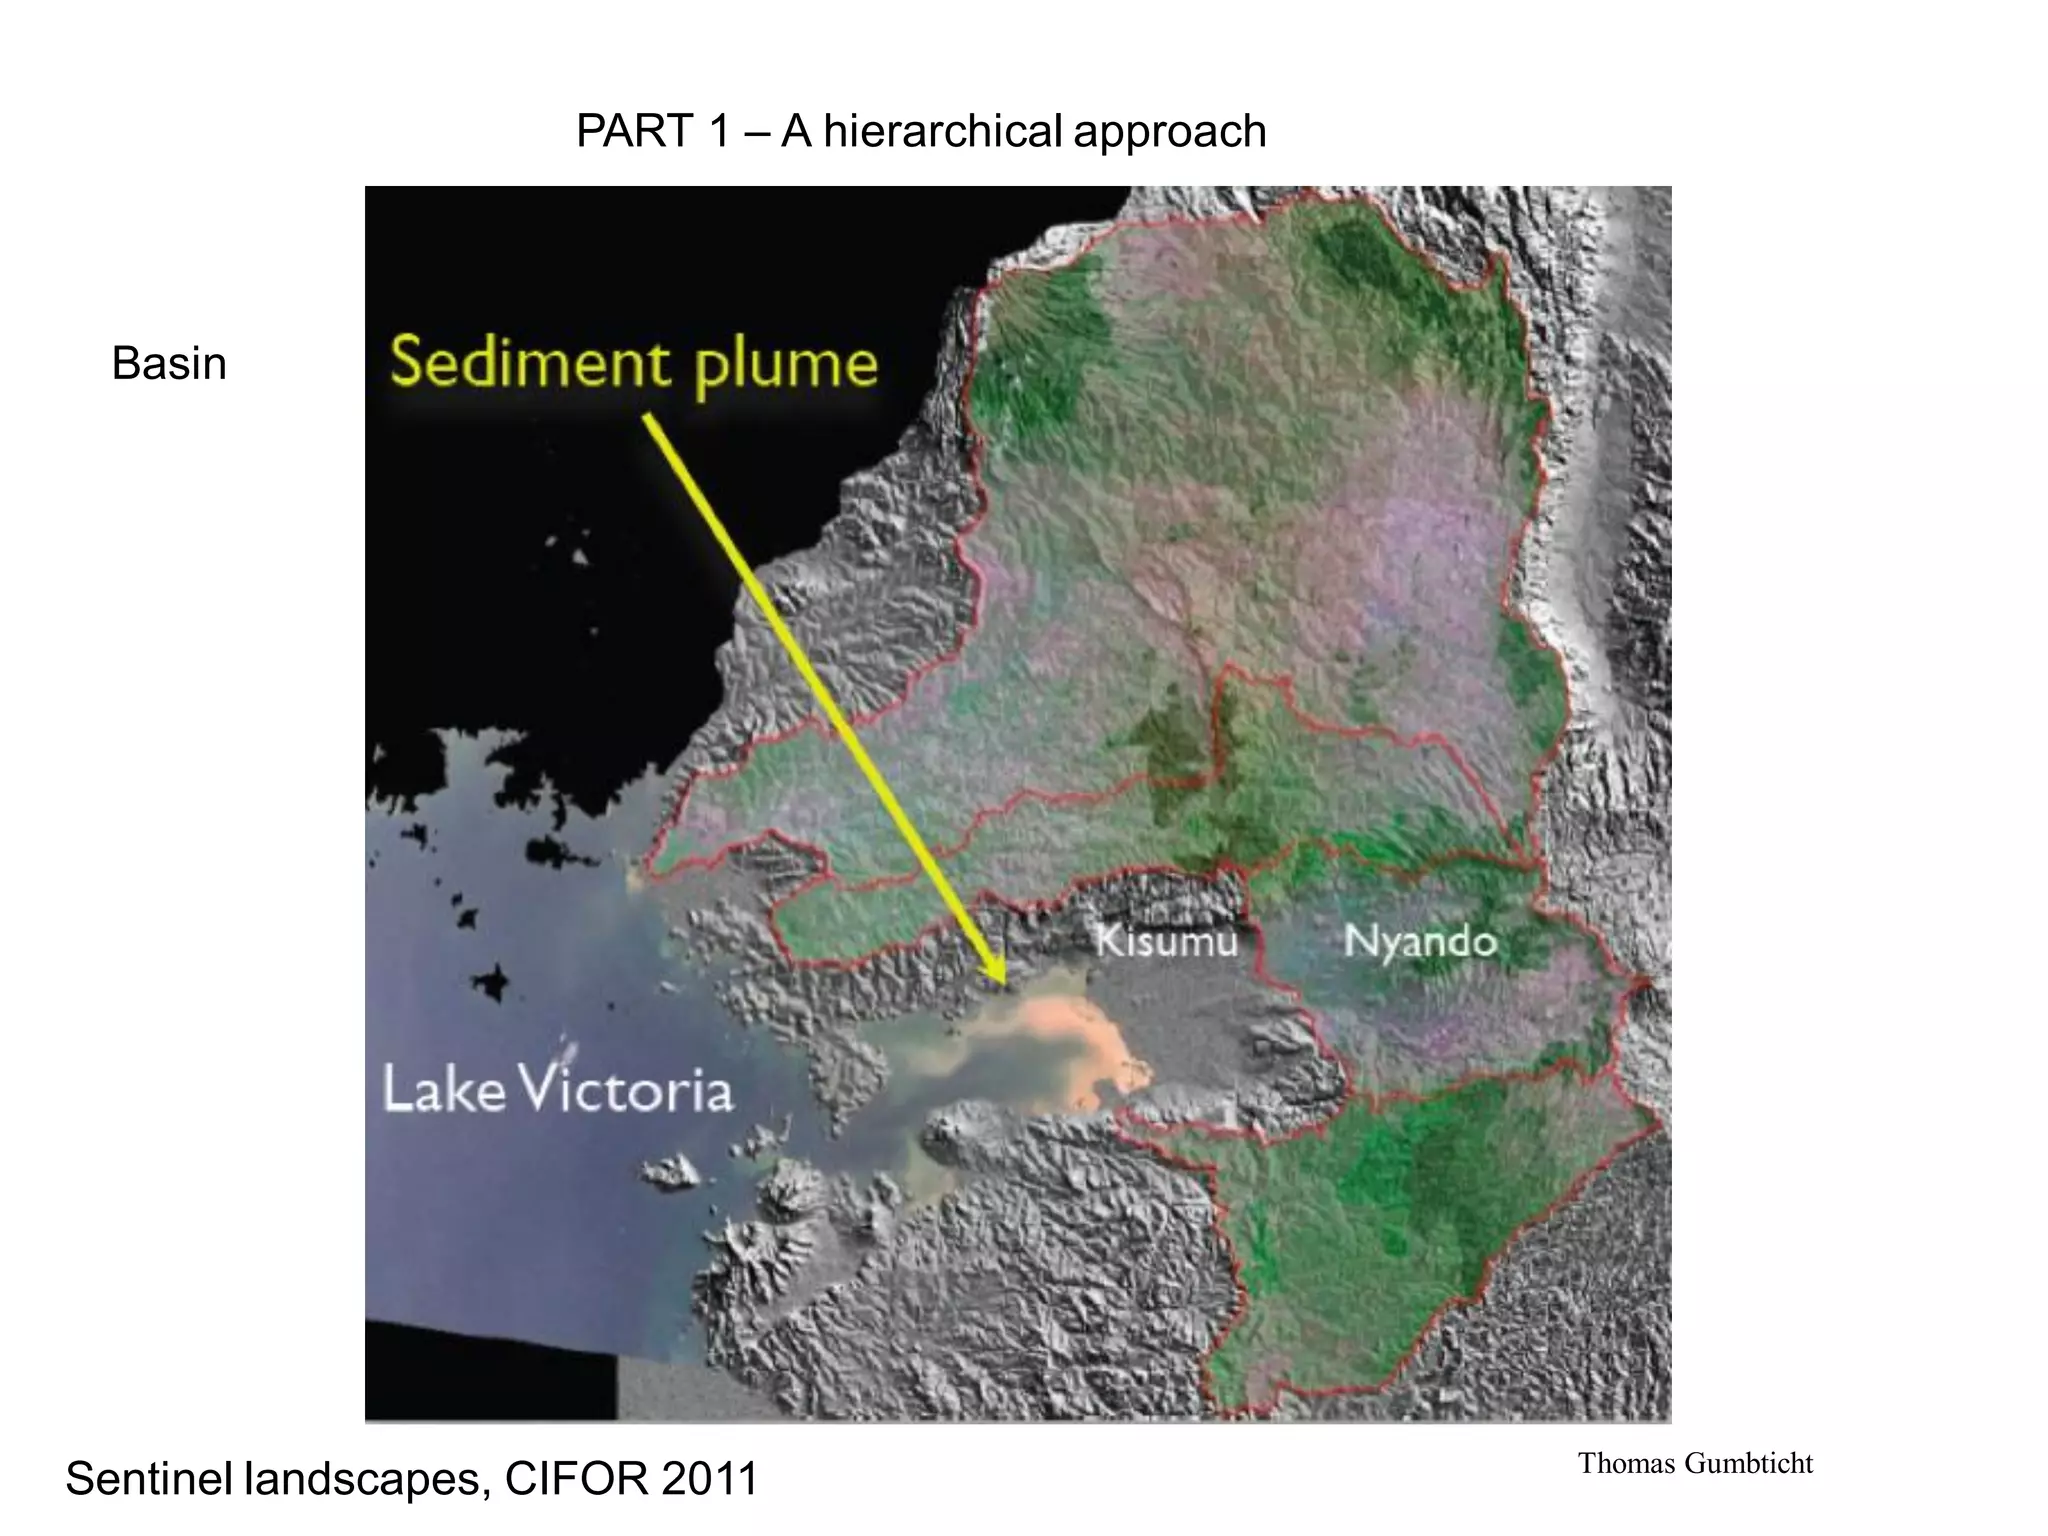
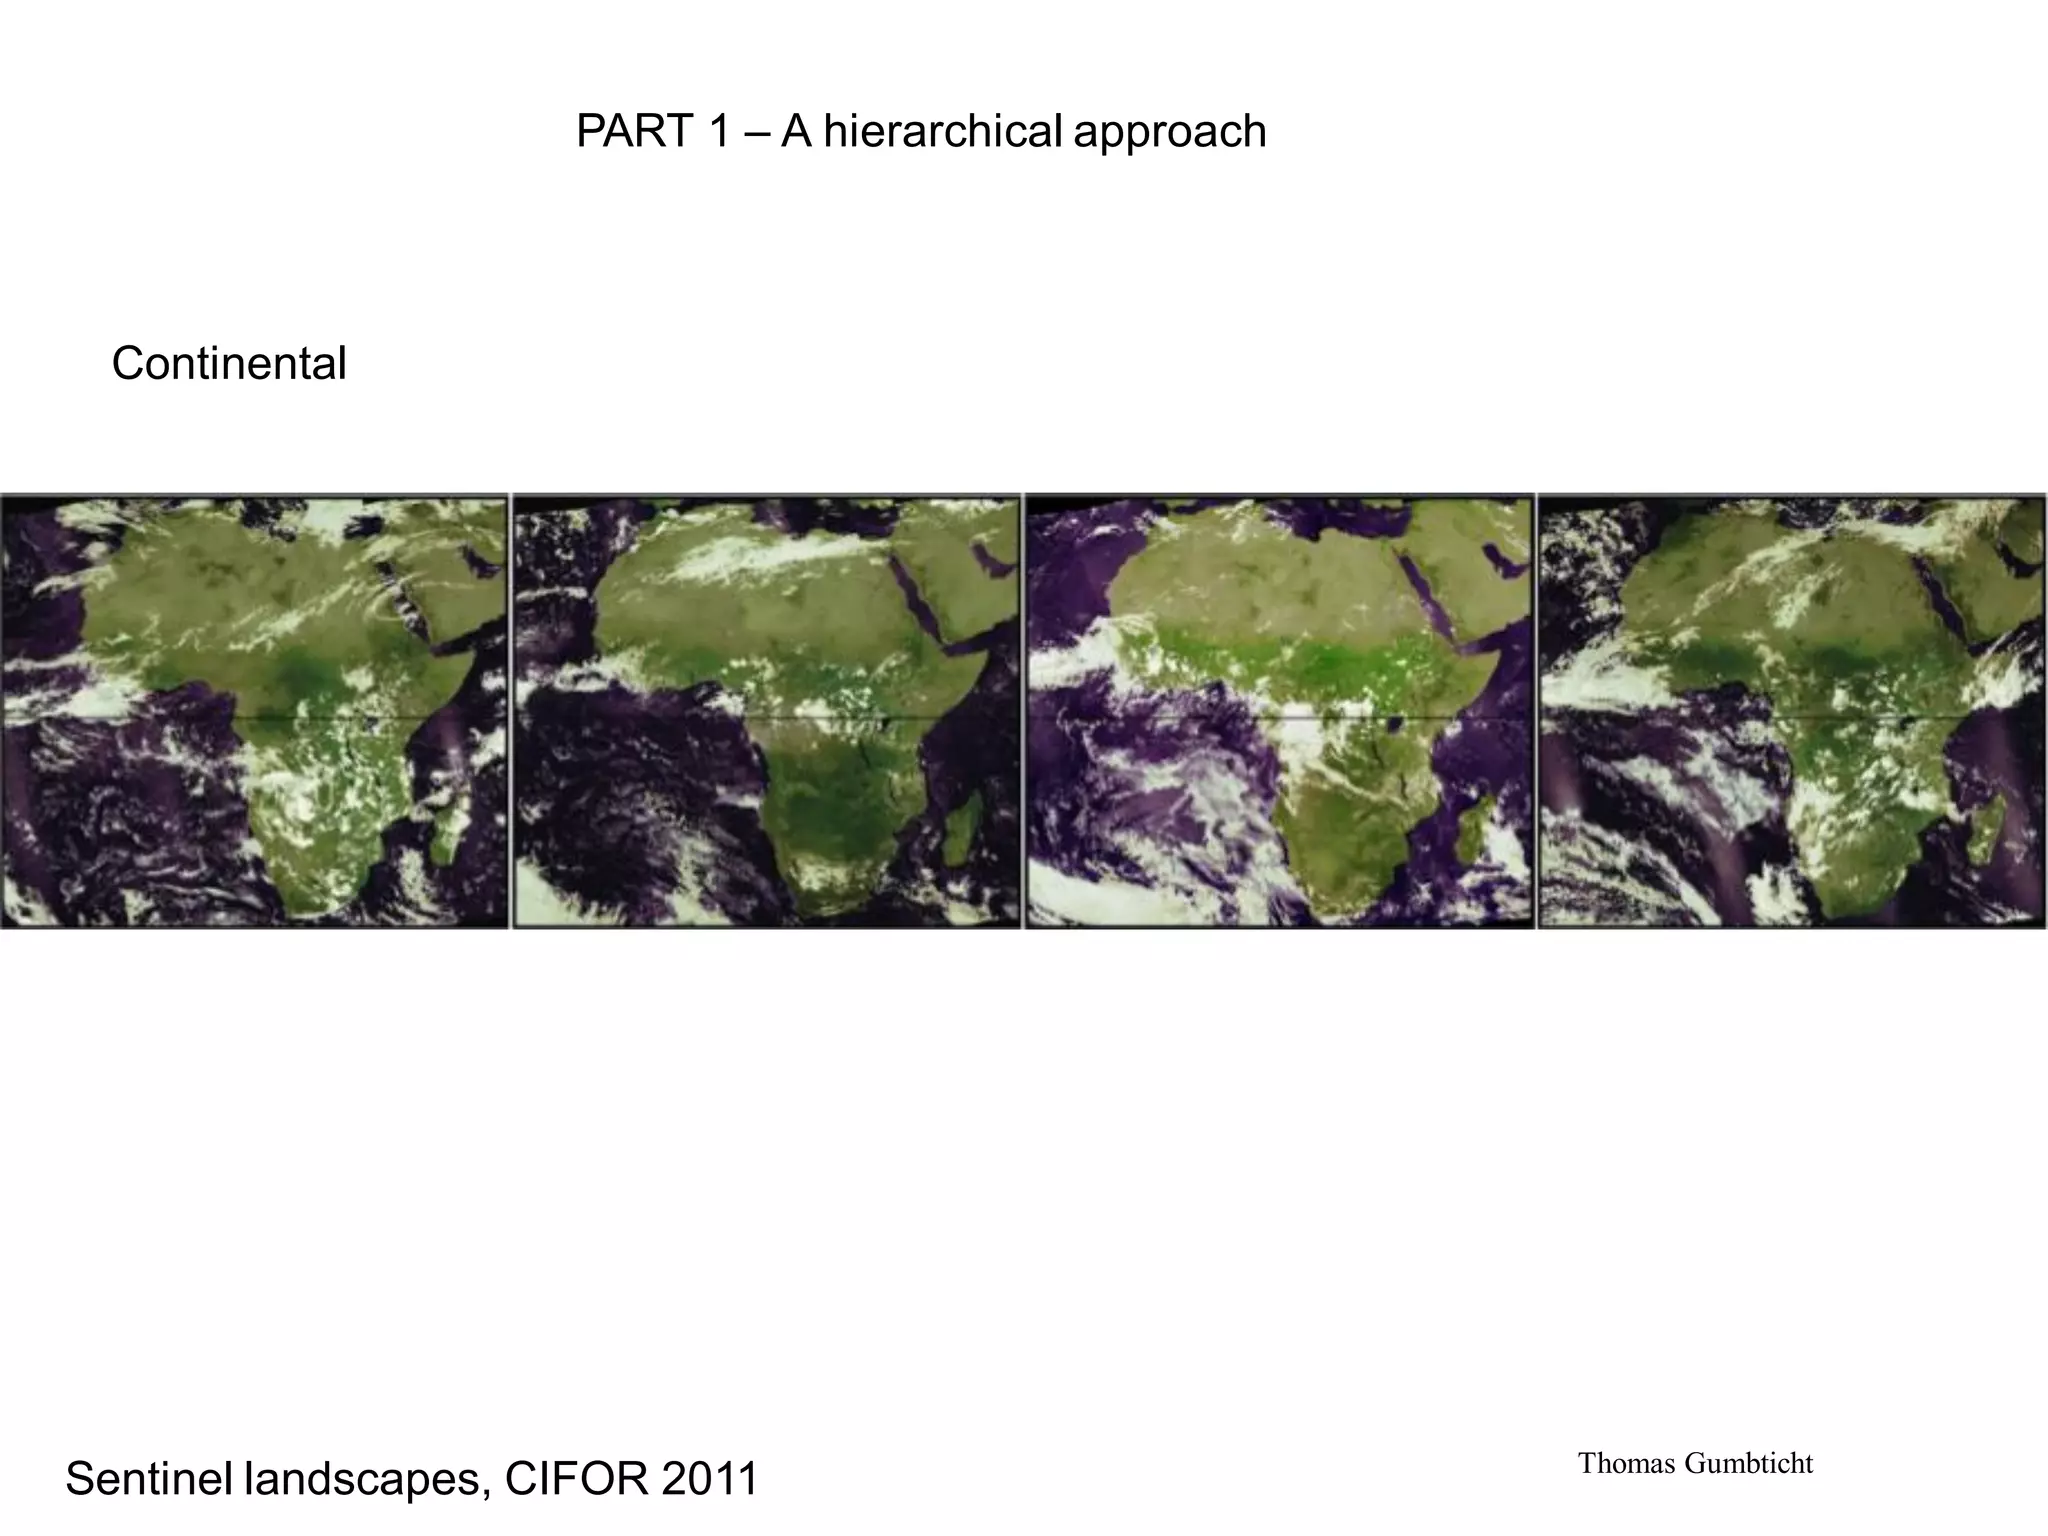
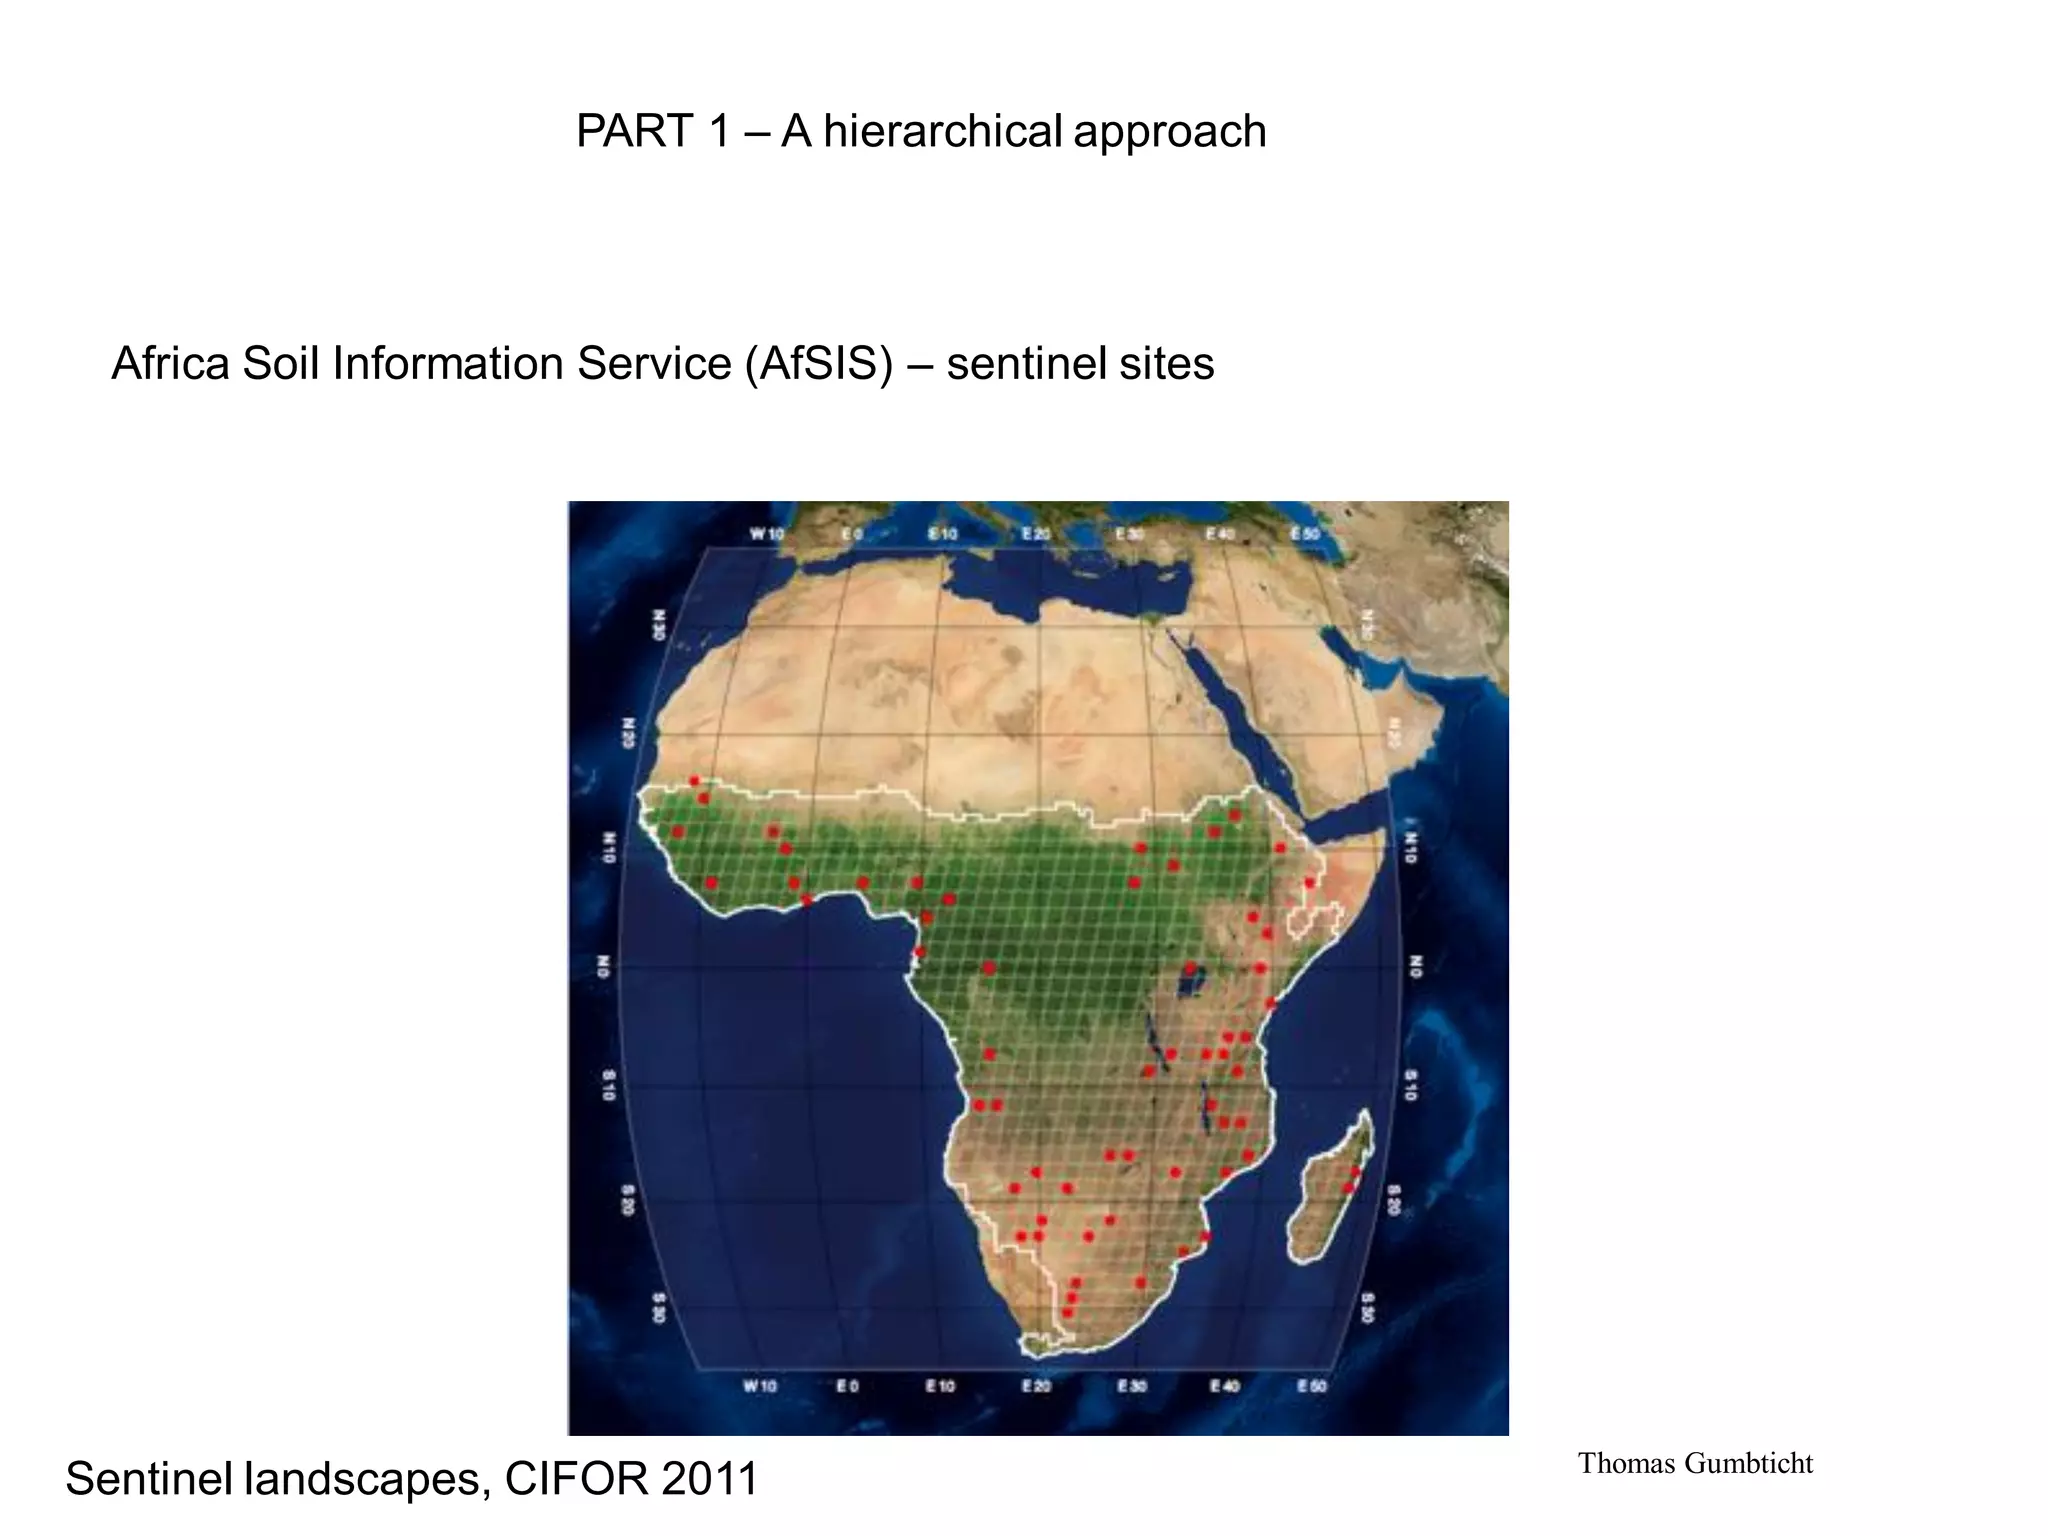
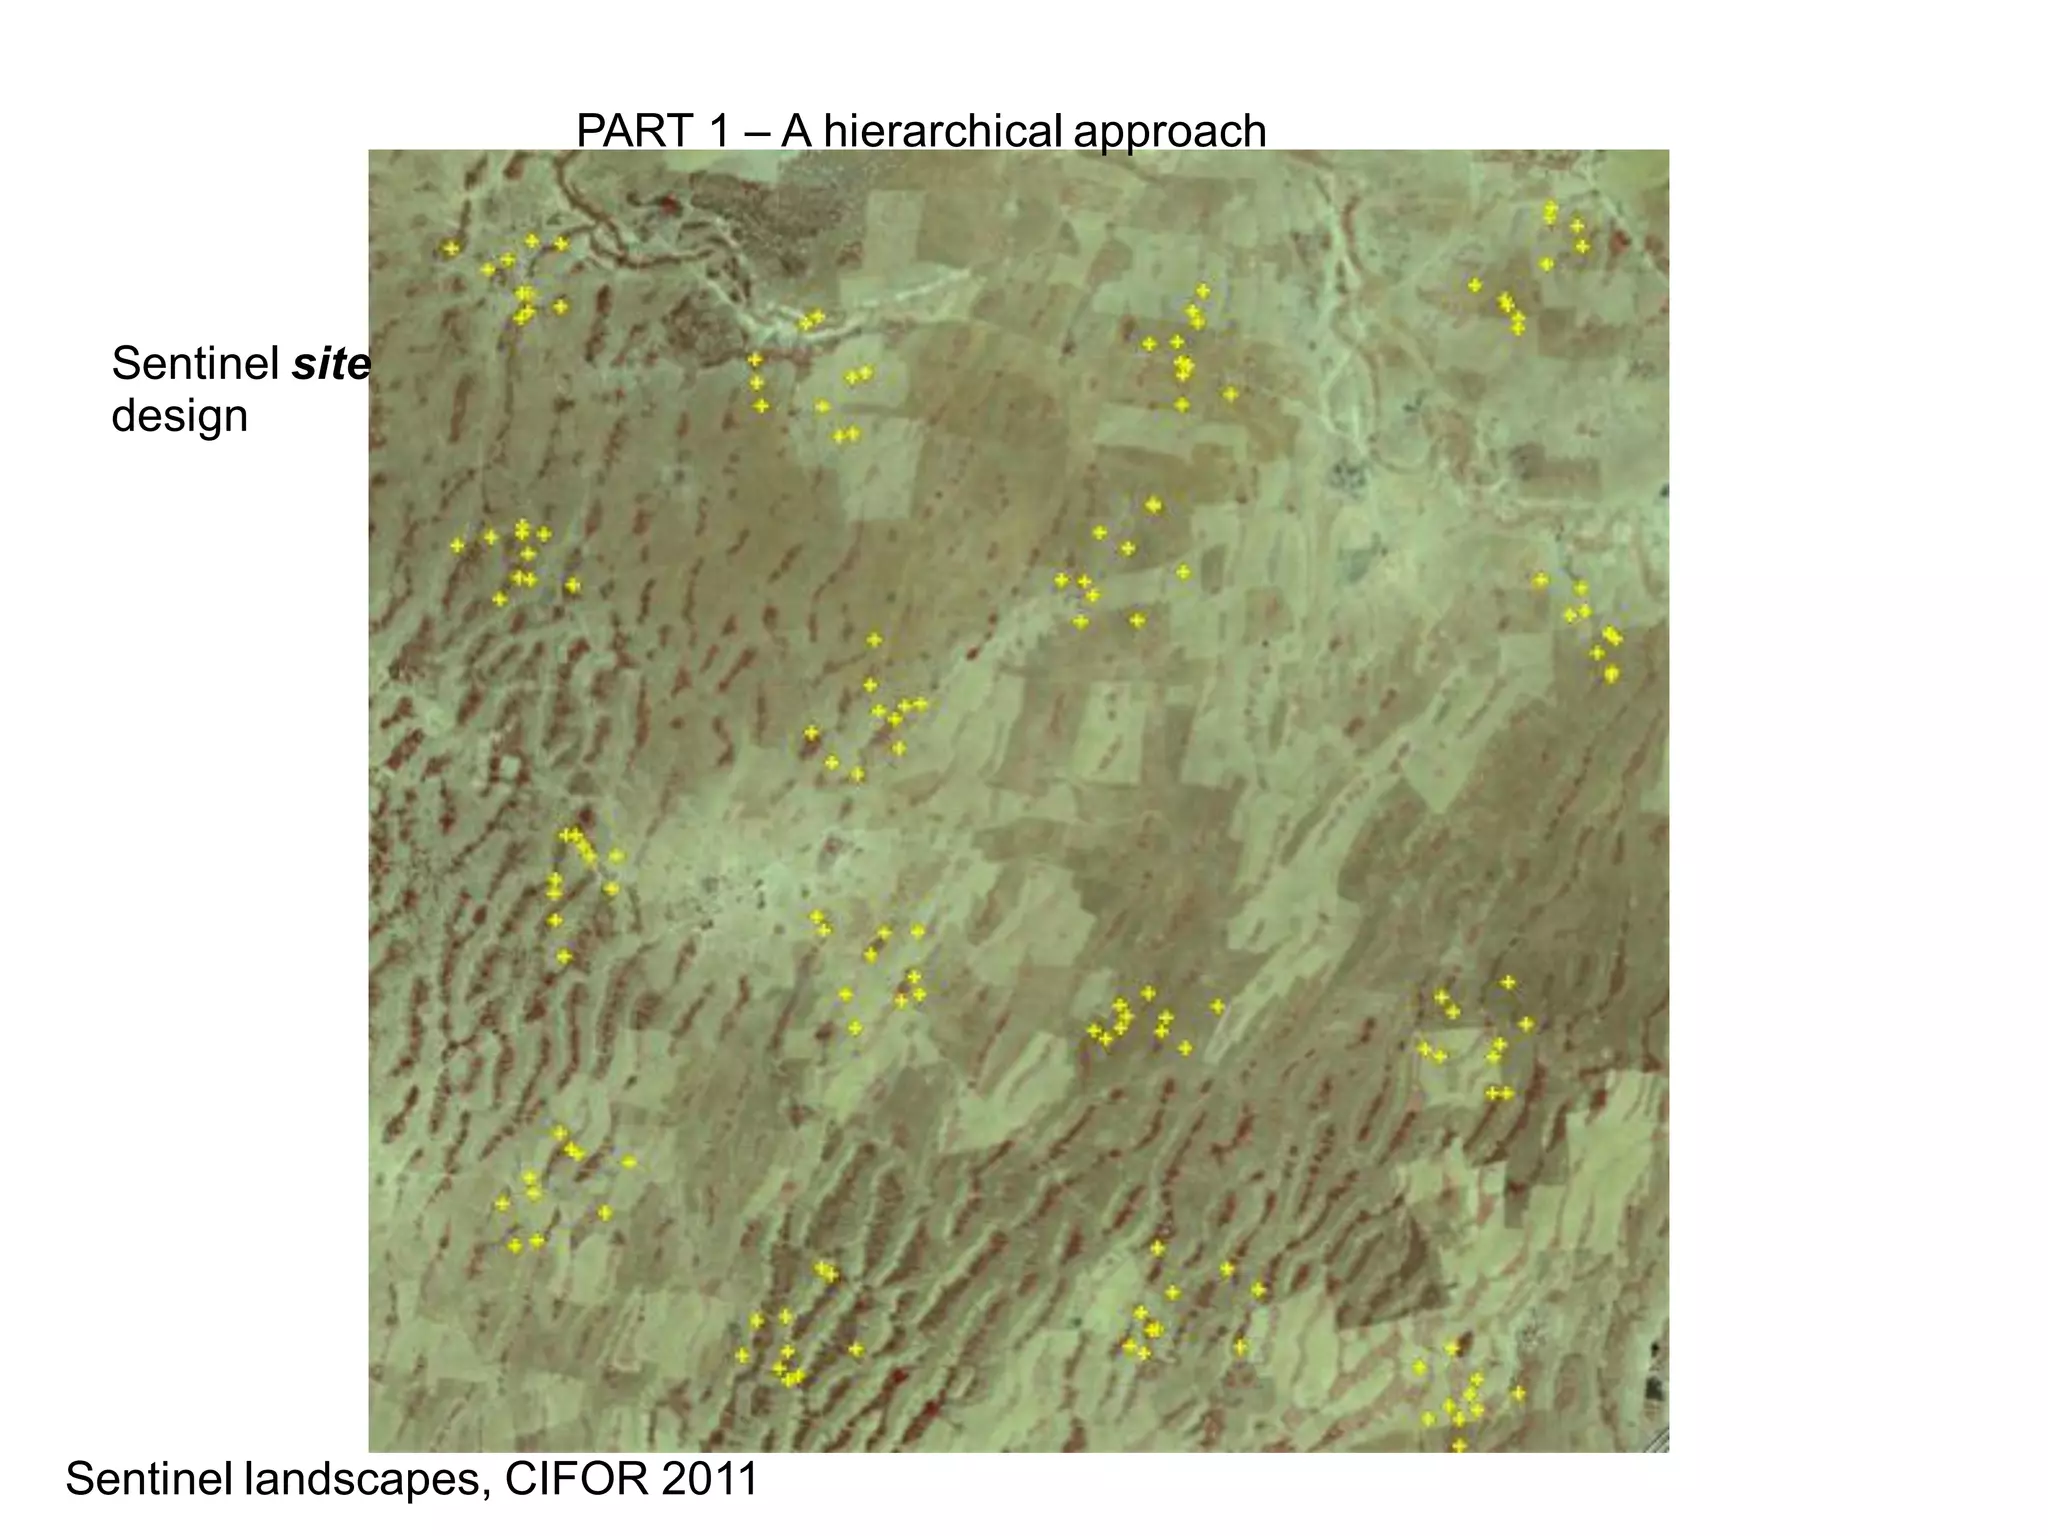
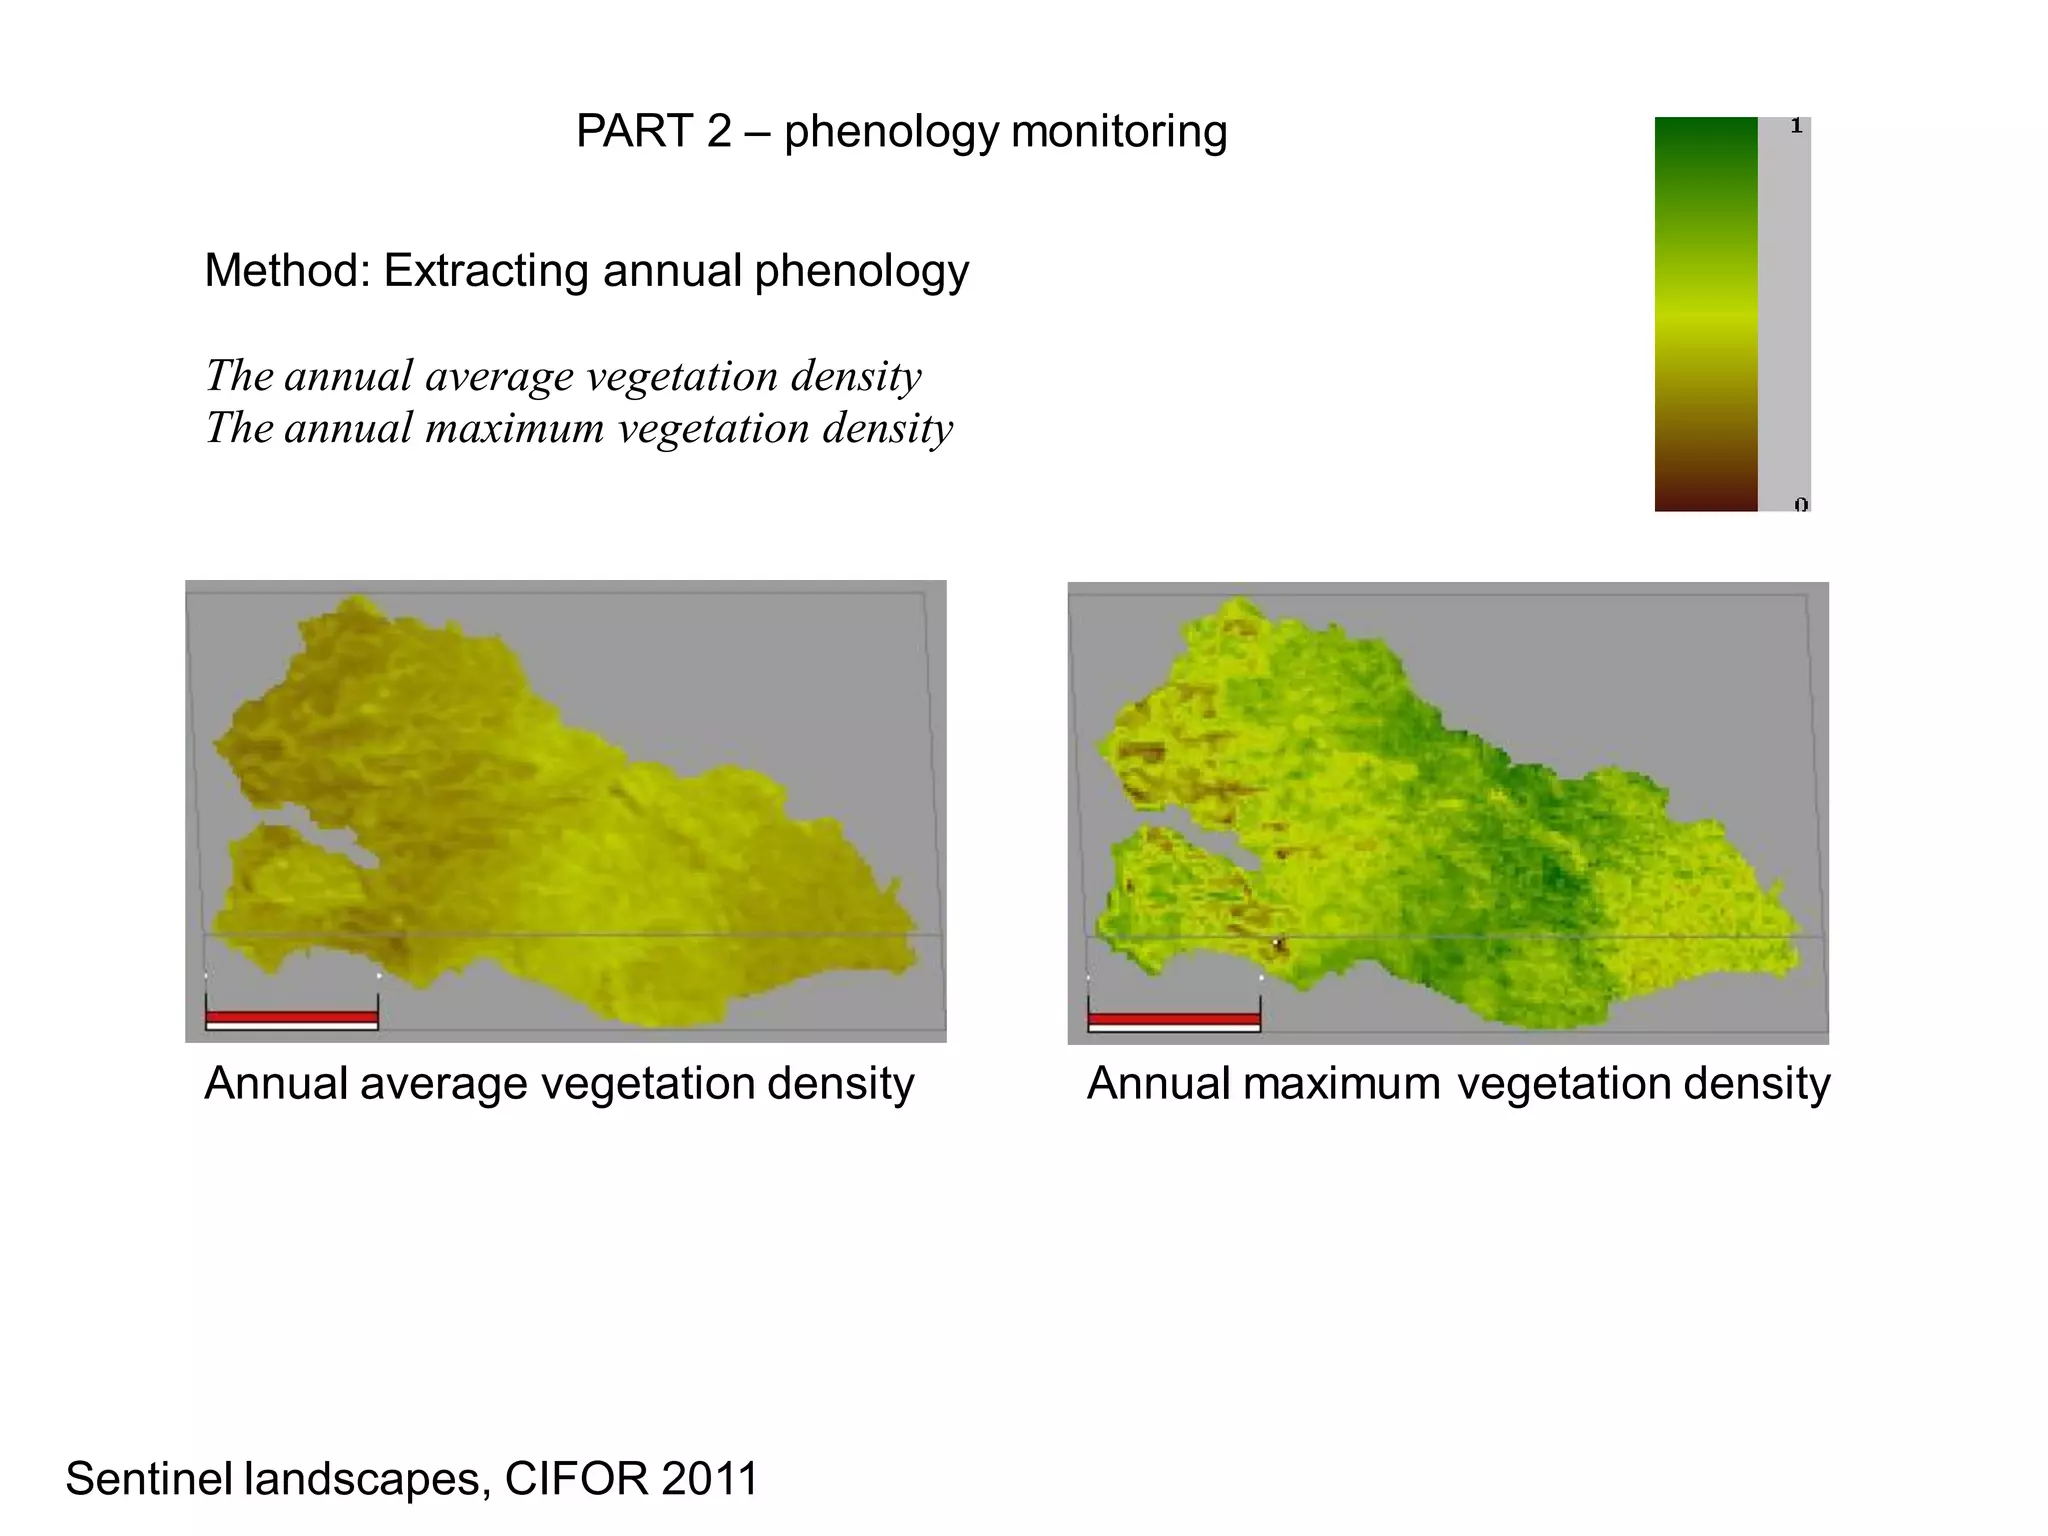
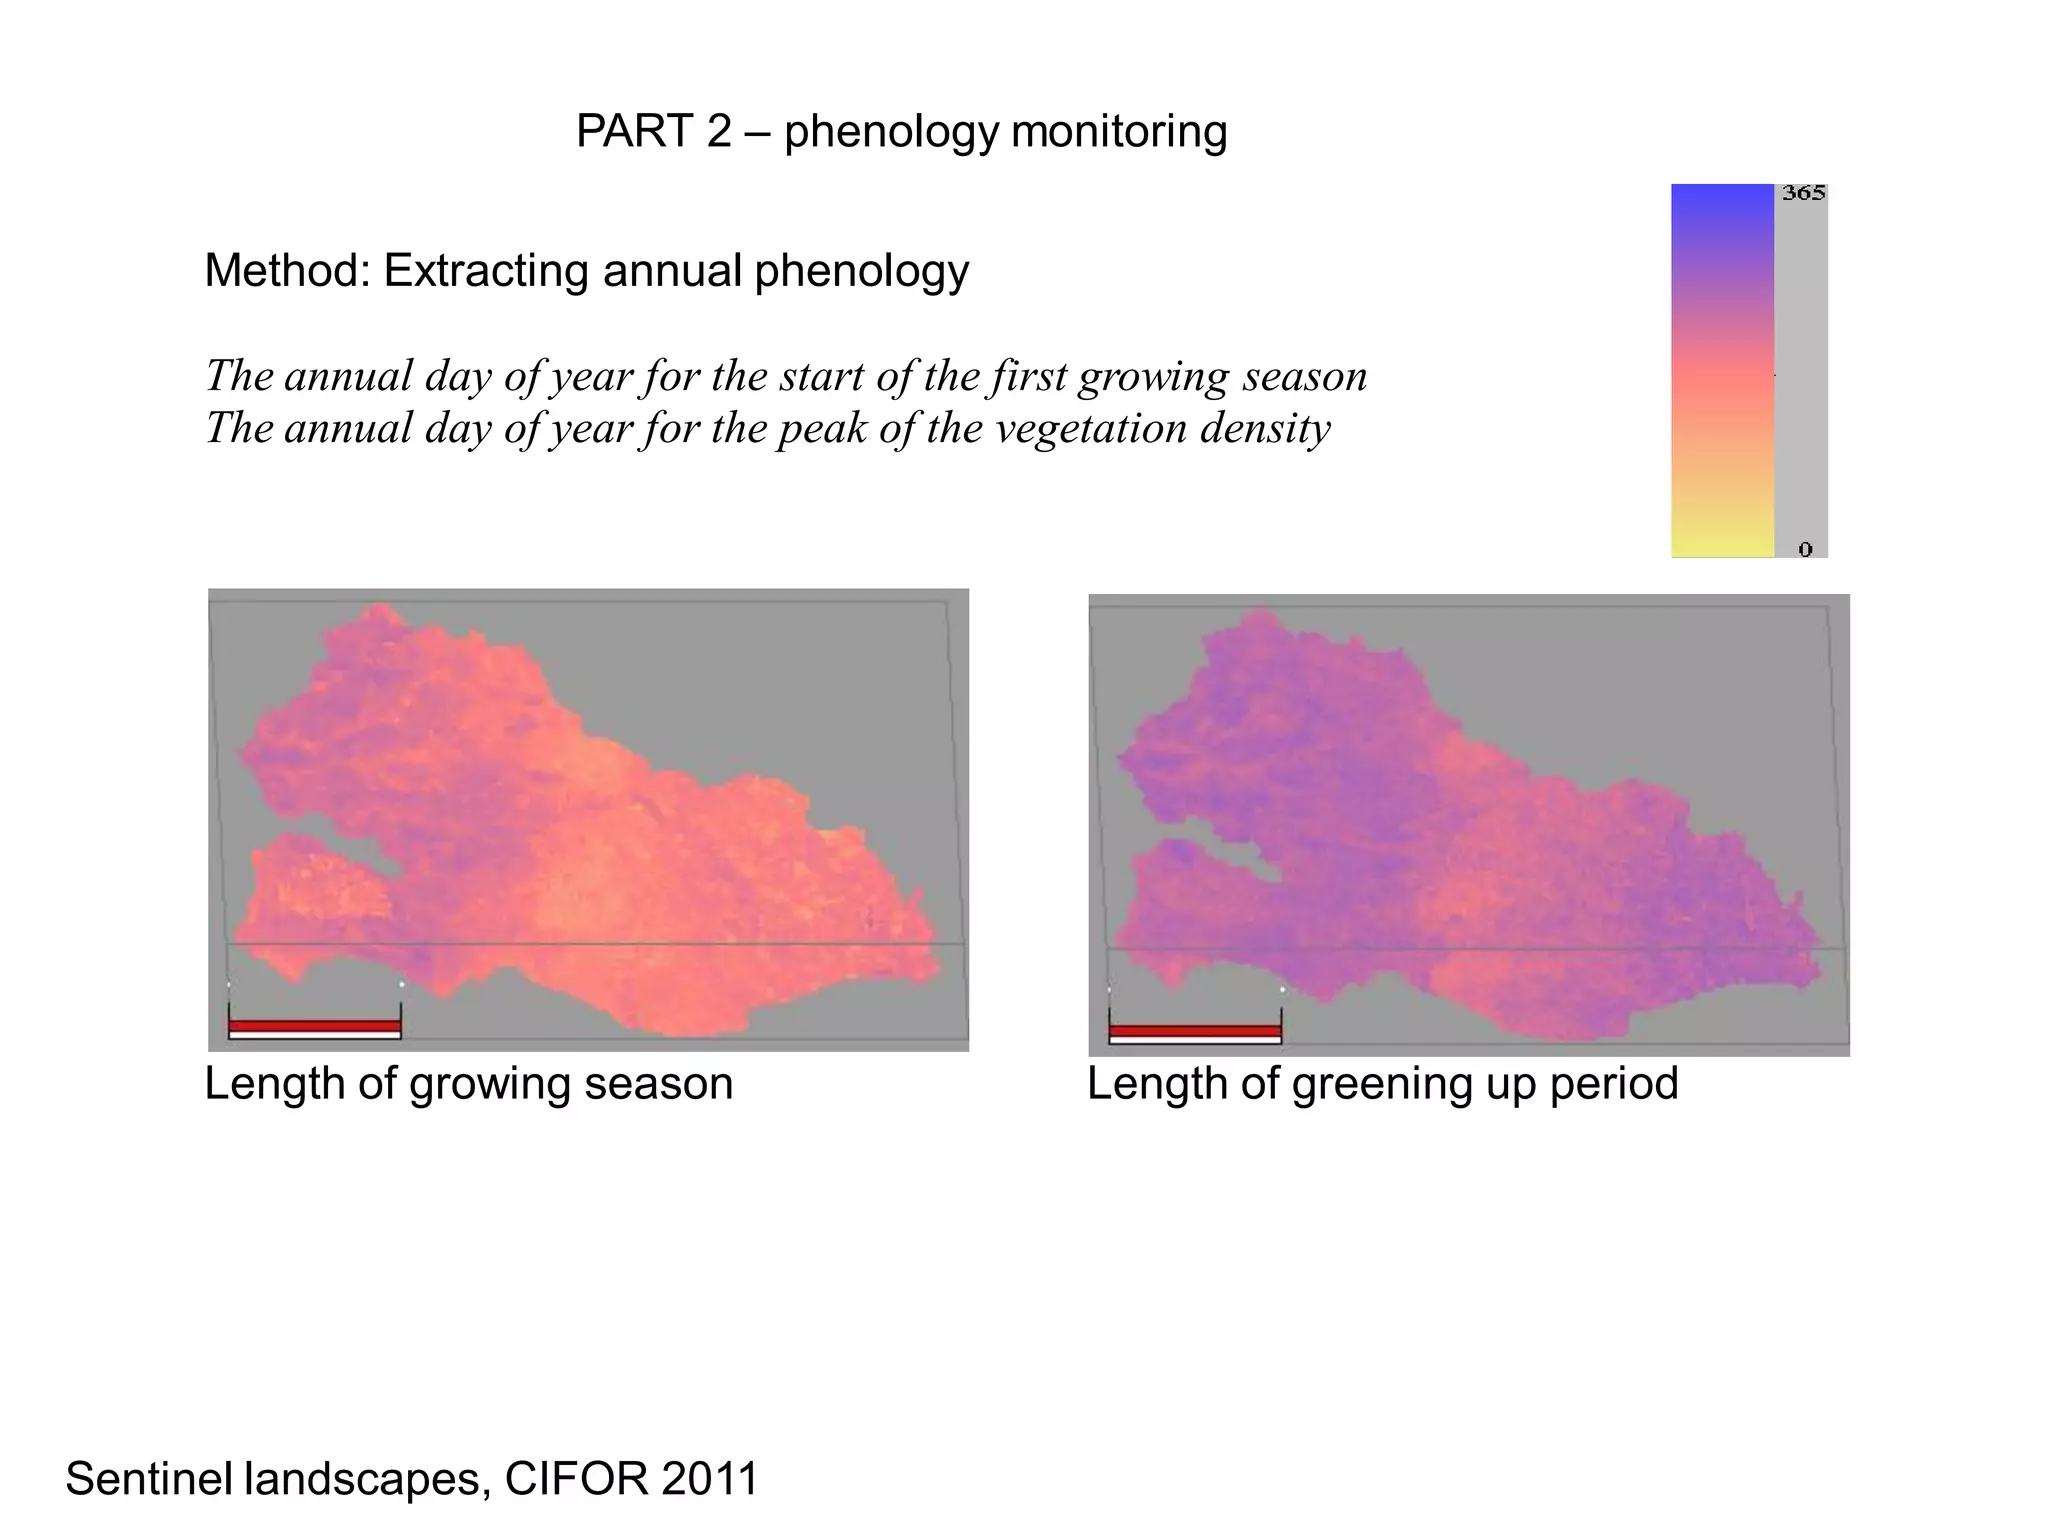
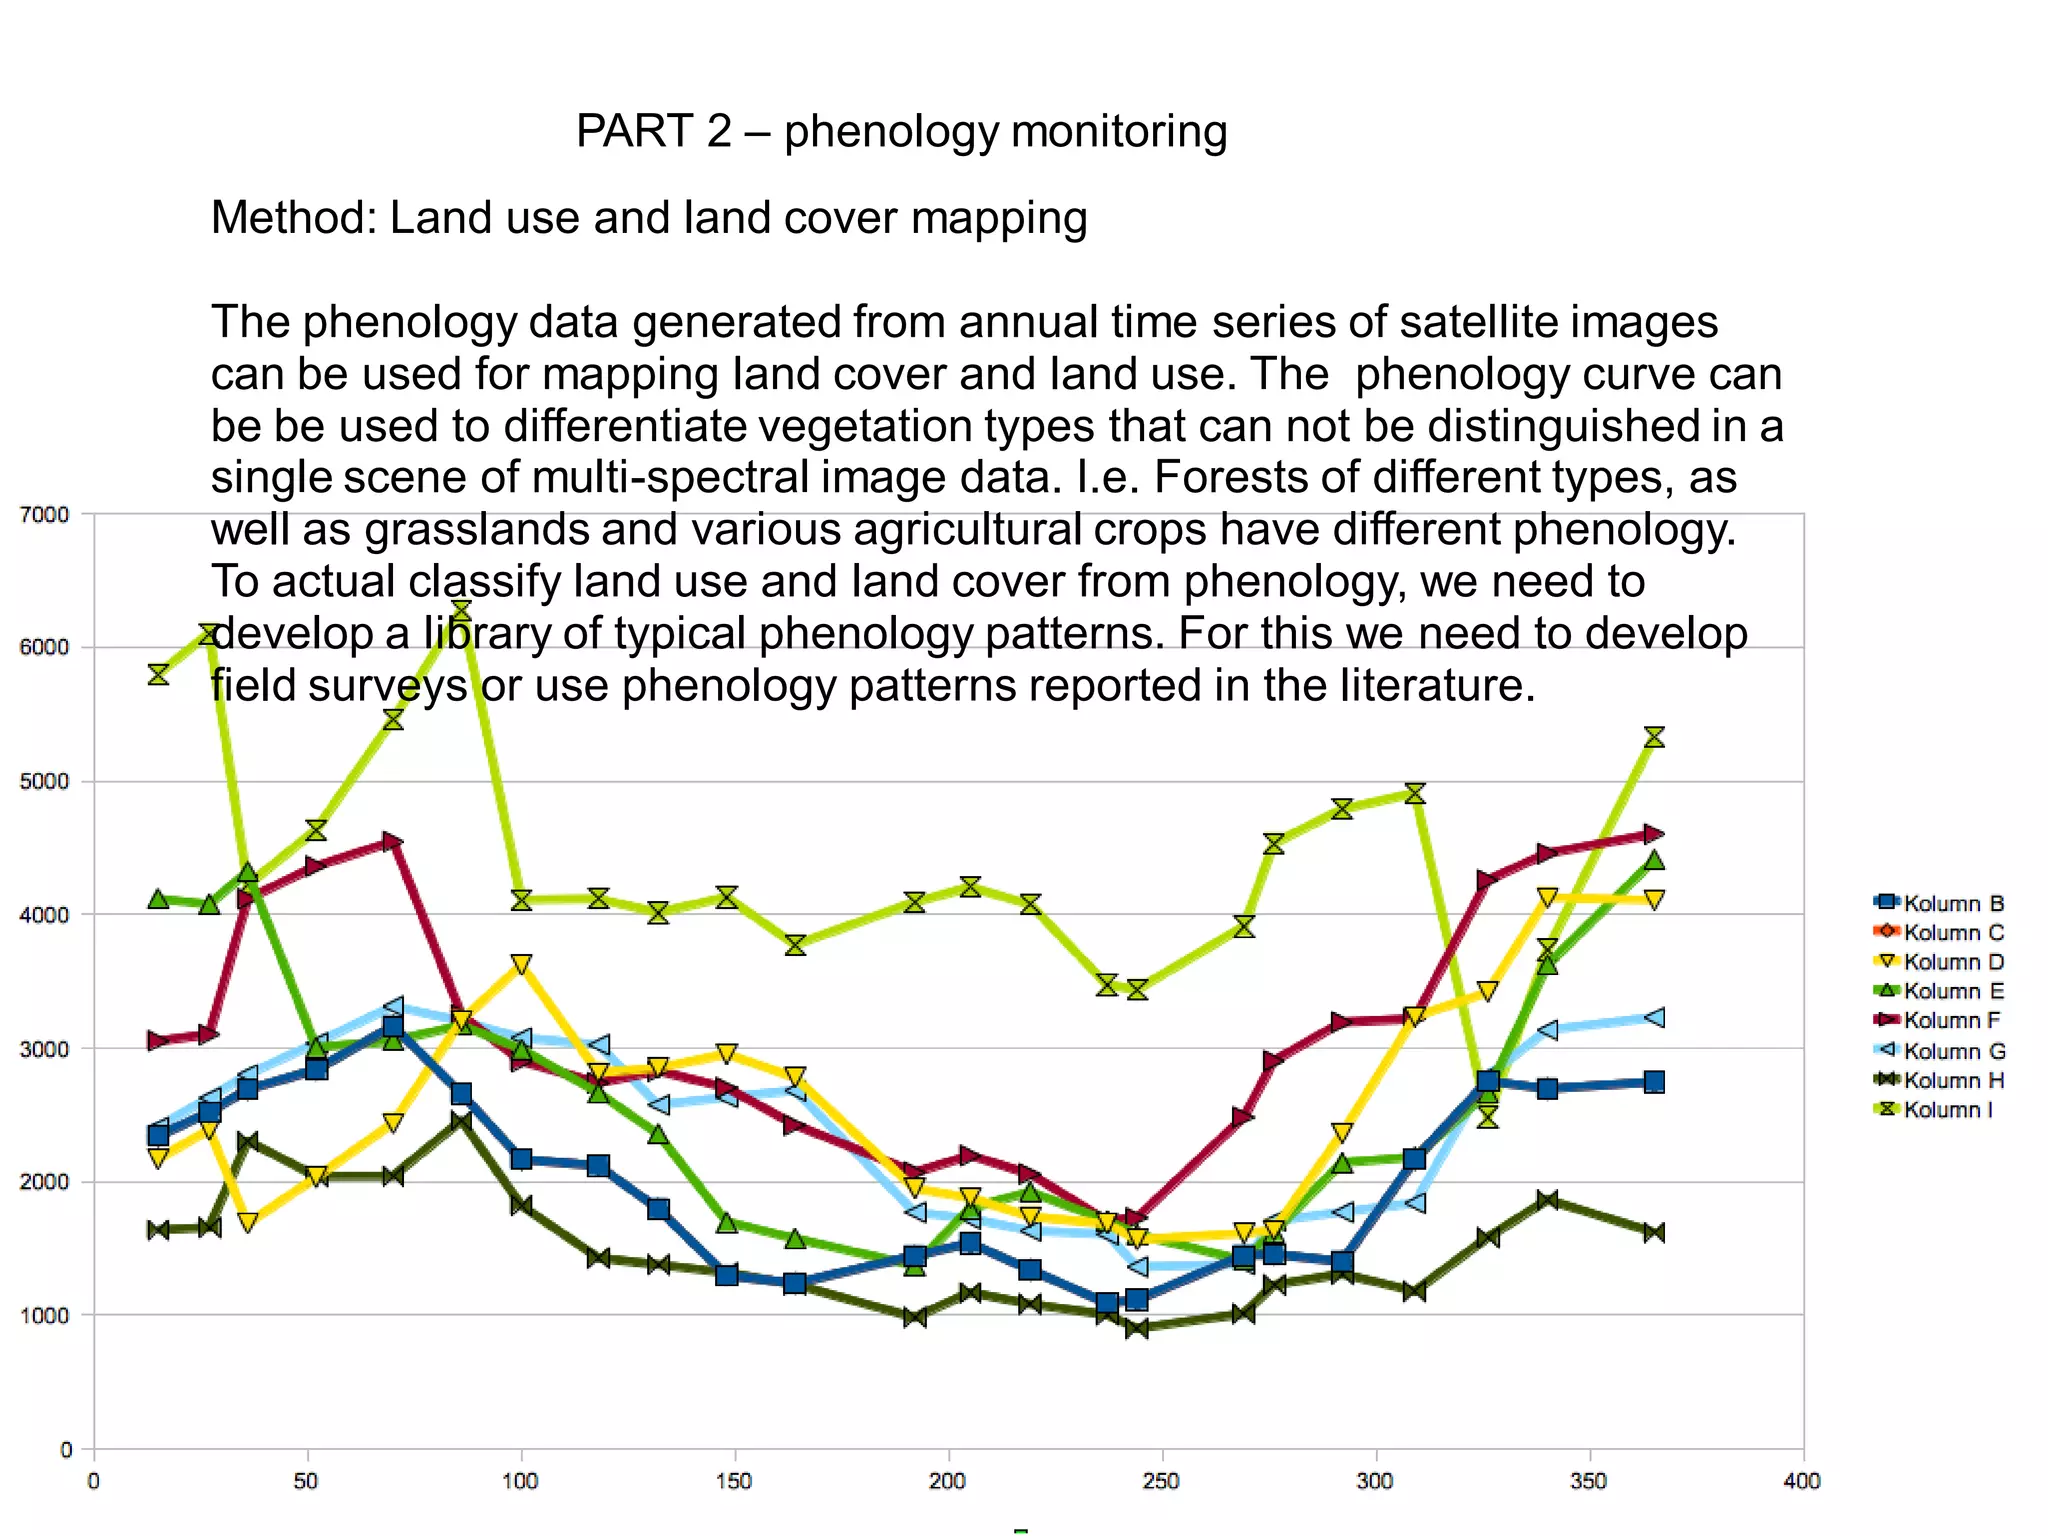
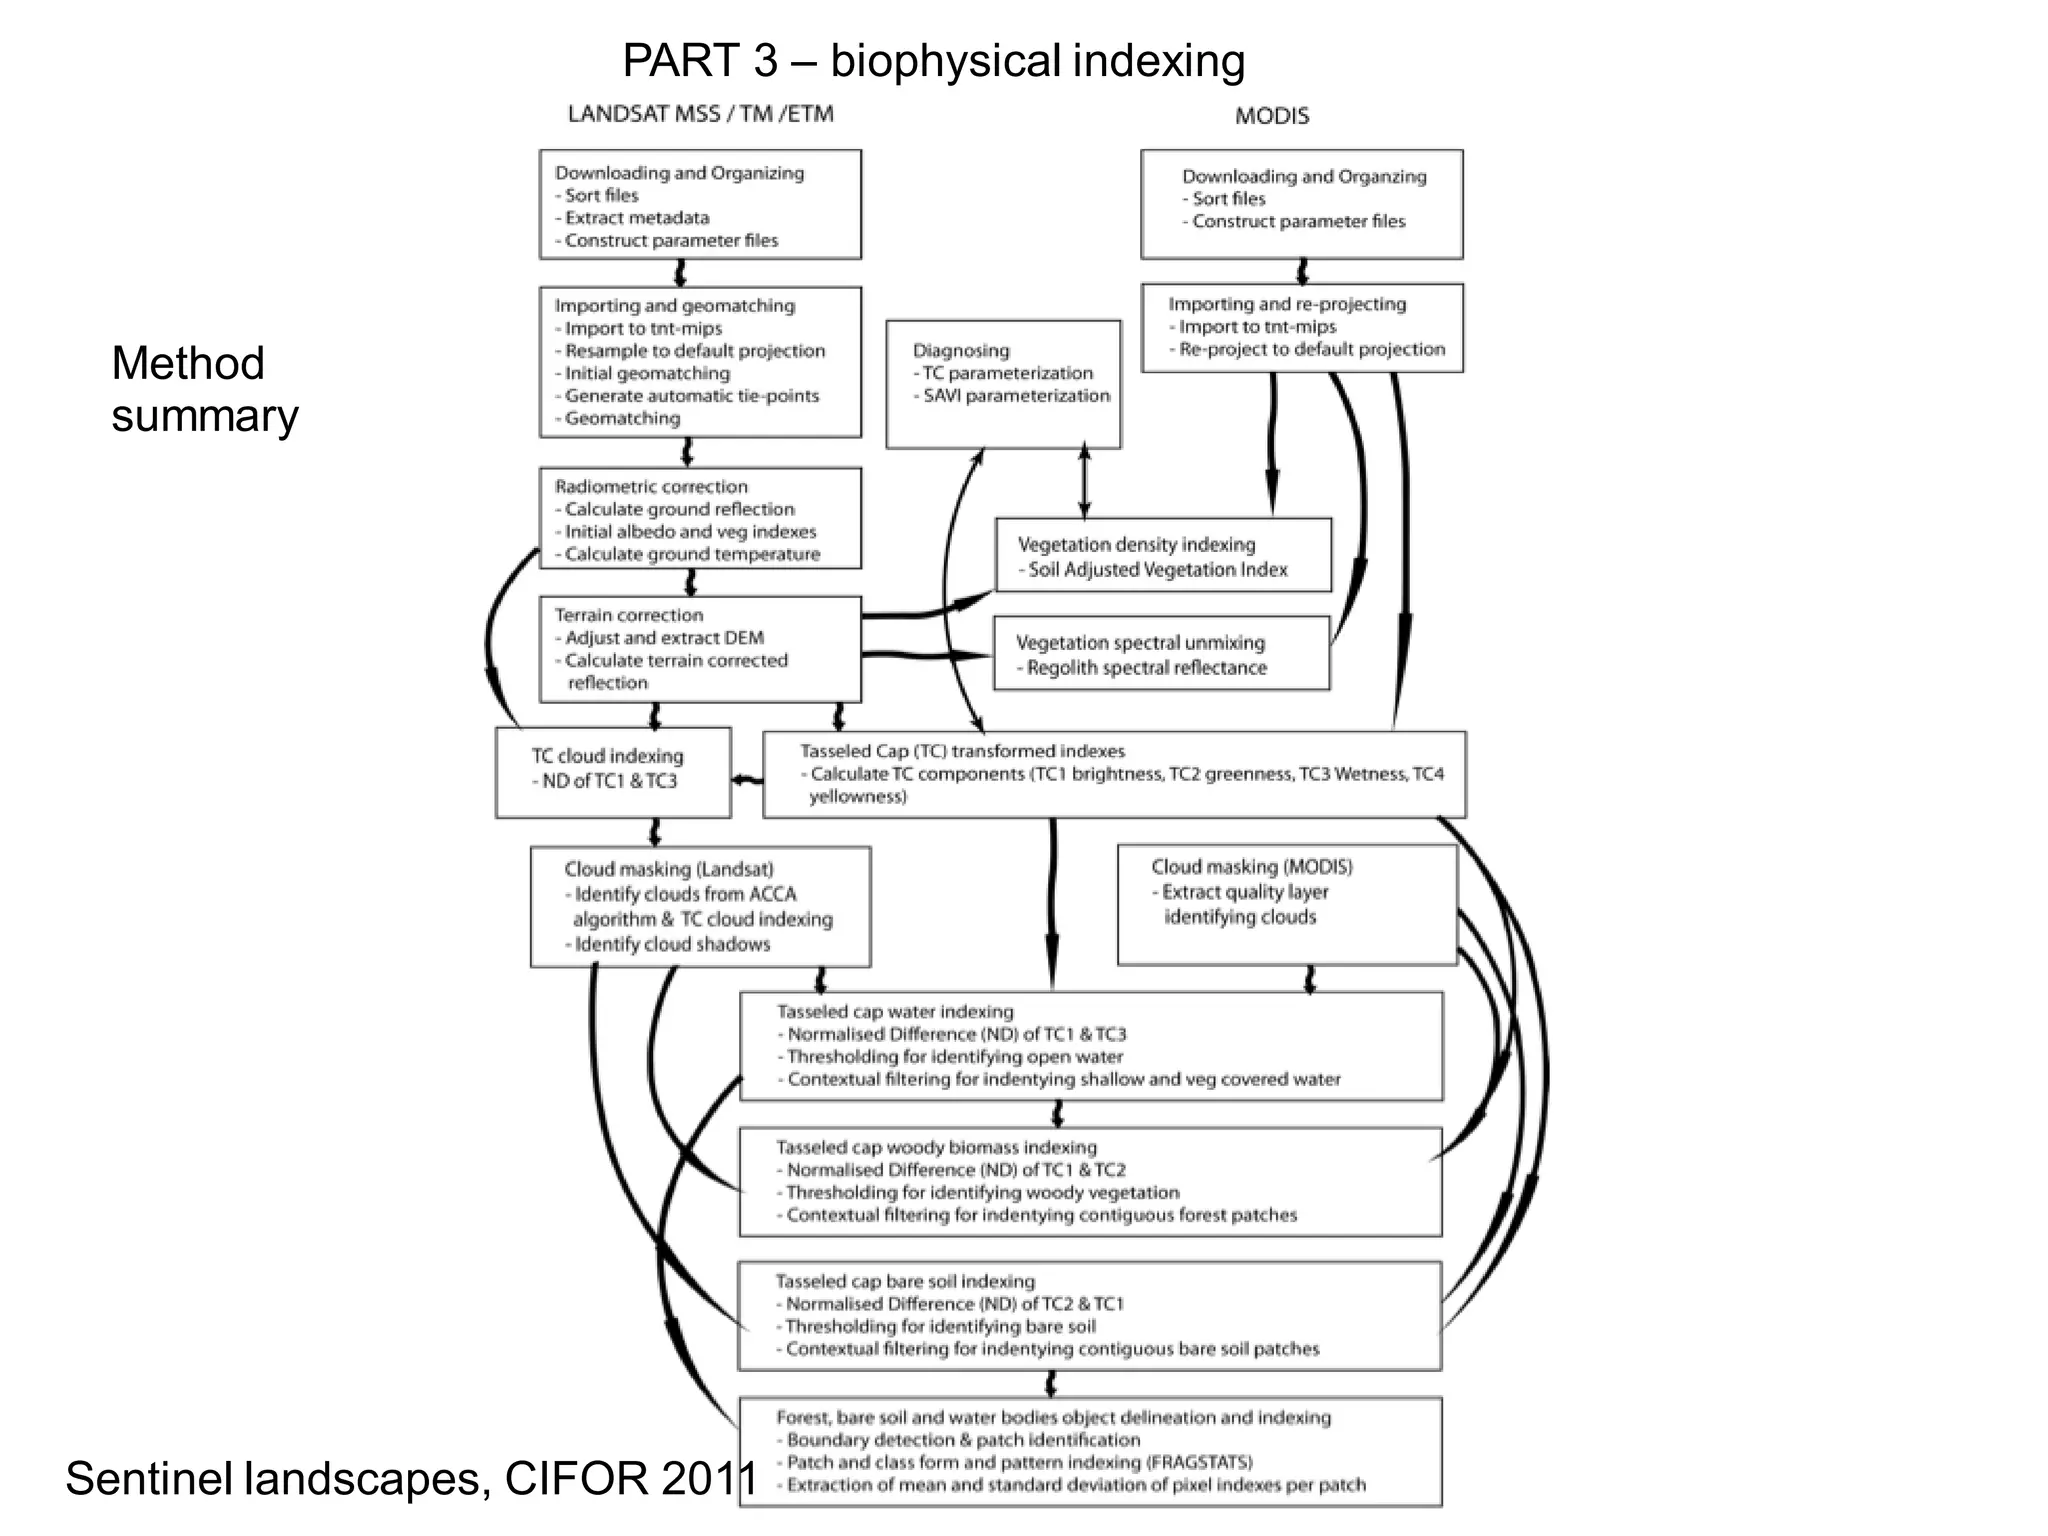
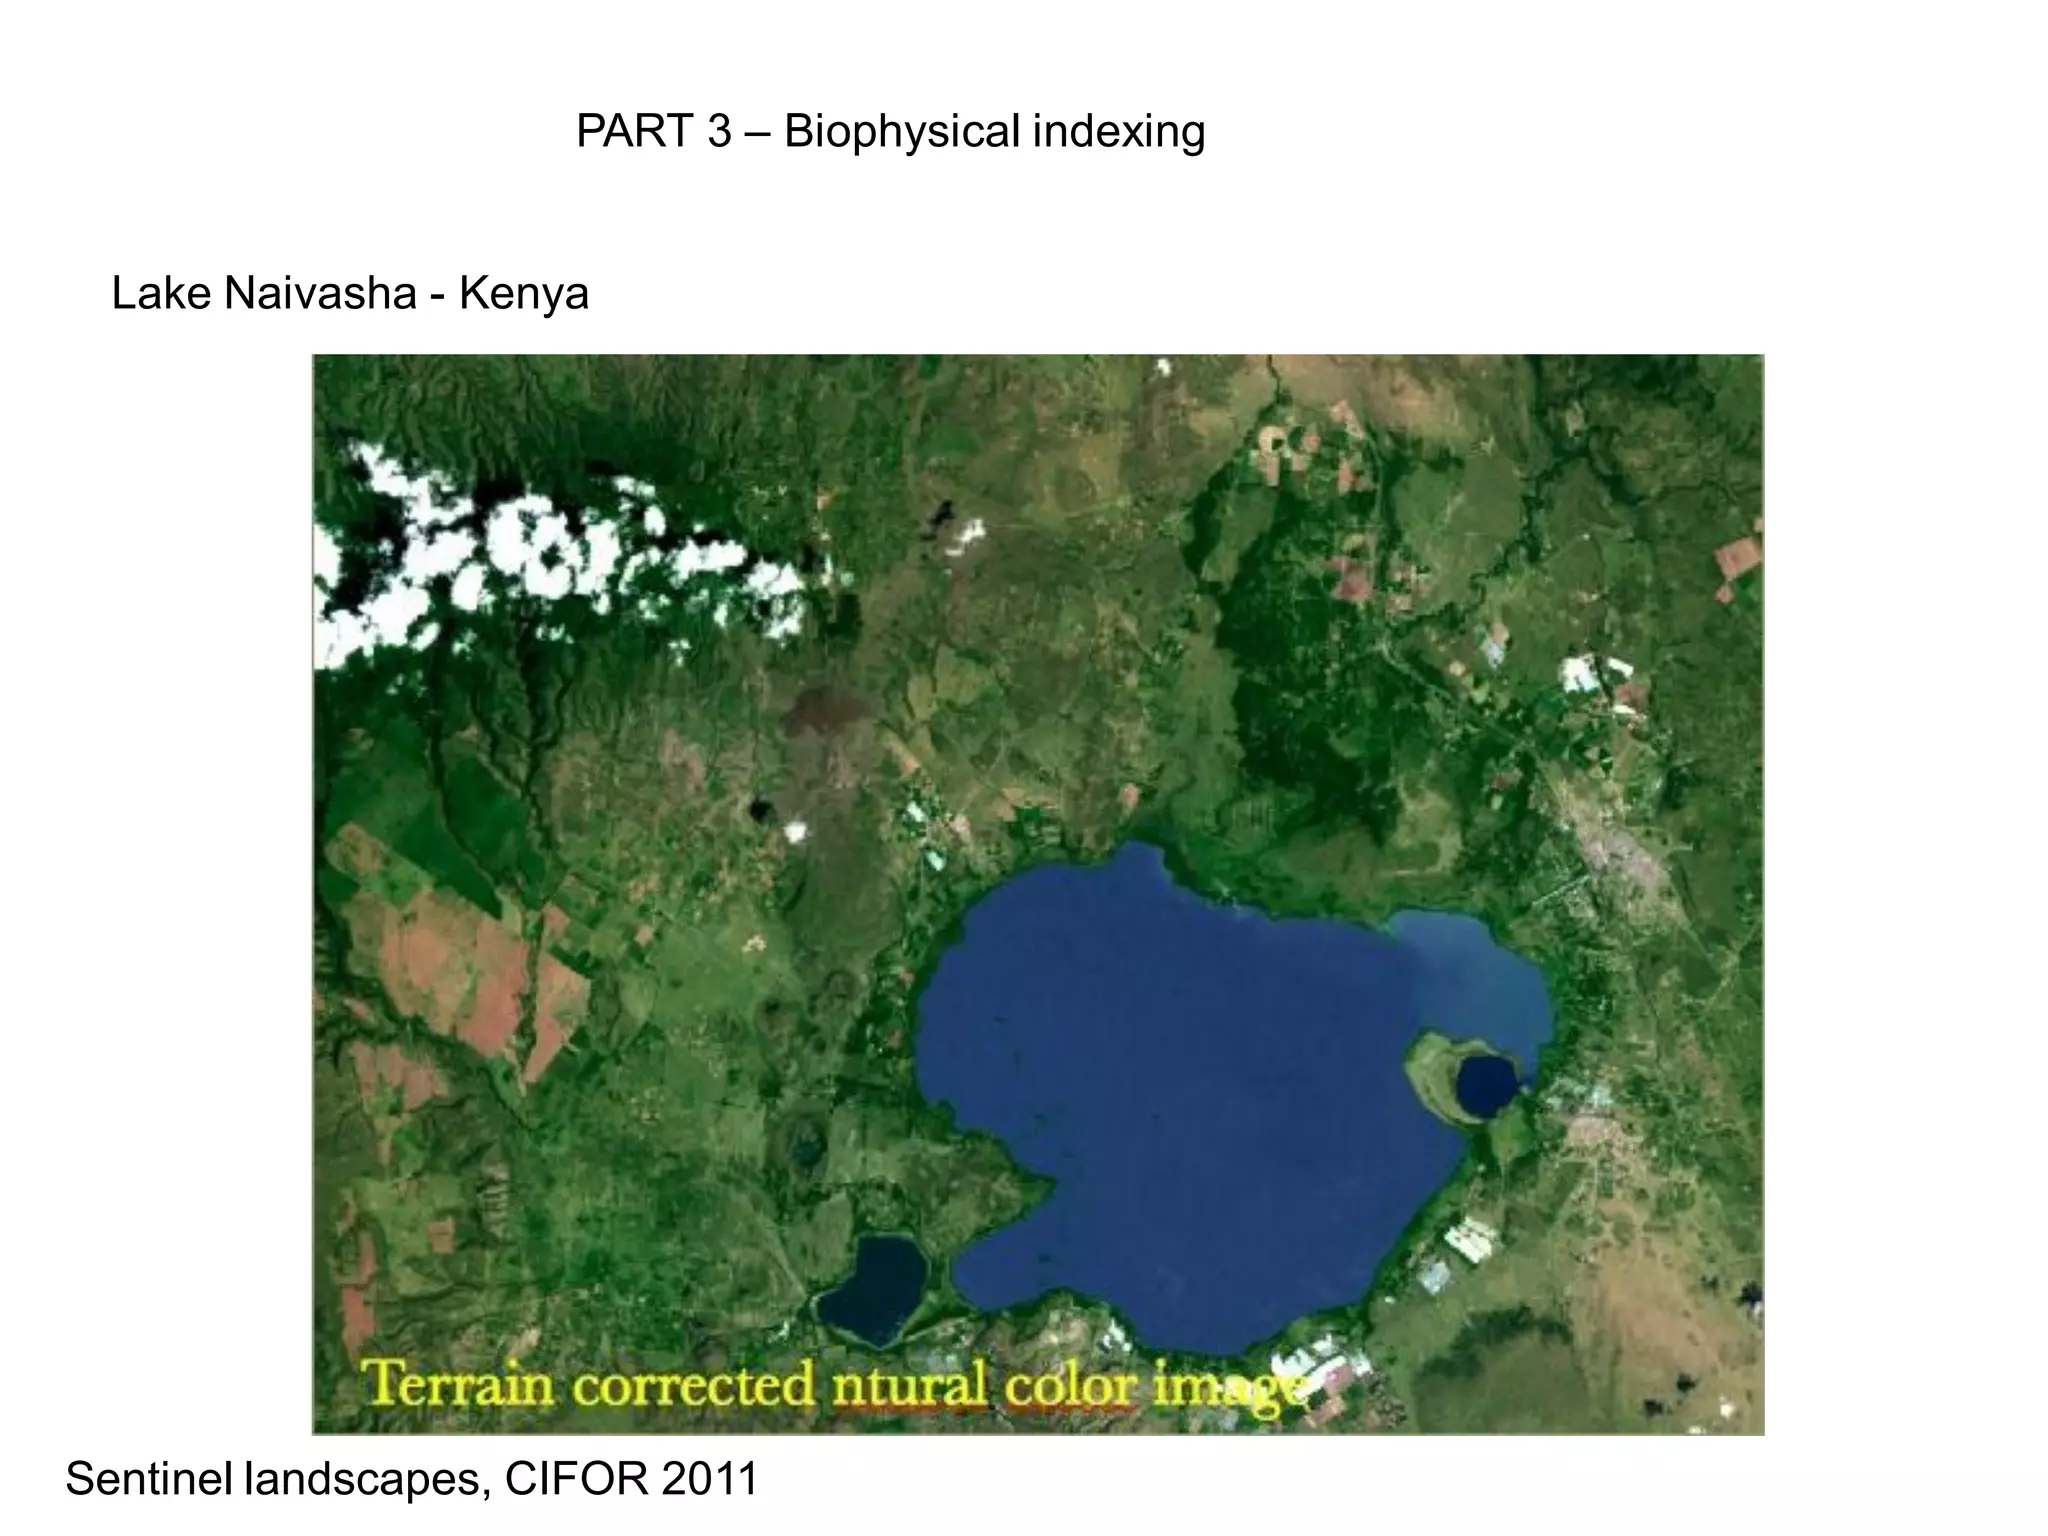
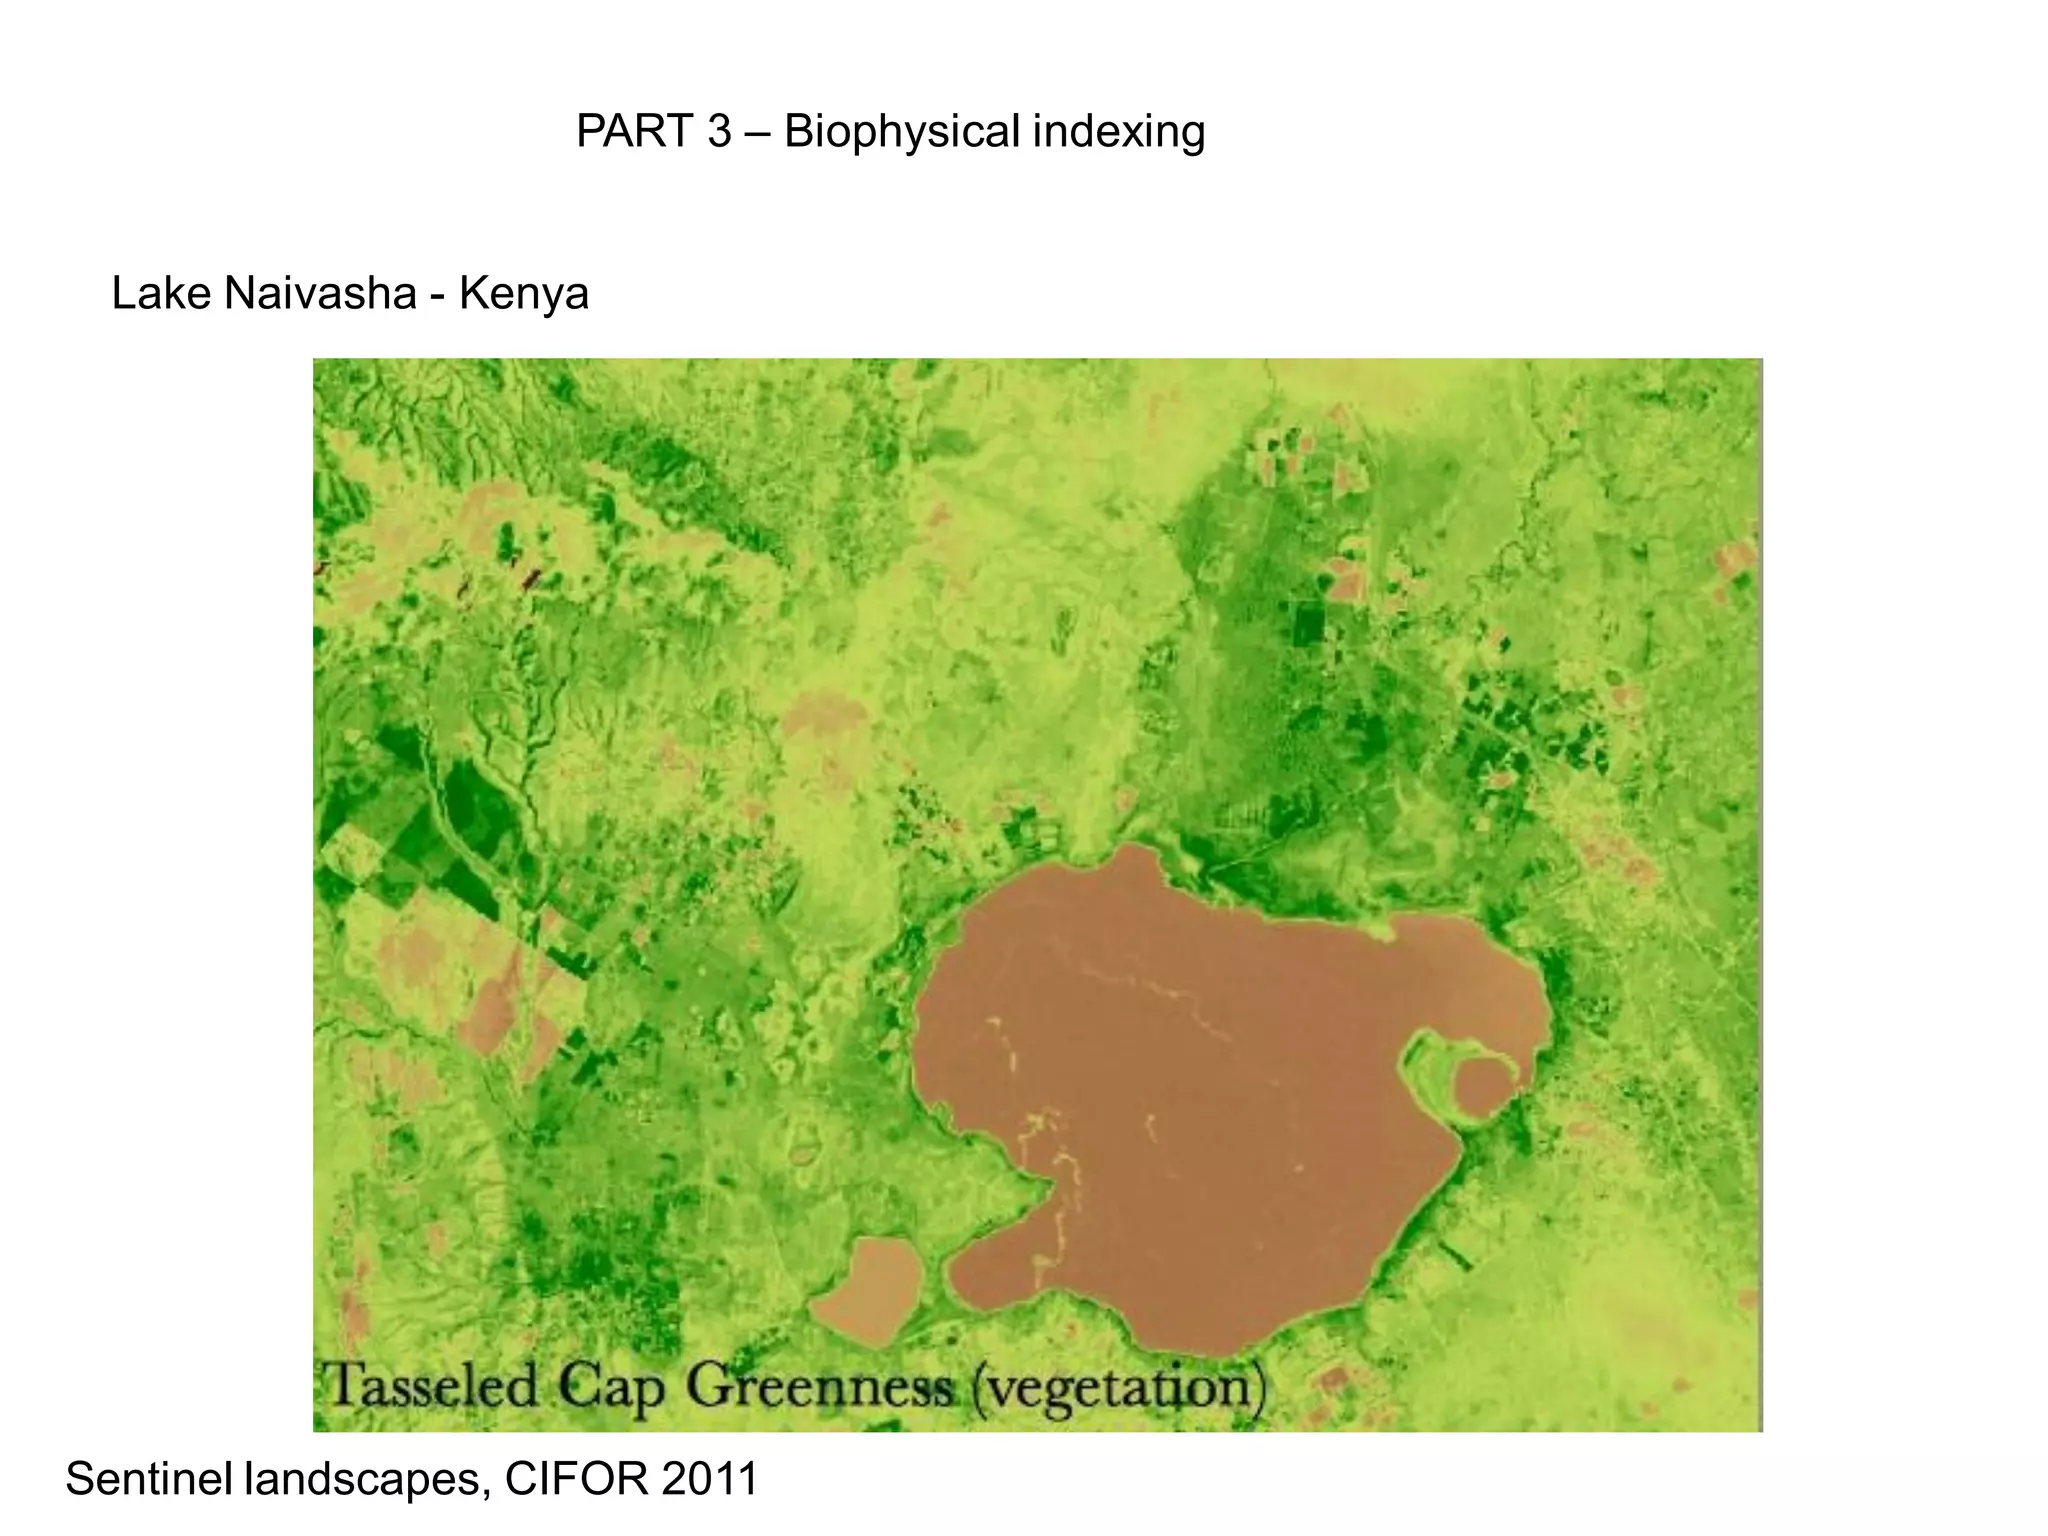
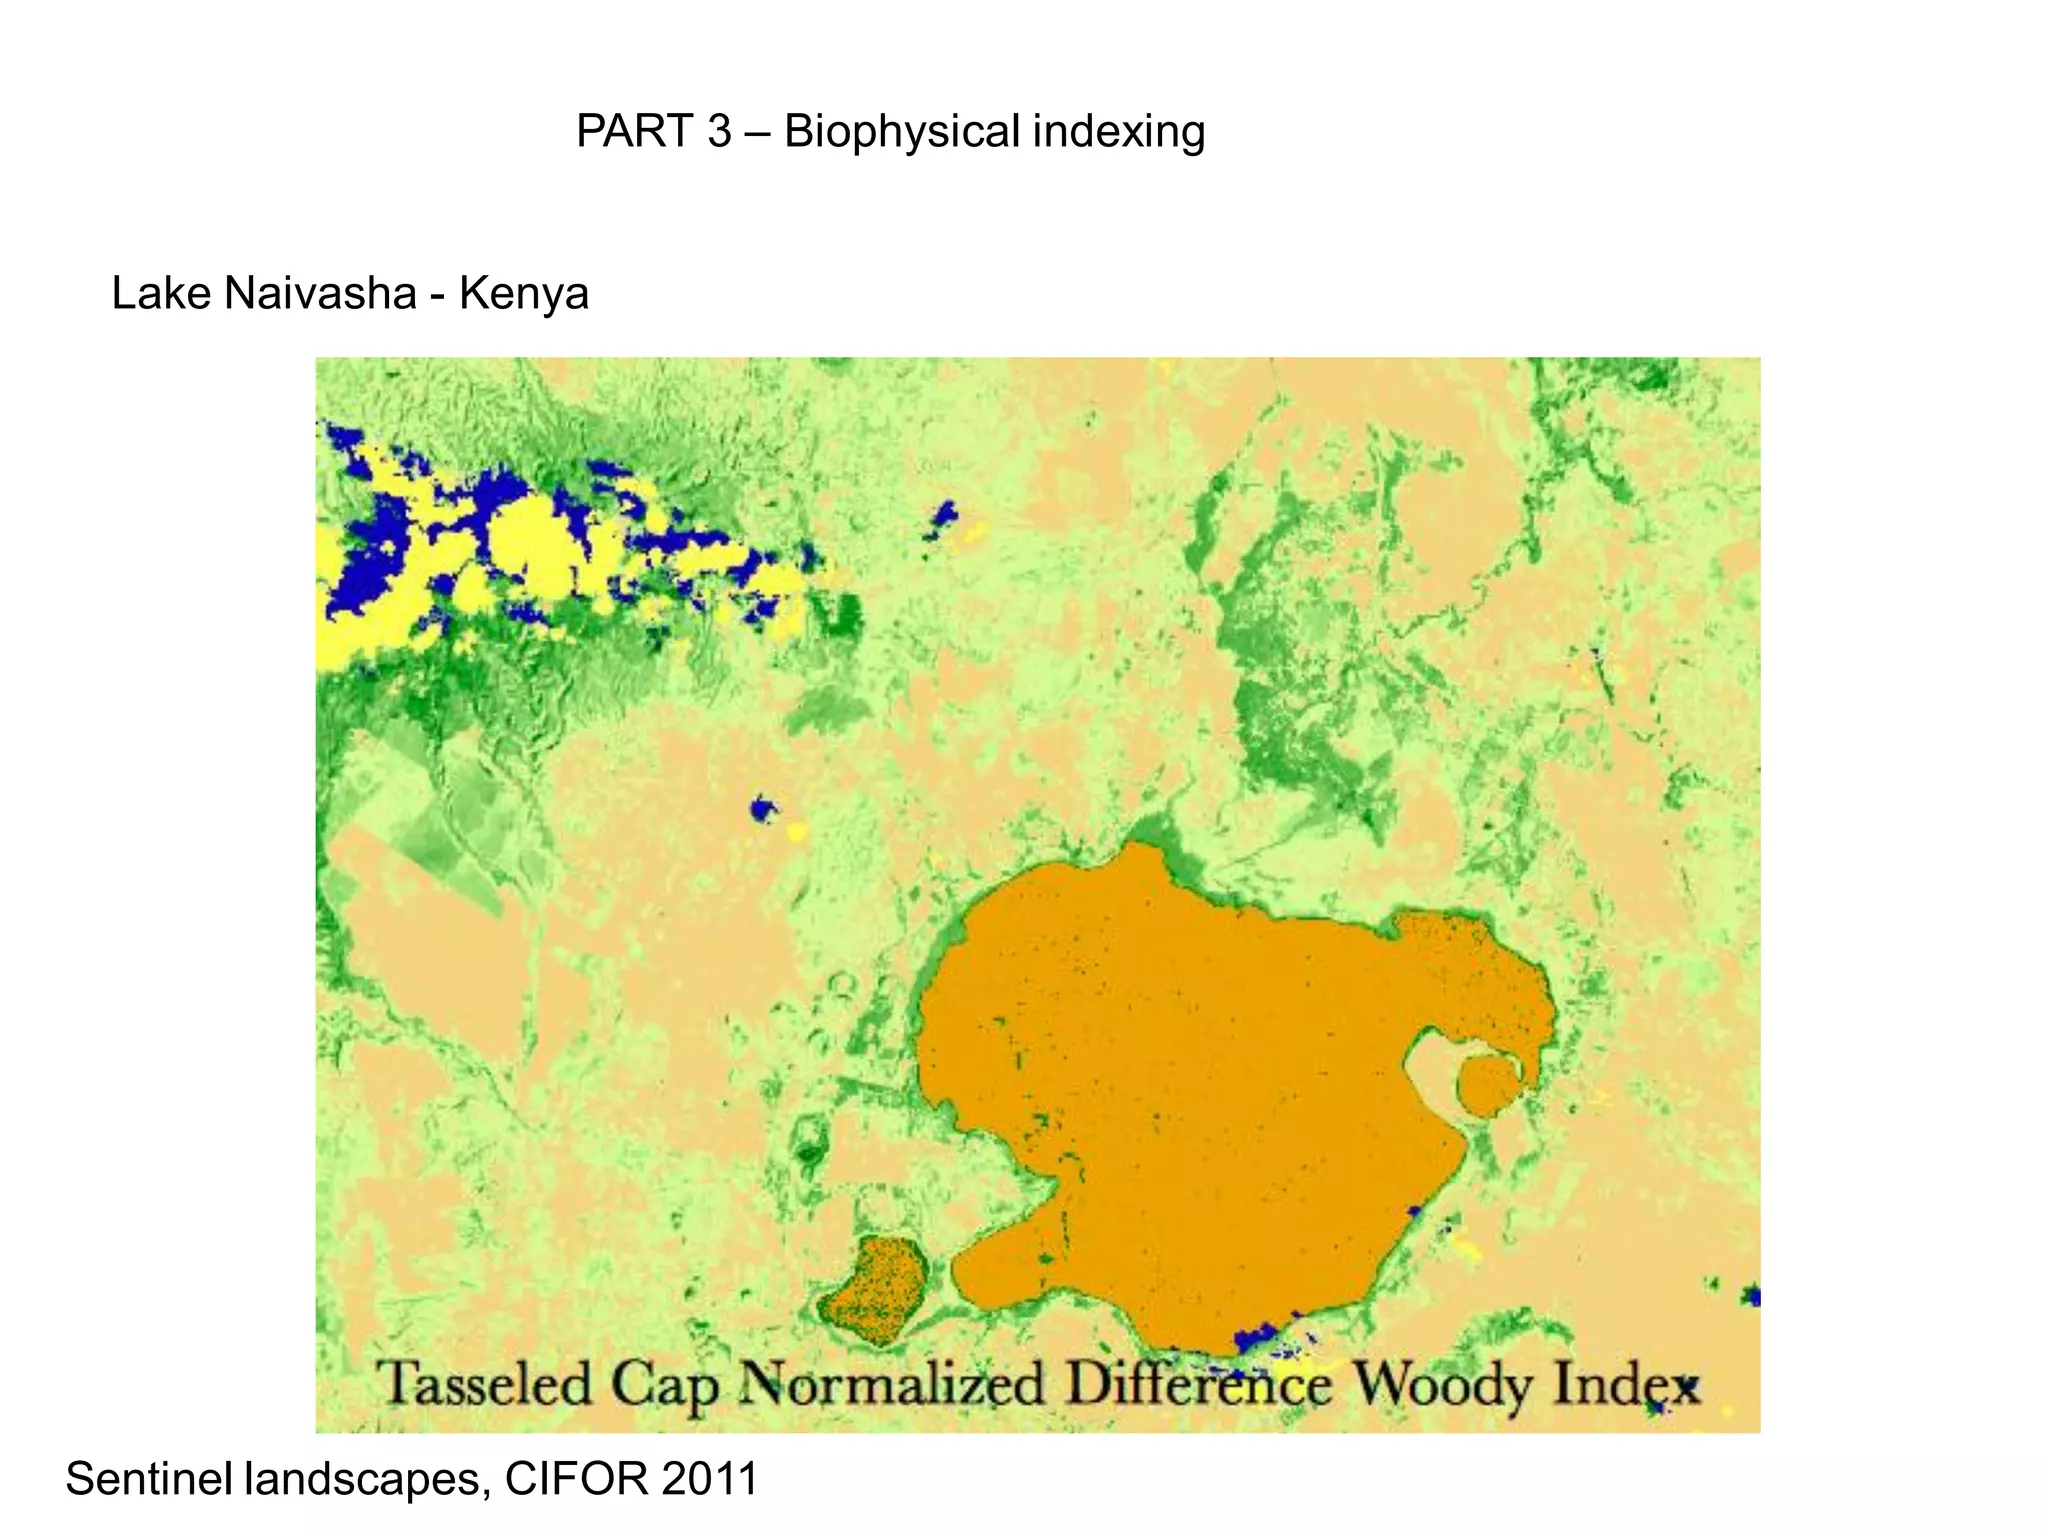
Remote Sensing as
     landscape inventory tool
              Thomas Gumbricht (ICRAF)


                                    Thomas Gumbricht
Sentinel landscapes, CIFOR 2011
PART 1 – A hierarchical approach


  Ecotope


                                                         Thomas Gumbticht
Sentinel landscapes, CIFOR 2011
PART 1 – A hierarchical approach


  Patch and hillslope


                                                           Thomas Gumbticht
Sentinel landscapes, CIFOR 2011
PART 1 – A hierarchical approach


  Basin


                                                         Thomas Gumbticht
Sentinel landscapes, CIFOR 2011
PART 1 – A hierarchical approach


  Continental


                                                         Thomas Gumbticht
Sentinel landscapes, CIFOR 2011
PART 1 – A hierarchical approach


  Africa Soil Information Service (AfSIS) – sentinel sites


                                                             Thomas Gumbticht
Sentinel landscapes, CIFOR 2011
PART 1 – A hierarchical approach


  Sentinel site
  design


Sentinel landscapes, CIFOR 2011
PART 2 – phenology monitoring


            Monitoring vegetation annual phenology
            from time series of satellite imagery


                                                      Thomas Gumbticht
Sentinel landscapes, CIFOR 2011
PART 2 – phenology monitoring

Deriving vegetation density data form satellite data – basic principles
PART 2 – phenology monitoring


      Method: Capturing the raw data

      To do phenology studies requires a large amount of input data. At HQ we are
      using an automated FTP engine (Expect) to search the MODIS Data Pool
      https://lpdaac.usgs.gov/get_data/data_pool
      For the data we need.


Sentinel landscapes, CIFOR 2011
PART 2 – phenology monitoring


      Cleaning and smoothing the annual time-series


Sentinel landscapes, CIFOR 2011
PART 2 – phenology monitoring


      Extracting annual phenology

      For the annual vegetation phenology, we extract 11 indexes:

      1.      The annual average vegetation density
      2.      The annual maximum vegetation density
      3.      The annual minimum vegetation density
      4.      The annual limit for vegetation green up
      5.      The accumulated vegetation growth over the growing season(s)
      6.      The incremental vegetation growth over the growing seasons(s)
      7.      The length of the growing season(s)
      8.      The length of the green up phase of the growing season
      9.      The annual day of year for the start of the first growing season
      10.     The annual day of year for the peak of the vegetation density
      11.     The number of growing seasons

      The first three indexes are based on the total annual vegetation cycle. The limit for
      vegetation green up is calculated per annum, and based on a ratio definition:

      EVIratio = (EVI - EVImin)/(EVImax – EVImin),


Sentinel landscapes, CIFOR 2011
PART 2 – phenology monitoring


      Method: Extracting annual phenology

      The annual average vegetation density
      The annual maximum vegetation density


      Annual average vegetation density       Annual maximum vegetation density


Sentinel landscapes, CIFOR 2011
PART 2 – phenology monitoring


      Method: Extracting annual phenology

      The annual day of year for the start of the first growing season
      The annual day of year for the peak of the vegetation density


      Length of growing season                        Length of greening up period


Sentinel landscapes, CIFOR 2011
PART 2 – phenology monitoring
Method: Land use and land cover mapping

The phenology data generated from annual time series of satellite images
can be used for mapping land cover and land use. The phenology curve can
be be used to differentiate vegetation types that can not be distinguished in a
single scene of multi-spectral image data. I.e. Forests of different types, as
well as grasslands and various agricultural crops have different phenology.
To actual classify land use and land cover from phenology, we need to
develop a library of typical phenology patterns. For this we need to develop
field surveys or use phenology patterns reported in the literature.
Other indexes that could be used for analyzing annual variations like phenology
  Rainfall (can be obtained from a combination of station data and Remote Sensing)


  Temperature (available from the MODIS sensor)
  


  Surface wetness (index can be generated from MODIS reflectance and emissivity data)
  


Sentinel landscapes, CIFOR 2011
PART 3 – biophysical indexing


  Method
  summary


Sentinel landscapes, CIFOR 2011
PART 3 – Biophysical indexing


  Lake Naivasha - Kenya


Sentinel landscapes, CIFOR 2011
PART 3 – Biophysical indexing


  Lake Naivasha - Kenya


Sentinel landscapes, CIFOR 2011
PART 3 – Biophysical indexing


  Lake Naivasha - Kenya


Sentinel landscapes, CIFOR 2011
PART 3 – Biophysical indexing


  Lake Naivasha - Kenya


Sentinel landscapes, CIFOR 2011
PART 3 – Biophysical indexing


  Lake Naivasha - Kenya


Sentinel landscapes, CIFOR 2011
PART 3 – Biophysical indexing


  Lake Naivasha - Kenya


Sentinel landscapes, CIFOR 2011
PART 3 – Biophysical indexing


  Lake Naivasha - Kenya


Sentinel landscapes, CIFOR 2011
Mount Kilimanjaro - Kenya


Sentinel landscapes, CIFOR 2011
PART 4 – Databases and data sharing


  Web client 1:
  Google Earth


Sentinel landscapes, CIFOR 2011
PART 4 – Databases and data sharing


Web client 2:
Openlayers


 Sentinel landscapes, CIFOR 2011
PART 4 – Databases and data sharing


        Desktop client
        QGIS


Sentinel landscapes, CIFOR 2011

Remote sensing as landscape inventory tool

  • 1.
    Remote Sensing as landscape inventory tool Thomas Gumbricht (ICRAF) Thomas Gumbricht Sentinel landscapes, CIFOR 2011
  • 2.
    PART 1 –A hierarchical approach Ecotope Thomas Gumbticht Sentinel landscapes, CIFOR 2011
  • 3.
    PART 1 –A hierarchical approach Patch and hillslope Thomas Gumbticht Sentinel landscapes, CIFOR 2011
  • 4.
    PART 1 –A hierarchical approach Basin Thomas Gumbticht Sentinel landscapes, CIFOR 2011
  • 5.
    PART 1 –A hierarchical approach Continental Thomas Gumbticht Sentinel landscapes, CIFOR 2011
  • 6.
    PART 1 –A hierarchical approach Africa Soil Information Service (AfSIS) – sentinel sites Thomas Gumbticht Sentinel landscapes, CIFOR 2011
  • 7.
    PART 1 –A hierarchical approach Sentinel site design Sentinel landscapes, CIFOR 2011
  • 8.
    PART 2 –phenology monitoring Monitoring vegetation annual phenology from time series of satellite imagery Thomas Gumbticht Sentinel landscapes, CIFOR 2011
  • 9.
    PART 2 –phenology monitoring Deriving vegetation density data form satellite data – basic principles
  • 10.
    PART 2 –phenology monitoring Method: Capturing the raw data To do phenology studies requires a large amount of input data. At HQ we are using an automated FTP engine (Expect) to search the MODIS Data Pool https://lpdaac.usgs.gov/get_data/data_pool For the data we need. Sentinel landscapes, CIFOR 2011
  • 11.
    PART 2 –phenology monitoring Cleaning and smoothing the annual time-series Sentinel landscapes, CIFOR 2011
  • 12.
    PART 2 –phenology monitoring Extracting annual phenology For the annual vegetation phenology, we extract 11 indexes: 1. The annual average vegetation density 2. The annual maximum vegetation density 3. The annual minimum vegetation density 4. The annual limit for vegetation green up 5. The accumulated vegetation growth over the growing season(s) 6. The incremental vegetation growth over the growing seasons(s) 7. The length of the growing season(s) 8. The length of the green up phase of the growing season 9. The annual day of year for the start of the first growing season 10. The annual day of year for the peak of the vegetation density 11. The number of growing seasons The first three indexes are based on the total annual vegetation cycle. The limit for vegetation green up is calculated per annum, and based on a ratio definition: EVIratio = (EVI - EVImin)/(EVImax – EVImin), Sentinel landscapes, CIFOR 2011
  • 13.
    PART 2 –phenology monitoring Method: Extracting annual phenology The annual average vegetation density The annual maximum vegetation density Annual average vegetation density Annual maximum vegetation density Sentinel landscapes, CIFOR 2011
  • 14.
    PART 2 –phenology monitoring Method: Extracting annual phenology The annual day of year for the start of the first growing season The annual day of year for the peak of the vegetation density Length of growing season Length of greening up period Sentinel landscapes, CIFOR 2011
  • 15.
    PART 2 –phenology monitoring Method: Land use and land cover mapping The phenology data generated from annual time series of satellite images can be used for mapping land cover and land use. The phenology curve can be be used to differentiate vegetation types that can not be distinguished in a single scene of multi-spectral image data. I.e. Forests of different types, as well as grasslands and various agricultural crops have different phenology. To actual classify land use and land cover from phenology, we need to develop a library of typical phenology patterns. For this we need to develop field surveys or use phenology patterns reported in the literature.
  • 16.
    Other indexes thatcould be used for analyzing annual variations like phenology Rainfall (can be obtained from a combination of station data and Remote Sensing) Temperature (available from the MODIS sensor)  Surface wetness (index can be generated from MODIS reflectance and emissivity data)  Sentinel landscapes, CIFOR 2011
  • 17.
    PART 3 –biophysical indexing Method summary Sentinel landscapes, CIFOR 2011
  • 18.
    PART 3 –Biophysical indexing Lake Naivasha - Kenya Sentinel landscapes, CIFOR 2011
  • 19.
    PART 3 –Biophysical indexing Lake Naivasha - Kenya Sentinel landscapes, CIFOR 2011
  • 20.
    PART 3 –Biophysical indexing Lake Naivasha - Kenya Sentinel landscapes, CIFOR 2011
  • 21.
    PART 3 –Biophysical indexing Lake Naivasha - Kenya Sentinel landscapes, CIFOR 2011
  • 22.
    PART 3 –Biophysical indexing Lake Naivasha - Kenya Sentinel landscapes, CIFOR 2011
  • 23.
    PART 3 –Biophysical indexing Lake Naivasha - Kenya Sentinel landscapes, CIFOR 2011
  • 24.
    PART 3 –Biophysical indexing Lake Naivasha - Kenya Sentinel landscapes, CIFOR 2011
  • 25.
  • 26.
    Mount Kilimanjaro -Kenya Sentinel landscapes, CIFOR 2011
  • 27.
    PART 4 –Databases and data sharing Web client 1: Google Earth Sentinel landscapes, CIFOR 2011
  • 28.
    PART 4 –Databases and data sharing Web client 2: Openlayers Sentinel landscapes, CIFOR 2011
  • 29.
    PART 4 –Databases and data sharing Desktop client QGIS Sentinel landscapes, CIFOR 2011