Download to read offline
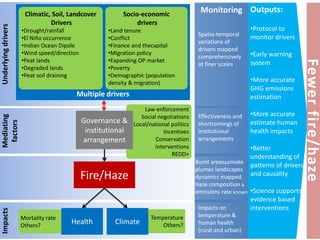

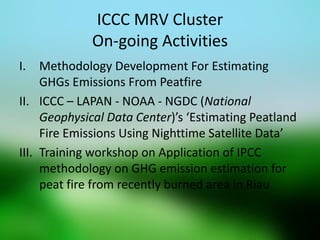
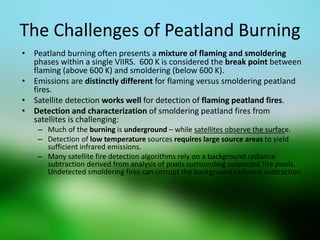

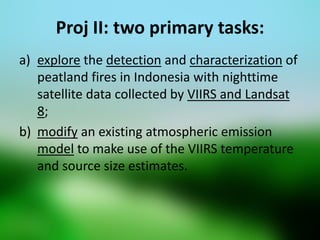
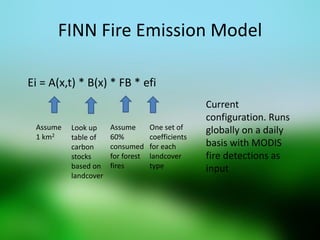
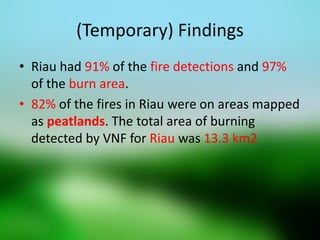


The document discusses ICCC activities related to developing methodologies for monitoring drivers of fires and haze in Indonesia and estimating greenhouse gas emissions. Key outputs include protocols for monitoring drivers, an early warning system, and more accurate estimates of emissions, human health impacts, and patterns of drivers. It also summarizes challenges in detecting smoldering peatland fires using satellites and presents preliminary findings from a project using nighttime satellite data to estimate peatland fire emissions.