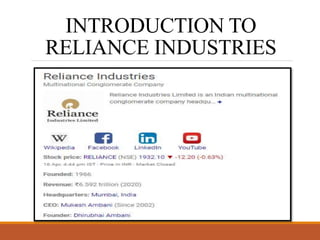
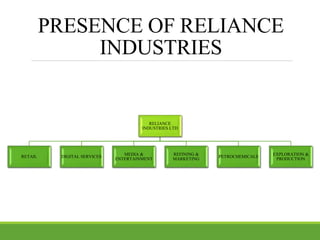
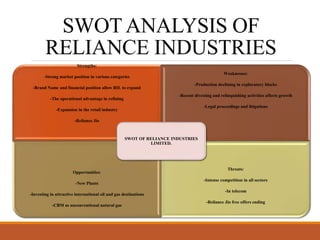
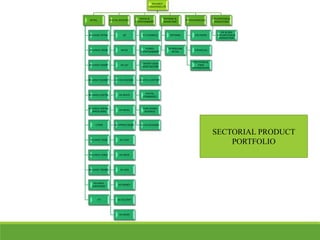
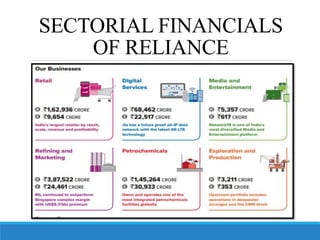
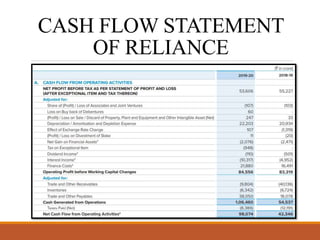
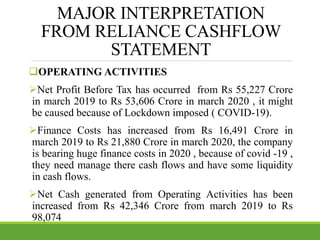
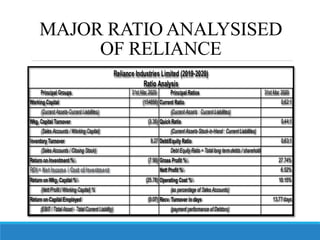
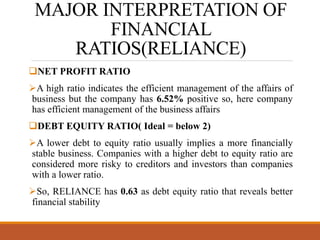
PREPARED BY : GONDALIYA HARD
ID.NO. : GG-054
CLASS : S.Y. MBA
INTRODUCTION TO
RELIANCE INDUSTRIES
MISSION ,VISION &
VALUES OF RELIANCE
MISSION
To provide the best and most value-adding advice within our advisory expertise areas
To be an independent sparring-partner and to provide excellent advice for our clients
within our advisory expertise areas
VISION
To be our clients’ first call and preferred collaboration partner within our advisory
expertise areas
To consistently exceed our clients’ expectations for professional and value-adding advice
VALUES : Quality, Innovation ,Ambition, Honesty &Integrity
PRESENCE OF RELIANCE
INDUSTRIES
RELIANCE
INDUSTRIES LTD
RETAIL DIGITAL SERVICES
MEDIA &
ENTERTAINMENT
REFINING &
MARKETING
PETROCHEMICALS
EXPLORATION &
PRODUCTION
MAJOR COMPETITORS TO
RELIANCE INDUSTRIES
COMPETITORS
RETAIL
Wal-Mart
Amazon
Alibaba
PETROLEUM
Sinopec
China National
Petroleum Corp.
(PetroChina)
Royal Dutch Shell
TELECOM/DIGITAL
SERVICES
Bharti Airtel Limited
Bharat Sanchar Nigam
Limited(BSNL)
Vodafone Idea (VI)
PETROCHEMICAL
Indian Oil Corporation
Gas Authority of India
Limited or GAIL
Haldia Petrochemicals
Limited
Finolex Ind
SWOT ANALYSIS OF
RELIANCE INDUSTRIES
Strengths:
-Strong market position in various categories
-Brand Name and financial position allow RIL to expand
-The operational advantage in refining
-Expansion in the retail industry
-Reliance Jio
Weaknesses:
-Production declining in exploratory blocks
-Recent divesting and relinquishing activities affects growth
-Legal proceedings and litigations
Opportunities:
-New Plants
-Investing in attractive international oil and gas destinations
-CBM as unconventional natural gas
Threats:
-Intense competition in all sectors
-In telecom
-Reliance Jio free offers ending
SWOT OF RELIANCE INDUSTRIES
LIMITED.
RELIANCE
INDUSTRIES LTD
RETAIL
RELIANCE RETAIL
RELIANCE FRESH
RELIANCE SMART
RELIANCE MARKET
RELIANCE DIGITAL
RELIANCE DIGITAL
XPRESS MINI
I STORE
RELIANCE RESQ
RELIANCE JEWLS
RELIANCE TRENDS
RELIANCE
FOOTPRINT
LYF
DIGITAL SERVICES
JIO
MYJIO
JIO LAY
JIO ON DEMAND
JIO BEATS
JIO MAGS
JIO XPRESS NEWS
JIO CHAT
JIO DRIVE
JIO JOIN
JIO MONEY
JIO SECURITY
JIO NEWS
MEDIA &
ENTERTAINMENT
TV CHANNELS
FILMED
ENTERTAINMENT
CONTENT ASSET
MONETIZATION
DIGITAL CONTENT
DIGITAL
COMMERCE
PUBILISHING
BUSINESS
ALLIED BUSINESS
REFINING &
MARKETING
REFINING
PETROLEUM
RETAIL
PETROCHEMICALS
POLYMERS
CHEMICALS
POLYSTERS &
FIBER
INTERMEDIATES
EXPLORATION &
PRODUCTION
OIL & GAS
EXPLORATION &
PRODUCTION
SECTORIAL PRODUCT
PORTFOLIO
SUCCESS STRATEGY
IDENTIFIED
The company adopted the aggressive and selective pricing
policing strategy; and focuses on the market analysis. With
the help of Jio the telecom brand of Reliance, the company
tries to digitalize India.
One of the main parts of their marketing strategy is the
Promotional strategy. They spend a lesser amount for their
campaigns, but they reduce the product prices what help
them to attract more customer.
SECTORIAL FINANCIALS
OF RELIANCE
FINANCIALANALYSIS
(TOPIC PROFILE)
“Financial analysis is the process of evaluating businesses, projects, budgets,
and other finance-related transactions to determine their performance and
suitability.”
 TOOLS OF FINANCIALANALYSIS
TOOLS
OF
FINANCI
AL
ANALYSI
S
Cash
Flow
Analysis
Ratio
Analysis
Trend
Analysis
Common
Size
Statement
s
Comparat
ive
Statement
s
OBJECTIVES OF
FINANCIALANALYSIS
Reviewing the performance of a
company over the past periods
Assessing the current position &
operational efficiency
Predicting growth & profitability
prospects
Loan Decision by Financial Institutions
and Banks
LIMITATION OF
FINANCIALANALYSIS
 Intangible assets not recorded. Firms do not record many
intangible assets. Instead, any expenditure made to create an
intangible asset are immediately charged to expense.
 Firms consider only the monetary aspects of the financial
statements.
Firms prepare the financial statements on the basis of on-
going concept, as such, it does not reflect the current
position.
 The statements do not necessarily provide any value in
predicting what will happen in the future.
CASH FLOW ANALYSIS
“Cash flow analysis is a financial statement that
records how money flows into and out of your business
during a specific predetermined period of time.
 It can help you better understand where your money is
going and how much cash you have at any given time.
Operating activities: Operating inflows include money
received from sales/paid receivables. Operating outflows
include money paid to suppliers, employee payroll, any
taxes not related to investing or financing, and depreciation
or amortization of business assets.
CONTINUED...
Investment activities: This refers to the purchase
or sale of assets not related to day-to-day
operations, such as business equipment, real estate
or securities.
Financing activities: Issuing stock to
shareholders or buying it back, making payments on
a business loan, or distributing dividends are all
examples of financing activities.
CASH FLOW STATEMENT
OF RELIANCE
MAJOR INTERPRETATION
FROM RELIANCE CASHFLOW
STATEMENT
OPERATING ACTIVITIES
Net Profit Before Tax has occurred from Rs 55,227 Crore
in march 2019 to Rs 53,606 Crore in march 2020 , it might
be caused because of Lockdown imposed ( COVID-19).
Finance Costs has increased from Rs 16,491 Crore in
march 2019 to Rs 21,880 Crore in march 2020, the company
is bearing huge finance costs in 2020 , because of covid -19 ,
they need manage there cash flows and have some liquidity
in cash flows.
Net Cash generated from Operating Activities has been
increased from Rs 42,346 Crore from march 2019 to Rs
98,074
CONTINUED...
MAJOR INTERPRETATION
FROM RELIANCE
CASHFLOW STATEMENT
INVESTING ACTIVITIES
 Company has made Purchase of Property, Plant and
Equipment and Other Intangible Assets hence the Cash Flow
of company has reduced negatively from Rs ((93,626))
Crore in 2019 to Rs (76,517) Crore in 2020
Upfront Fibre Payment has incurred in 2020 of Rs (16,439)
Crore
 Net Cash Used in Investing Activities has decreased
negatively from Rs (95,128) Crore To Rs (75,717) Crore
CONTINUED...
MAJOR INTERPRETATION
FROM RELIANCE
CASHFLOW STATEMENT
FINANCING ACTIVITIES
Proceeds from Issue of Equity Share Capital has decreased
from Rs 117 Crore in 2019 To Rs 18 Crore in 2020
Interest Paid by RlL has negative increment from Rs
(23,338) Crore to Rs (28,508) Crore
Net Cash Used in Financing Activities in 2020 is Rs
(2,541) Crore
Net Increase in Cash and Cash Equivalents has
increased from Rs 3,124 Crore in 2019 to Rs 19,816
Crore in 2020
GRAPHICAL REPRESENTATION
OF CASHFLOW ACTIVITIES
98,074
42,346
-75,717
-95,128
-2,541
55,906
RS
IN
CRORES
2019-20 2018-19
Operating 98,074 42,346
Investing -75,717 -95,128
Financing -2,541 55,906
Cash Flow of Reliance
Operating Investing Financing
RATIO ANALYSIS
Ratio analysis is a quantitative method of gaining
insight into a company's liquidity, operational
efficiency, and profitability by studying its financial
statements such as the balance sheet and income
statement.
Ratio analysis compares line-item data from a
company's financial statements to reveal insights
regarding profitability, liquidity, operational efficiency,
and solvency.
MAJOR RATIO ANALYSISED
OF RELIANCE
Principal Groups 31st Mar 2020 Principal Ratios 31st Mar 2020
Working Capital (154656) Current Ratio 0.62:1
(Current Assets-Current Liabilities) (Current Assets : Current Liabilities)
Wkg. Capital Turnover (3.35) Quick Ratio 0.44:1
(Sales Accounts / Working Capital) (Current Assets-Stock-in-Hand : Current Liabilities)
Inventory Turnover 8.27 Debt/Equity Ratio 0.63:1
(Sales Accounts / Closing Stock) Debt Equity Ratio = Total long term debts / shareholder' funds
Return on Investment % (7.90) Gross Profit % 27.74%
ROI = Net Income / Cost of Investment Nett Profit % 6.52%
Return on Wkg. Capital % (25.78) Operating Cost % 10.15%
(Nett Profit / Working Capital) % (as percentage of Sales Accounts)
Return on Capital Employed (0.07) Recv. Turnover in days 13.77 days
(EBIT / Total Asset - Total Current Liability) (payment performance of Debtors)
Reliance Industries Limited (2019-2020)
Ratio Analysis
MAJOR INTERPRETATION OF
FINANCIAL
RATIOS(RELIANCE)
NET PROFIT RATIO
A high ratio indicates the efficient management of the affairs of
business but the company has 6.52% positive so, here company
has efficient management of the business affairs
DEBT EQUITY RATIO( Ideal = below 2)
A lower debt to equity ratio usually implies a more financially
stable business. Companies with a higher debt to equity ratio are
considered more risky to creditors and investors than companies
with a lower ratio.
So, RELIANCE has 0.63 as debt equity ratio that reveals better
financial stability
FINDINGS AND
CONCLUSION
Reliance is one of the most profitable companies in India, the
largest publicly traded company in India by market
capitalization, and the largest company in India as measured
by revenue after recently surpassing the government-
controlled Indian Oil Corporation. On 10 September 2020,
Reliance Industries became the first Indian company to cross
$200 billion in market capitalization.
But RIL has a great future ahead as they are expanding their
business & doing partnership with top companies like
Amazon, Facebook ,etc
Thus ,investment in RIL is good decision in the nearby future
BIBLIOGRAPHY
www.ibeg.org
Reliance Industries Limited (ril.com)
Petroleum Products, Petrol, Aviation Fuel, Lubricants Oil, Lpg Gas |
Reliance Petroleum
Reliance Retail
Jio 4G LTE Network - Experience High Speed 4G Mobile Internet !
Reliance ltd.

Reliance ltd.

  • 1.
    PREPARED BY :GONDALIYA HARD ID.NO. : GG-054 CLASS : S.Y. MBA
  • 2.
  • 3.
    MISSION ,VISION & VALUESOF RELIANCE MISSION To provide the best and most value-adding advice within our advisory expertise areas To be an independent sparring-partner and to provide excellent advice for our clients within our advisory expertise areas VISION To be our clients’ first call and preferred collaboration partner within our advisory expertise areas To consistently exceed our clients’ expectations for professional and value-adding advice VALUES : Quality, Innovation ,Ambition, Honesty &Integrity
  • 4.
    PRESENCE OF RELIANCE INDUSTRIES RELIANCE INDUSTRIESLTD RETAIL DIGITAL SERVICES MEDIA & ENTERTAINMENT REFINING & MARKETING PETROCHEMICALS EXPLORATION & PRODUCTION
  • 5.
    MAJOR COMPETITORS TO RELIANCEINDUSTRIES COMPETITORS RETAIL Wal-Mart Amazon Alibaba PETROLEUM Sinopec China National Petroleum Corp. (PetroChina) Royal Dutch Shell TELECOM/DIGITAL SERVICES Bharti Airtel Limited Bharat Sanchar Nigam Limited(BSNL) Vodafone Idea (VI) PETROCHEMICAL Indian Oil Corporation Gas Authority of India Limited or GAIL Haldia Petrochemicals Limited Finolex Ind
  • 6.
    SWOT ANALYSIS OF RELIANCEINDUSTRIES Strengths: -Strong market position in various categories -Brand Name and financial position allow RIL to expand -The operational advantage in refining -Expansion in the retail industry -Reliance Jio Weaknesses: -Production declining in exploratory blocks -Recent divesting and relinquishing activities affects growth -Legal proceedings and litigations Opportunities: -New Plants -Investing in attractive international oil and gas destinations -CBM as unconventional natural gas Threats: -Intense competition in all sectors -In telecom -Reliance Jio free offers ending SWOT OF RELIANCE INDUSTRIES LIMITED.
  • 7.
    RELIANCE INDUSTRIES LTD RETAIL RELIANCE RETAIL RELIANCEFRESH RELIANCE SMART RELIANCE MARKET RELIANCE DIGITAL RELIANCE DIGITAL XPRESS MINI I STORE RELIANCE RESQ RELIANCE JEWLS RELIANCE TRENDS RELIANCE FOOTPRINT LYF DIGITAL SERVICES JIO MYJIO JIO LAY JIO ON DEMAND JIO BEATS JIO MAGS JIO XPRESS NEWS JIO CHAT JIO DRIVE JIO JOIN JIO MONEY JIO SECURITY JIO NEWS MEDIA & ENTERTAINMENT TV CHANNELS FILMED ENTERTAINMENT CONTENT ASSET MONETIZATION DIGITAL CONTENT DIGITAL COMMERCE PUBILISHING BUSINESS ALLIED BUSINESS REFINING & MARKETING REFINING PETROLEUM RETAIL PETROCHEMICALS POLYMERS CHEMICALS POLYSTERS & FIBER INTERMEDIATES EXPLORATION & PRODUCTION OIL & GAS EXPLORATION & PRODUCTION SECTORIAL PRODUCT PORTFOLIO
  • 8.
    SUCCESS STRATEGY IDENTIFIED The companyadopted the aggressive and selective pricing policing strategy; and focuses on the market analysis. With the help of Jio the telecom brand of Reliance, the company tries to digitalize India. One of the main parts of their marketing strategy is the Promotional strategy. They spend a lesser amount for their campaigns, but they reduce the product prices what help them to attract more customer.
  • 9.
  • 10.
    FINANCIALANALYSIS (TOPIC PROFILE) “Financial analysisis the process of evaluating businesses, projects, budgets, and other finance-related transactions to determine their performance and suitability.”  TOOLS OF FINANCIALANALYSIS TOOLS OF FINANCI AL ANALYSI S Cash Flow Analysis Ratio Analysis Trend Analysis Common Size Statement s Comparat ive Statement s
  • 11.
    OBJECTIVES OF FINANCIALANALYSIS Reviewing theperformance of a company over the past periods Assessing the current position & operational efficiency Predicting growth & profitability prospects Loan Decision by Financial Institutions and Banks
  • 12.
    LIMITATION OF FINANCIALANALYSIS  Intangibleassets not recorded. Firms do not record many intangible assets. Instead, any expenditure made to create an intangible asset are immediately charged to expense.  Firms consider only the monetary aspects of the financial statements. Firms prepare the financial statements on the basis of on- going concept, as such, it does not reflect the current position.  The statements do not necessarily provide any value in predicting what will happen in the future.
  • 13.
    CASH FLOW ANALYSIS “Cashflow analysis is a financial statement that records how money flows into and out of your business during a specific predetermined period of time.  It can help you better understand where your money is going and how much cash you have at any given time. Operating activities: Operating inflows include money received from sales/paid receivables. Operating outflows include money paid to suppliers, employee payroll, any taxes not related to investing or financing, and depreciation or amortization of business assets.
  • 14.
    CONTINUED... Investment activities: Thisrefers to the purchase or sale of assets not related to day-to-day operations, such as business equipment, real estate or securities. Financing activities: Issuing stock to shareholders or buying it back, making payments on a business loan, or distributing dividends are all examples of financing activities.
  • 15.
  • 16.
    MAJOR INTERPRETATION FROM RELIANCECASHFLOW STATEMENT OPERATING ACTIVITIES Net Profit Before Tax has occurred from Rs 55,227 Crore in march 2019 to Rs 53,606 Crore in march 2020 , it might be caused because of Lockdown imposed ( COVID-19). Finance Costs has increased from Rs 16,491 Crore in march 2019 to Rs 21,880 Crore in march 2020, the company is bearing huge finance costs in 2020 , because of covid -19 , they need manage there cash flows and have some liquidity in cash flows. Net Cash generated from Operating Activities has been increased from Rs 42,346 Crore from march 2019 to Rs 98,074
  • 17.
  • 18.
    MAJOR INTERPRETATION FROM RELIANCE CASHFLOWSTATEMENT INVESTING ACTIVITIES  Company has made Purchase of Property, Plant and Equipment and Other Intangible Assets hence the Cash Flow of company has reduced negatively from Rs ((93,626)) Crore in 2019 to Rs (76,517) Crore in 2020 Upfront Fibre Payment has incurred in 2020 of Rs (16,439) Crore  Net Cash Used in Investing Activities has decreased negatively from Rs (95,128) Crore To Rs (75,717) Crore
  • 19.
  • 20.
    MAJOR INTERPRETATION FROM RELIANCE CASHFLOWSTATEMENT FINANCING ACTIVITIES Proceeds from Issue of Equity Share Capital has decreased from Rs 117 Crore in 2019 To Rs 18 Crore in 2020 Interest Paid by RlL has negative increment from Rs (23,338) Crore to Rs (28,508) Crore Net Cash Used in Financing Activities in 2020 is Rs (2,541) Crore Net Increase in Cash and Cash Equivalents has increased from Rs 3,124 Crore in 2019 to Rs 19,816 Crore in 2020
  • 21.
    GRAPHICAL REPRESENTATION OF CASHFLOWACTIVITIES 98,074 42,346 -75,717 -95,128 -2,541 55,906 RS IN CRORES 2019-20 2018-19 Operating 98,074 42,346 Investing -75,717 -95,128 Financing -2,541 55,906 Cash Flow of Reliance Operating Investing Financing
  • 22.
    RATIO ANALYSIS Ratio analysisis a quantitative method of gaining insight into a company's liquidity, operational efficiency, and profitability by studying its financial statements such as the balance sheet and income statement. Ratio analysis compares line-item data from a company's financial statements to reveal insights regarding profitability, liquidity, operational efficiency, and solvency.
  • 23.
    MAJOR RATIO ANALYSISED OFRELIANCE Principal Groups 31st Mar 2020 Principal Ratios 31st Mar 2020 Working Capital (154656) Current Ratio 0.62:1 (Current Assets-Current Liabilities) (Current Assets : Current Liabilities) Wkg. Capital Turnover (3.35) Quick Ratio 0.44:1 (Sales Accounts / Working Capital) (Current Assets-Stock-in-Hand : Current Liabilities) Inventory Turnover 8.27 Debt/Equity Ratio 0.63:1 (Sales Accounts / Closing Stock) Debt Equity Ratio = Total long term debts / shareholder' funds Return on Investment % (7.90) Gross Profit % 27.74% ROI = Net Income / Cost of Investment Nett Profit % 6.52% Return on Wkg. Capital % (25.78) Operating Cost % 10.15% (Nett Profit / Working Capital) % (as percentage of Sales Accounts) Return on Capital Employed (0.07) Recv. Turnover in days 13.77 days (EBIT / Total Asset - Total Current Liability) (payment performance of Debtors) Reliance Industries Limited (2019-2020) Ratio Analysis
  • 24.
    MAJOR INTERPRETATION OF FINANCIAL RATIOS(RELIANCE) NETPROFIT RATIO A high ratio indicates the efficient management of the affairs of business but the company has 6.52% positive so, here company has efficient management of the business affairs DEBT EQUITY RATIO( Ideal = below 2) A lower debt to equity ratio usually implies a more financially stable business. Companies with a higher debt to equity ratio are considered more risky to creditors and investors than companies with a lower ratio. So, RELIANCE has 0.63 as debt equity ratio that reveals better financial stability
  • 25.
    FINDINGS AND CONCLUSION Reliance isone of the most profitable companies in India, the largest publicly traded company in India by market capitalization, and the largest company in India as measured by revenue after recently surpassing the government- controlled Indian Oil Corporation. On 10 September 2020, Reliance Industries became the first Indian company to cross $200 billion in market capitalization. But RIL has a great future ahead as they are expanding their business & doing partnership with top companies like Amazon, Facebook ,etc Thus ,investment in RIL is good decision in the nearby future
  • 26.
    BIBLIOGRAPHY www.ibeg.org Reliance Industries Limited(ril.com) Petroleum Products, Petrol, Aviation Fuel, Lubricants Oil, Lpg Gas | Reliance Petroleum Reliance Retail Jio 4G LTE Network - Experience High Speed 4G Mobile Internet !