Download to read offline


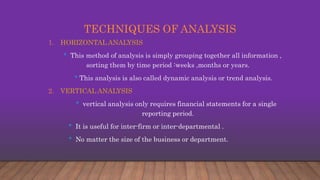
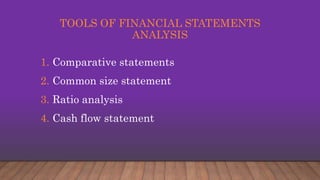
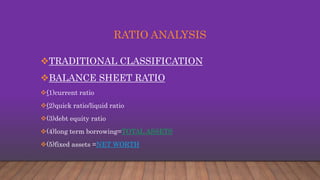


This document analyzes the financial statements of Reliance Industries Ltd over 10 years using various ratio analysis techniques. It calculates ratios such as the current ratio, quick ratio, debt-to-total assets ratio, trade receivables to revenue ratio, gross profit margin, and net profit margin to evaluate the company's performance and financial position over time. The analysis finds that the current ratio, quick ratio and profit margins have generally increased from year 1 to year 10, while debt levels have decreased, indicating an improvement in liquidity and profitability.


