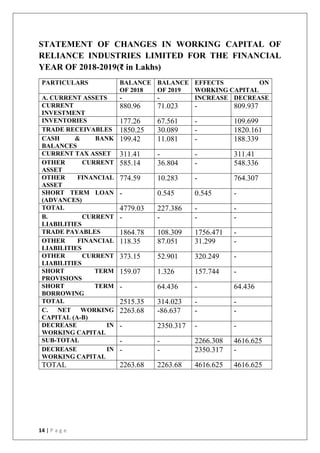
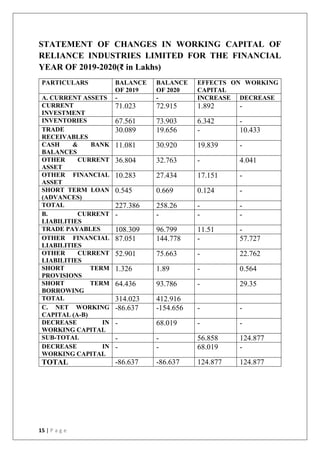
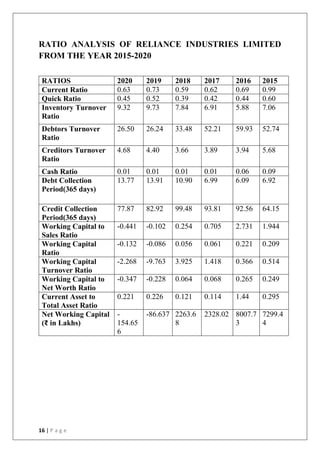
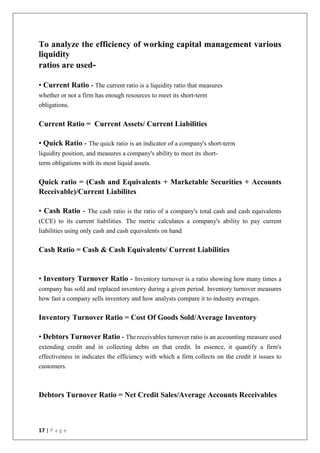
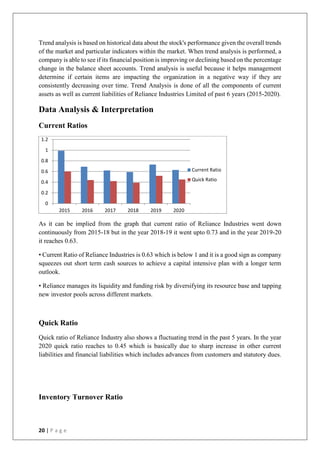
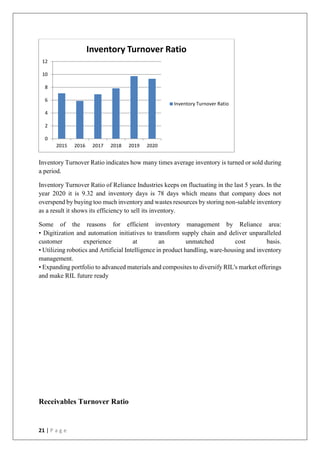
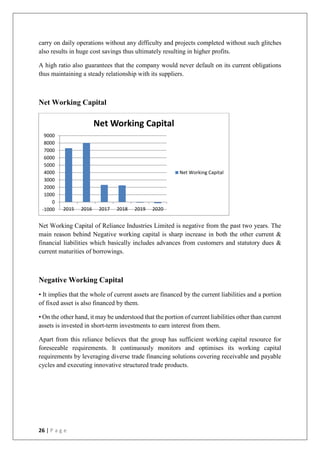
1 | P a g e
IMPORTANCE OF
WORKING
CAPITAL
MANAGEMENT
SUBMITTED BY:
ADITI AGARWAL (20BSP0080)
AYUSHI KEDIA (20BSP0493)
2 | P a g e
TABLE OF CONTENTS
Sl.
No.
Particulars Page no.
1 Acknowledgement 3
2 Introduction 4
3 Objectives 5
4 Methodology 6
5 About the Company- Reliance Industries 7
6 Different sources of working capital 8-10
7 Statement of Changes in Working Capital 11-15
8 Ratio Analysis 16
9 Ratios used 17-19
10 Trend Analysis
20-26
11 Conclusion 27
12 Bibliography 28
3 | P a g e
ACKNOWLEDGEMENT
On the very outset of this report, we would like to extend our sincere and heartfelt obligation
towards all the personages who have helped us in this endeavor. Without their active guidance,
help, cooperation and encouragement, we would not have made headway in the project.
We are ineffably indebted to Prof. Sujoy Kumar Dhar for his conscientious guidance and
encouragement to accomplish this assignment.
We are extremely thankful and pay our gratitude to all our faculty members along with our
director Dr. Ajay Pathak for his valuable guidance and support on completion of this project in
its presently.
We extend our gratitude to our college IBS Kolkata for giving us this opportunity.
We also acknowledge with a deep sense of reverence, our gratitude towards the members of
our family, who have always supported us morally as well as economically.
At last but not least gratitude goes to all of our college mates who directly or indirectly helped
us to complete this project report.
Any omission in this brief acknowledgement does not mean lack of gratitude.
4 | P a g e
INTRODUCTION
WHAT IS WORKING CAPITAL?
Working Capital Management refers to the management of the capital that the company
requires for financing its daily business operations and it is important for the company in order
to maximize its operational efficiency, manage its short term liabilities and assets properly,
avoiding the underutilization of the resources and avoiding the overtrading, etc.
Working Capital is measured by the excess of current assets over and above the current
liabilities.
Working Capital = Current Assets – Current Liabilities
Current Assets refer to those assets that can be converted into cash within one year. For
example, cash in hand, cash at bank, sundry debtors etc.
Current Liabilities refer to those liabilities for which expense will be incurred within one year.
For example, creditors, bills payable, bank overdrafts & outstanding expenses.
HOW IS THE EFFECIENCY OF WORKING CAPITAL MANAGEMENT
MEASURED?
The efficiency of working capital management can be measured through a variety of methods
and ratios. Financial analysts typically compare the working capital cycle and other working
capital ratios against industry benchmarks or a company`s peers. The most commonly used
ratios and measures are the current ratios, days of sales outstanding, days of inventory
outstanding and days of payables outstanding.
5 | P a g e
OBJECTIVES OF THE STUDY
1) To study the trend analysis through liquidity & activity ratios of the past five financial
years.
2) To study the sources of working capital of Reliance Industries Ltd.
3) To analyze the working capital trends from the year 2015-16 to 2019-20
4) To make suggestions based on the findings of the study.
6 | P a g e
METHODOLOGY OF THE STUDY
It is a secondary method of research wherein we will be focusing on the financials of Reliance
Industries Ltd and drawing conclusions on the various defined objectives.
SECONDARY DATA
Secondary sources are the other important sources though which the data was collected. These
are the readily available sources of data where one had not to put much effort to collect, because
it is already been collected and part in un elderly manner by some researcher, experts and
special.
The secondary sources helpful for the study were:
Internet was used for the collection of the data i.e.,
1) Various business websites
2) Blogs
3) Articles
PERIOD OF STUDY:
The study is undertaken in the duration of 10 days.
COMPANY :
Reliance Industries Limited
7 | P a g e
ABOUT THE COMPANY- RELIANCE INDUSTRIES LIMITED
Reliance Industries Ltd. is India's largest private-sector company, generating revenues of
$19.97 billion, or more than 3 percent of India's total gross domestic product. Backward vertical
integration has been the cornerstone of the evolution and growth of Reliance . Starting with
textiles in the late seventies, Reliance pursued a strategy of backward vertical integration - in
polyester, fibre intermediates, plastics, petrochemicals, petroleum refining and oil and gas
exploration and production - to be fully integrated along the materials and energy value chain.
The Group's activities span exploration and production of oil and gas, petroleum refining and
marketing, petrochemicals (polyester, fiber intermediates, plastics and chemicals), textiles,
retail, infotel and special economic zones.
Reliance enjoys global leadership in its businesses, being the largest polyester yarn and fiber
producer in the world and among the top five to ten producers in the world in major
petrochemical products.
DIFFERENT SOURCES OF WORKING CAPITAL
8 | P a g e
A firm can use two types of sources to finance its working capital, namely:
(i) Long-term sources, and
(ii) Short-term sources.
(i) Long-Term Sources:
Every business organization is required to maintain a minimum balance of cash and other
current assets at all the times—irrespective of the ups and downs in the level of activity. The
portion of working capital which is continuously maintained by the business at all times to
carry on its minimum level of activities is called permanent working capital. This type of
working capital should be arranged from long-term sources of fund.
The following are the long-term sources of financing permanent working
capital:
(a) Issue of Equity shares
(b) Issue of Preference shares
(c) Retained earnings (ploughed-back profits)
(d) Issue of Debentures and other long-term bonds
(e) Long-term loans taken from financial institutions etc.
(ii) Short-Term Sources:
The short-term financing of working capital is generally used to support the temporary working
capital which is usually needed to meet the seasonal increase or sudden spurt in demand.
Various short-term sources of financing of temporary working capital are:
9 | P a g e
(a) Bank credit (e.g., cash credit, letter of credit, bills finance, working capital demand loan,
overdraft facility etc.)
(b) Public deposits
(c) Trade credit
(d) Outstanding expenses
(e) Provision for depreciation
(f) Provision for taxation
(g) Advances from customers
(h) Loans from directors
(i) Security money received from employees
(j) Receipts from factoring.
10 | P a g e
SOURCES OF WORKING CAPITAL OF RELIANCE
INDUSTRIES
Short Term Sources Long Term Sources
Commercial Bank
 Foreign Currency Loan
 Rupee Loans
Debentures
Commercial Papers Bonds
Advances from customers & statutory dues Loans from Financial Institutions
Current Assets Components Of Reliance Industry Includes,
 Investments
 Trade Receivables
 Cash & Cash Equivalents
 Loans
 Other Financial Assets
 Other Current Assets
Current Liabilities Components Of Reliance Industry Includes,
 Borrowings
 Trade Payables
 Other Financial Liabilities
 Other Current Liabilities
 Provisions
11 | P a g e
STATEMENT OF CHANGES IN WORKING CAPITAL OF
RELIANCE INDUSTRIES LIMITED FOR THE FINANCIAL
YEAR OF 2015-2016 (₹ in Lakhs)
PARTICULARS BALANCE
OF 2015
BALANCE
OF 2016
EFFECTS ON WORKING
CAPITAL
A. CURRENT
ASSETS
- - INCREASE DECREASE
CURRENT
INVESTMENT
6760.00 7435.00 675 -
INVENTORIES 111.51 178.39 66.88 -
TRADE
RECEIVABLES
1599.51 2167.61 568.1 -
CASH & BANK
BALANCES
237.73 241.26 3.53 -
SHORT TERM
LOANS
(ADVANCES)
1612.04 1529.21 - 82.83
TOTAL 10320.79 11551.47 - -
B. CURRENT
LIABILITIES
- - - -
TRADE PAYABLES
OF MICRO &
SMALL
ENTERPRISES
51.16 1.03 50.13 -
OTHER TRADE
PAYABLES
1428.88 1331.36 97.52 -
OTHER CURRENT
LIABILITIES
758.52 1393.24 - 634.72
SHORT TERM
PROVISIONS
782.79 818.11 - 35.32
TOTAL 3021.35 3543.74 - -
C. NET WORKING
CAPITAL (A-B)
7299.44 8007.73 - -
INCREASE IN
WORKING
CAPITAL
708.29 - - -
SUB-TOTAL - - 1461.16 752.87
INCREASE IN
WORKING
CAPITAL
- - - 708.29
TOTAL 8007.73 8007.73 1461.16 1461.16
12 | P a g e
STATEMENT OF CHANGES IN WORKING CAPITAL OF
RELIANCE INDUSTRIES LIMITED FOR THE FINANCIAL
YEAR OF 2016-2017(₹ in Lakhs)
PARTICULARS BALANCE
OF 2016
BALANCE
OF 2017
EFFECTS ON
WORKING CAPITAL
A. CURRENT
ASSETS
- - INCREASE DECREASE
CURRENT
INVESTMENT
7435.00 1208.97 - 6226.03
INVENTORIES 178.39 187.14 8.75 -
TRADE
RECEIVABLES
2167.61 1926.79 - 240.82
CASH & BANK
BALANCES
241.26 323.58 82.32 -
SHORT TERM
LOANS (ADVANCES)
1529.21 - - 1529.21
CURRENT TAX
ASSET
- 341.10 341.10 -
OTHER CURRENT
ASSET
- 400.66 400.66 -
TOTAL 11551.47 4388.24
B. CURRENT
LIABILITIES
- - - -
TRADE PAYABLES 1332.39 1466.81 - 134.42
OTHER FINANCIAL
LIABILITIES
- 102.66 - 102.66
OTHER CURRENT
LIABILITIES
1393.24 339.95 1053.29 -
SHORT TERM
PROVISIONS
818.11 150.80 667.31 -
TOTAL 3543.74 2060.22 - -
C. NET WORKING
CAPITAL (A-B)
8007.73 2328.02 - -
DECREASE IN
WORKING CAPITAL
- 5679.71 - -
SUB-TOTAL - - 2553.43 8233.14
DECREASE IN
WORKING CAPITAL
- - 5679.71 -
TOTAL 8007.73 8007.73 8233.14 8233.14
13 | P a g e
STATEMENT OF CHANGES IN WORKING CAPITAL OF
RELIANCE INDUSTRIES LIMITED FOR THE FINANCIAL
YEAR OF 2017-2018(₹ in Lakhs)
PARTICULARS BALANCE
OF 2017
BALANCE
OF 2018
EFFECTS ON
WORKING CAPITAL
A. CURRENT ASSETS - - INCREASE DECREASE
CURRENT
INVESTMENT
187.14 880.96 - 328.01
INVENTORIES 1208.97 177.26 - 9.88
TRADE RECEIVABLES 1926.79 1850.25 - 76.54
CASH & BANK
BALANCES
323.58 199.42 - 124.16
CURRENT TAX ASSET 341.10 311.41 - 29.69
OTHER CURRENT
ASSET
400.66 585.14 184.48 -
OTHER FINANCIAL
ASSET
- 774.59 774.59 -
TOTAL 4388.24 4779.03 - -
B. CURRENT
LIABILITIES
- - - -
TRADE PAYABLES 1466.81 1864.78 - 397.97
OTHER FINANCIAL
LIABILITIES
102.66 118.35 - 15.69
OTHER CURRENT
LIABILITIES
339.95 373.15 - 33.2
SHORT TERM
PROVISIONS
150.80 159.07 - 8.27
TOTAL 2060.22 2515.35 - -
C. NET WORKING
CAPITAL (A-B)
2328.02 2263.68 - -
DECREASE IN
WORKING CAPITAL
- 64.34 - -
SUB-TOTAL - - 959.07 1023.41
DECREASE IN
WORKING CAPITAL
- - 64.34 -
TOTAL 2328.02 2328.02 1023.41 1023.41
14 | P a g e
STATEMENT OF CHANGES IN WORKING CAPITAL OF
RELIANCE INDUSTRIES LIMITED FOR THE FINANCIAL
YEAR OF 2018-2019(₹ in Lakhs)
PARTICULARS BALANCE
OF 2018
BALANCE
OF 2019
EFFECTS ON
WORKING CAPITAL
A. CURRENT ASSETS - - INCREASE DECREASE
CURRENT
INVESTMENT
880.96 71.023 - 809.937
INVENTORIES 177.26 67.561 - 109.699
TRADE RECEIVABLES 1850.25 30.089 - 1820.161
CASH & BANK
BALANCES
199.42 11.081 - 188.339
CURRENT TAX ASSET 311.41 - - 311.41
OTHER CURRENT
ASSET
585.14 36.804 - 548.336
OTHER FINANCIAL
ASSET
774.59 10.283 - 764.307
SHORT TERM LOAN
(ADVANCES)
- 0.545 0.545 -
TOTAL 4779.03 227.386 - -
B. CURRENT
LIABILITIES
- - - -
TRADE PAYABLES 1864.78 108.309 1756.471 -
OTHER FINANCIAL
LIABILITIES
118.35 87.051 31.299 -
OTHER CURRENT
LIABILITIES
373.15 52.901 320.249 -
SHORT TERM
PROVISIONS
159.07 1.326 157.744 -
SHORT TERM
BORROWING
- 64.436 - 64.436
TOTAL 2515.35 314.023 - -
C. NET WORKING
CAPITAL (A-B)
2263.68 -86.637 - -
DECREASE IN
WORKING CAPITAL
- 2350.317 - -
SUB-TOTAL - - 2266.308 4616.625
DECREASE IN
WORKING CAPITAL
- - 2350.317 -
TOTAL 2263.68 2263.68 4616.625 4616.625
15 | P a g e
STATEMENT OF CHANGES IN WORKING CAPITAL OF
RELIANCE INDUSTRIES LIMITED FOR THE FINANCIAL
YEAR OF 2019-2020(₹ in Lakhs)
PARTICULARS BALANCE
OF 2019
BALANCE
OF 2020
EFFECTS ON WORKING
CAPITAL
A. CURRENT ASSETS - - INCREASE DECREASE
CURRENT
INVESTMENT
71.023 72.915 1.892 -
INVENTORIES 67.561 73.903 6.342 -
TRADE
RECEIVABLES
30.089 19.656 - 10.433
CASH & BANK
BALANCES
11.081 30.920 19.839 -
OTHER CURRENT
ASSET
36.804 32.763 - 4.041
OTHER FINANCIAL
ASSET
10.283 27.434 17.151 -
SHORT TERM LOAN
(ADVANCES)
0.545 0.669 0.124 -
TOTAL 227.386 258.26 - -
B. CURRENT
LIABILITIES
- - - -
TRADE PAYABLES 108.309 96.799 11.51 -
OTHER FINANCIAL
LIABILITIES
87.051 144.778 - 57.727
OTHER CURRENT
LIABILITIES
52.901 75.663 - 22.762
SHORT TERM
PROVISIONS
1.326 1.89 - 0.564
SHORT TERM
BORROWING
64.436 93.786 - 29.35
TOTAL 314.023 412.916
C. NET WORKING
CAPITAL (A-B)
-86.637 -154.656 - -
DECREASE IN
WORKING CAPITAL
- 68.019 - -
SUB-TOTAL - - 56.858 124.877
DECREASE IN
WORKING CAPITAL
- - 68.019 -
TOTAL -86.637 -86.637 124.877 124.877
16 | P a g e
RATIO ANALYSIS OF RELIANCE INDUSTRIES LIMITED
FROM THE YEAR 2015-2020
RATIOS 2020 2019 2018 2017 2016 2015
Current Ratio 0.63 0.73 0.59 0.62 0.69 0.99
Quick Ratio 0.45 0.52 0.39 0.42 0.44 0.60
Inventory Turnover
Ratio
9.32 9.73 7.84 6.91 5.88 7.06
Debtors Turnover
Ratio
26.50 26.24 33.48 52.21 59.93 52.74
Creditors Turnover
Ratio
4.68 4.40 3.66 3.89 3.94 5.68
Cash Ratio 0.01 0.01 0.01 0.01 0.06 0.09
Debt Collection
Period(365 days)
13.77 13.91 10.90 6.99 6.09 6.92
Credit Collection
Period(365 days)
77.87 82.92 99.48 93.81 92.56 64.15
Working Capital to
Sales Ratio
-0.441 -0.102 0.254 0.705 2.731 1.944
Working Capital
Ratio
-0.132 -0.086 0.056 0.061 0.221 0.209
Working Capital
Turnover Ratio
-2.268 -9.763 3.925 1.418 0.366 0.514
Working Capital to
Net Worth Ratio
-0.347 -0.228 0.064 0.068 0.265 0.249
Current Asset to
Total Asset Ratio
0.221 0.226 0.121 0.114 1.44 0.295
Net Working Capital
(₹ in Lakhs)
-
154.65
6
-86.637 2263.6
8
2328.02 8007.7
3
7299.4
4
17 | P a g e
To analyze the efficiency of working capital management various
liquidity
ratios are used-
• Current Ratio - The current ratio is a liquidity ratio that measures
whether or not a firm has enough resources to meet its short-term
obligations.
Current Ratio = Current Assets/ Current Liabilities
• Quick Ratio - The quick ratio is an indicator of a company's short-term
liquidity position, and measures a company's ability to meet its short-
term obligations with its most liquid assets.
Quick ratio = (Cash and Equivalents + Marketable Securities + Accounts
Receivable)/Current Liabilites
• Cash Ratio - The cash ratio is the ratio of a company's total cash and cash equivalents
(CCE) to its current liabilities. The metric calculates a company's ability to pay current
liabilities using only cash and cash equivalents on hand
Cash Ratio = Cash & Cash Equivalents/ Current Liabilities
• Inventory Turnover Ratio - Inventory turnover is a ratio showing how many times a
company has sold and replaced inventory during a given period. Inventory turnover measures
how fast a company sells inventory and how analysts compare it to industry averages.
Inventory Turnover Ratio = Cost Of Goods Sold/Average Inventory
• Debtors Turnover Ratio - The receivables turnover ratio is an accounting measure used
extending credit and in collecting debts on that credit. In essence, it quantify a firm's
effectiveness in indicates the efficiency with which a firm collects on the credit it issues to
customers.
Debtors Turnover Ratio = Net Credit Sales/Average Accounts Receivables
18 | P a g e
• Debt Collection Period - Debtor Turnover Ratio can be converted into the number of
days within which the cash is collected from the debtors. It is expressed in number of days. It
is calculated as,
Debt Collection Period = 365/ Debtors Turnover Ratio
• Creditors Turnover Ratio- The accounts payable turnover ratio is a short-term liquidity
measure used to quantify the rate at which a company pays off its suppliers. The measure shows
investors how many times per period the company pays its accounts payable.
Creditors Turnover Ratio =Total Supplier Purchases/ Average Accounts
Payable
• Credit Collection Period – Creditor Turnover Ratio can be converted into the number
of days taken by the firm to make payment to its trade payables. It is expressed in the number
of days.
Credit Collection Period = 365/ Credit Turnover Ratio
• Working Capital Turnover Ratio – This ratio reveals how efficiently working capital
has been utilized in making revenue from operations. A high working capital turnover ratio
shows efficient use of working capital & quick turnover of current assets like inventory and
trade receivables. However a very high ratio is not desirable as it shows doing business with
too little working capital.
It is calculated as follows,
Working Capital Turnover Ratio- Net Revenue From Operations/ Working Capital
• Working Capital To Net Worth Ratio = Working Capital/ Net Worth
= Total Assets – Total Liabilities/ Current Assets – Current Liabilities
• Current Asset To Total Asset Ratio – This ratio helpd in measuring the liquidity of
the company. A company with a high ratio indicates high liquidity & vice versa.
It is calculated as follows,
19 | P a g e
Current Asset To Total Asset Ratio= Current Assets/ Total Assets
• Working Capital To Sales Ratio : When companies use the same working capital to
generate more sales, it means that they are using the same funds over and over again. This is
why this ratio is also called “Working Capital Turnover Ratio” as it measures the number of
times working capital has been turned over. The higher the sales, the more the profits and
therefore the more appropriate use of working capital has been made.
It is calculated as follows,
Working Capital To Sales Ratio = Working Capital/ Sales
• Net Working Capital - Net working capital (NWC) is the difference between a
company's current assets and current liabilities. It is a liquidity calculation that measures a
company's ability to pay off its current liabilities with current assets. This measurement is
important to management, vendors, and general creditors because it shows the firm's short-
term liquidity as well as management's ability to use its assets efficiently.
Net Working Capital= Current Assets-Current Liabilities
Trend Analysis
20 | P a g e
Trend analysis is based on historical data about the stock's performance given the overall trends
of the market and particular indicators within the market. When trend analysis is performed, a
company is able to see if its financial position is improving or declining based on the percentage
change in the balance sheet accounts. Trend analysis is useful because it helps management
determine if certain items are impacting the organization in a negative way if they are
consistently decreasing over time. Trend Analysis is done of all the components of current
assets as well as current liabilities of Reliance Industries Limited of past 6 years (2015-2020).
Data Analysis & Interpretation
Current Ratios
As it can be implied from the graph that current ratio of Reliance Industries went down
continuously from 2015-18 but in the year 2018-19 it went upto 0.73 and in the year 2019-20
it reaches 0.63.
• Current Ratio of Reliance Industries is 0.63 which is below 1 and it is a good sign as company
squeezes out short term cash sources to achieve a capital intensive plan with a longer term
outlook.
• Reliance manages its liquidity and funding risk by diversifying its resource base and tapping
new investor pools across different markets.
Quick Ratio
Quick ratio of Reliance Industry also shows a fluctuating trend in the past 5 years. In the year
2020 quick ratio reaches to 0.45 which is basically due to sharp increase in other current
liabilities and financial liabilities which includes advances from customers and statutory dues.
Inventory Turnover Ratio
0
0.2
0.4
0.6
0.8
1
1.2
2015 2016 2017 2018 2019 2020
Current Ratio
Quick Ratio
21 | P a g e
Inventory Turnover Ratio indicates how many times average inventory is turned or sold during
a period.
Inventory Turnover Ratio of Reliance Industries keeps on fluctuating in the last 5 years. In the
year 2020 it is 9.32 and inventory days is 78 days which means that company does not
overspend by buying too much inventory and wastes resources by storing non-salable inventory
as a result it shows its efficiency to sell its inventory.
Some of the reasons for efficient inventory management by Reliance area:
• Digitization and automation initiatives to transform supply chain and deliver unparalleled
customer experience at an unmatched cost basis.
• Utilizing robotics and Artificial Intelligence in product handling, ware-housing and inventory
management.
• Expanding portfolio to advanced materials and composites to diversify RIL's market offerings
and make RIL future ready
Receivables Turnover Ratio
0
2
4
6
8
10
12
2015 2016 2017 2018 2019 2020
Inventory Turnover Ratio
22 | P a g e
Debtors Turnover Ratio of Reliance Industries tends to decrease from the year 2016 which
shows that the firm uses liberal credit policy for its customers. It allows customers more time
to pay, this can have a significant drag on a company's resources, because it is money that is
not coming in as quickly.
Creditors Turnover Ratio
Creditors Turnover Ratio of Reliance Industries tend to rise in the last five years. In the year
2020 Creditors Turnover Ratio is 4.68. The accounts payable turnover ratio indicates how many
times a company pays off its suppliers during an accounting period. It also measures how a
company manages paying its own bills.
A high ratio of 4.68 indicates faster payment to suppliers for purchases on credit. This may be
due to favorable credit terms and implies that the company has successfully managed to make
the payments faster to its suppliers.
Cash Ratio
0
10
20
30
40
50
60
70
2015 2016 2017 2018 2019 2020
Debtors Turnover Ratio
Debtors Turnover
Ratio
0
1
2
3
4
5
6
2015 2016 2017 2018 2019 2020
Creditors Turnover Ratio
Creditors Turnover
Ratio
23 | P a g e
Cash ratio of Reliance Industries also shows a constant trend in the last 3 years with a decline
in cash and cash equivalents along with sharp increase in current liabilities. It also implies a
very high liquidity position, the firm does not hold large amount of cash.
One of the main reason for reliance high liquidity position is tight management of cash to cash
cycle by extending the payable
WORKING CAPITAL TO SALES RATIO:
From the above graph, the relationship between working capital and net sales is depicted. If we
look at the results of the second graph, for FY 2020 the ratio of WC to sales is -0.441 i.e. for
one rupee of sales, the company needs Rs -0.441 of net current assets (working capital). This
gap will be met from bank borrowings and long term sources of funds.
WORKING CAPITAL RATIO
0
0.02
0.04
0.06
0.08
0.1
2015 2016 2017 2018 2019 2020
Cash Ratio
Cash Ratio
-1
0
1
2
3
4
5
2015 2016 2017 2018 2019 2020
Working Capital To Sales Ratio
Working Capital To Sales
Ratio
24 | P a g e
As it is shown in the graph, the following observations can be made:
A company having a higher NWC ratio has a greater ability to meet its current obligations.
From a conservative position of 2015 where the ratio was the highest at 0.209,it has now
settled at (0.132) which is on the lower side.
As this ratio represents a firms potential reservoir of funds, a declining trend should be taken
seriously and appropriate remedial measures need to be taken so as to avert a more troubled
situation.
WORKING CAPITAL TURNOVERRATIO
It shows the relationship between the working capital and sales.
The firm should maintain a steady working capital position. It should have adequate working
capital to run its business operations. Both excessive and inadequate working capital
positionsaredangerousfromafirm‟spointofviewexcessiveworkingcapitalmeansholding costs
-0.15
-0.1
-0.05
0
0.05
0.1
0.15
0.2
0.25
2015 2016 2017 2018 2019 2020
Working Capital Ratio
-12
-10
-8
-6
-4
-2
0
2
4
6
2015 2016 2017 2018 2019 2020
Working Capital Turnover Ratio
Working Capital
Turnover Ratio
25 | P a g e
and idle funds which earns no profits for the firms. Paucity of working capital not only
impairsfirm‟sprofitabilitybutalsoresultsinproductioninefficienciesandinterruptionsand also
sales disruptions
WORKING CAPITAL TO NET WORTH RATIO
Similar to the previous ratio, WC to Net Worth ratio is used to represent the relationship
between the shareholders money and the net worth. Similar to previous ratio, for FY2020 the
ratio of (0.347) shows that for each rupee of net worth, the company needs Re. (0.347) of
working capital. This gap will be met from bank borrowings and long term sources of funds.
CURRENT ASSETS TO TOTAL ASSETS RATIO
Current Assets to Total Assets ratio of Reliance Industries tend to rise in the last five years.RIL
during the last five years has managed to keep a pretty healthy current assets ratio with an
average minimum 10%. For an infrastructure company such levels of current assets help to
-0.4
-0.3
-0.2
-0.1
0
0.1
0.2
0.3
2015 2016 2017 2018 2019 2020
Working Capital To Net Worth Ratio
Working Capital To Net
Worth Ratio
0
0.2
0.4
0.6
0.8
1
1.2
1.4
1.6
2015 2016 2017 2018 2019 2020
Current Assets To Total Assets Ratio
Current Assets To Total
Assets Ratio
26 | P a g e
carry on daily operations without any difficulty and projects completed without such glitches
also results in huge cost savings thus ultimately resulting in higher profits.
A high ratio also guarantees that the company would never default on its current obligations
thus maintaining a steady relationship with its suppliers.
Net Working Capital
Net Working Capital of Reliance Industries Limited is negative from the past two years. The
main reason behind Negative working capital is sharp increase in both the other current &
financial liabilities which basically includes advances from customers and statutory dues &
current maturities of borrowings.
Negative Working Capital
• It implies that the whole of current assets are financed by the current liabilities and a portion
of fixed asset is also financed by them.
• On the other hand, it may be understood that the portion of current liabilities other than current
assets is invested in short-term investments to earn interest from them.
Apart from this reliance believes that the group has sufficient working capital resource for
foreseeable requirements. It continuously monitors and optimises its working capital
requirements by leveraging diverse trade financing solutions covering receivable and payable
cycles and executing innovative structured trade products.
-1000
0
1000
2000
3000
4000
5000
6000
7000
8000
9000
2015 2016 2017 2018 2019 2020
Net Working Capital
Net Working Capital
27 | P a g e
CONCLUSION
The study of Working capital components, structure, policies and management of Reliance
Industry states that it very effective and efficient in managing its working capital. Reliance
believes that the group has sufficient working capital resource for foreseeable requirements. It
continuously monitors and optimizes its working capital requirements by leveraging diverse
trade financing solutions covering receivable and payable cycles and executing innovative
structured trade products.
Following are the conclusion derived from the project-
• The company's negative working capital states that the whole of current assets are financed
by the current liabilities and a portion of fixed asset is also financed by them and it's a very
good sign for the company.
• Reliance industry achieves liberal credit policy from its suppliers which in turn helps the
company to use that money in its operating activities. As far as debtors are concerned it also
provides a liberal credit policy to its customers so as to build a huge customer base.
• Low current and quick ratio of RIL reveals that company squeezes out short term cash sources
to achieve a capital intensive plan with a longer term outlook.
• Inventory Turnover Ratio increasing from 7.06 to 9.32 states the company's efficiency in
managing its inventory by using techniques like Artificial Intelligence, Robotics in inventory
management and handling.
• Creditors Turnover Ratio of Reliance Industries tends to be in the rang e of 3.66 – 5.68
which (RIL, 2015-2020) indicates slow payment to suppliers for purchases on credit. This
may be due to favorable credit terms and implies that the company has successfully managed
to negotiate better payment terms which allow it to make payments less frequently, without
any penalty.
• Receivables Turnover Ratio Debtors Turnover Ratio of Reliance Industries tends to
decrease from the year 2015 - 2020 which shows that the firm uses liberal credit policy for its
customers. It allows customers more time to pay, this can have a significant drag on a
company's resources, because it is money that is not coming in as quickly.
• Declining cash ratio from the year 2015 to 2016 and later stagnant from 0.01 also implies a
very high liquidity position, the firm does not hold large amount of cash.
Overall Reliance Industries Limited is very efficient in managing its working capital which in
turn contributes to achieve its objectives in short as well as long term. Reliance also believes
that the group has sufficient working capital resource for foreseeable requirements. It
continuously monitors and optimizes its working capital requirements by leveraging diverse
trade financing solutions covering receivable and payable cycles and executing innovative
structured trade products.
28 | P a g e
BIBLIOGRAPHY
1) (Sanjay Borad, 2019)
2) (GOEL, 2017)
3) (RIL, 2015-2020)
4) (TOUVILA, 2019)
5) (BAJAJ FINSERV, 2020)
6) (CFAINSTITUTE, 2020)
7) (WIKIPEDIA, 2020)
29 | P a g e
THANK
YOU

working capital management- Reliance 2020

  • 1.
    1 | Pa g e IMPORTANCE OF WORKING CAPITAL MANAGEMENT SUBMITTED BY: ADITI AGARWAL (20BSP0080) AYUSHI KEDIA (20BSP0493)
  • 2.
    2 | Pa g e TABLE OF CONTENTS Sl. No. Particulars Page no. 1 Acknowledgement 3 2 Introduction 4 3 Objectives 5 4 Methodology 6 5 About the Company- Reliance Industries 7 6 Different sources of working capital 8-10 7 Statement of Changes in Working Capital 11-15 8 Ratio Analysis 16 9 Ratios used 17-19 10 Trend Analysis 20-26 11 Conclusion 27 12 Bibliography 28
  • 3.
    3 | Pa g e ACKNOWLEDGEMENT On the very outset of this report, we would like to extend our sincere and heartfelt obligation towards all the personages who have helped us in this endeavor. Without their active guidance, help, cooperation and encouragement, we would not have made headway in the project. We are ineffably indebted to Prof. Sujoy Kumar Dhar for his conscientious guidance and encouragement to accomplish this assignment. We are extremely thankful and pay our gratitude to all our faculty members along with our director Dr. Ajay Pathak for his valuable guidance and support on completion of this project in its presently. We extend our gratitude to our college IBS Kolkata for giving us this opportunity. We also acknowledge with a deep sense of reverence, our gratitude towards the members of our family, who have always supported us morally as well as economically. At last but not least gratitude goes to all of our college mates who directly or indirectly helped us to complete this project report. Any omission in this brief acknowledgement does not mean lack of gratitude.
  • 4.
    4 | Pa g e INTRODUCTION WHAT IS WORKING CAPITAL? Working Capital Management refers to the management of the capital that the company requires for financing its daily business operations and it is important for the company in order to maximize its operational efficiency, manage its short term liabilities and assets properly, avoiding the underutilization of the resources and avoiding the overtrading, etc. Working Capital is measured by the excess of current assets over and above the current liabilities. Working Capital = Current Assets – Current Liabilities Current Assets refer to those assets that can be converted into cash within one year. For example, cash in hand, cash at bank, sundry debtors etc. Current Liabilities refer to those liabilities for which expense will be incurred within one year. For example, creditors, bills payable, bank overdrafts & outstanding expenses. HOW IS THE EFFECIENCY OF WORKING CAPITAL MANAGEMENT MEASURED? The efficiency of working capital management can be measured through a variety of methods and ratios. Financial analysts typically compare the working capital cycle and other working capital ratios against industry benchmarks or a company`s peers. The most commonly used ratios and measures are the current ratios, days of sales outstanding, days of inventory outstanding and days of payables outstanding.
  • 5.
    5 | Pa g e OBJECTIVES OF THE STUDY 1) To study the trend analysis through liquidity & activity ratios of the past five financial years. 2) To study the sources of working capital of Reliance Industries Ltd. 3) To analyze the working capital trends from the year 2015-16 to 2019-20 4) To make suggestions based on the findings of the study.
  • 6.
    6 | Pa g e METHODOLOGY OF THE STUDY It is a secondary method of research wherein we will be focusing on the financials of Reliance Industries Ltd and drawing conclusions on the various defined objectives. SECONDARY DATA Secondary sources are the other important sources though which the data was collected. These are the readily available sources of data where one had not to put much effort to collect, because it is already been collected and part in un elderly manner by some researcher, experts and special. The secondary sources helpful for the study were: Internet was used for the collection of the data i.e., 1) Various business websites 2) Blogs 3) Articles PERIOD OF STUDY: The study is undertaken in the duration of 10 days. COMPANY : Reliance Industries Limited
  • 7.
    7 | Pa g e ABOUT THE COMPANY- RELIANCE INDUSTRIES LIMITED Reliance Industries Ltd. is India's largest private-sector company, generating revenues of $19.97 billion, or more than 3 percent of India's total gross domestic product. Backward vertical integration has been the cornerstone of the evolution and growth of Reliance . Starting with textiles in the late seventies, Reliance pursued a strategy of backward vertical integration - in polyester, fibre intermediates, plastics, petrochemicals, petroleum refining and oil and gas exploration and production - to be fully integrated along the materials and energy value chain. The Group's activities span exploration and production of oil and gas, petroleum refining and marketing, petrochemicals (polyester, fiber intermediates, plastics and chemicals), textiles, retail, infotel and special economic zones. Reliance enjoys global leadership in its businesses, being the largest polyester yarn and fiber producer in the world and among the top five to ten producers in the world in major petrochemical products. DIFFERENT SOURCES OF WORKING CAPITAL
  • 8.
    8 | Pa g e A firm can use two types of sources to finance its working capital, namely: (i) Long-term sources, and (ii) Short-term sources. (i) Long-Term Sources: Every business organization is required to maintain a minimum balance of cash and other current assets at all the times—irrespective of the ups and downs in the level of activity. The portion of working capital which is continuously maintained by the business at all times to carry on its minimum level of activities is called permanent working capital. This type of working capital should be arranged from long-term sources of fund. The following are the long-term sources of financing permanent working capital: (a) Issue of Equity shares (b) Issue of Preference shares (c) Retained earnings (ploughed-back profits) (d) Issue of Debentures and other long-term bonds (e) Long-term loans taken from financial institutions etc. (ii) Short-Term Sources: The short-term financing of working capital is generally used to support the temporary working capital which is usually needed to meet the seasonal increase or sudden spurt in demand. Various short-term sources of financing of temporary working capital are:
  • 9.
    9 | Pa g e (a) Bank credit (e.g., cash credit, letter of credit, bills finance, working capital demand loan, overdraft facility etc.) (b) Public deposits (c) Trade credit (d) Outstanding expenses (e) Provision for depreciation (f) Provision for taxation (g) Advances from customers (h) Loans from directors (i) Security money received from employees (j) Receipts from factoring.
  • 10.
    10 | Pa g e SOURCES OF WORKING CAPITAL OF RELIANCE INDUSTRIES Short Term Sources Long Term Sources Commercial Bank  Foreign Currency Loan  Rupee Loans Debentures Commercial Papers Bonds Advances from customers & statutory dues Loans from Financial Institutions Current Assets Components Of Reliance Industry Includes,  Investments  Trade Receivables  Cash & Cash Equivalents  Loans  Other Financial Assets  Other Current Assets Current Liabilities Components Of Reliance Industry Includes,  Borrowings  Trade Payables  Other Financial Liabilities  Other Current Liabilities  Provisions
  • 11.
    11 | Pa g e STATEMENT OF CHANGES IN WORKING CAPITAL OF RELIANCE INDUSTRIES LIMITED FOR THE FINANCIAL YEAR OF 2015-2016 (₹ in Lakhs) PARTICULARS BALANCE OF 2015 BALANCE OF 2016 EFFECTS ON WORKING CAPITAL A. CURRENT ASSETS - - INCREASE DECREASE CURRENT INVESTMENT 6760.00 7435.00 675 - INVENTORIES 111.51 178.39 66.88 - TRADE RECEIVABLES 1599.51 2167.61 568.1 - CASH & BANK BALANCES 237.73 241.26 3.53 - SHORT TERM LOANS (ADVANCES) 1612.04 1529.21 - 82.83 TOTAL 10320.79 11551.47 - - B. CURRENT LIABILITIES - - - - TRADE PAYABLES OF MICRO & SMALL ENTERPRISES 51.16 1.03 50.13 - OTHER TRADE PAYABLES 1428.88 1331.36 97.52 - OTHER CURRENT LIABILITIES 758.52 1393.24 - 634.72 SHORT TERM PROVISIONS 782.79 818.11 - 35.32 TOTAL 3021.35 3543.74 - - C. NET WORKING CAPITAL (A-B) 7299.44 8007.73 - - INCREASE IN WORKING CAPITAL 708.29 - - - SUB-TOTAL - - 1461.16 752.87 INCREASE IN WORKING CAPITAL - - - 708.29 TOTAL 8007.73 8007.73 1461.16 1461.16
  • 12.
    12 | Pa g e STATEMENT OF CHANGES IN WORKING CAPITAL OF RELIANCE INDUSTRIES LIMITED FOR THE FINANCIAL YEAR OF 2016-2017(₹ in Lakhs) PARTICULARS BALANCE OF 2016 BALANCE OF 2017 EFFECTS ON WORKING CAPITAL A. CURRENT ASSETS - - INCREASE DECREASE CURRENT INVESTMENT 7435.00 1208.97 - 6226.03 INVENTORIES 178.39 187.14 8.75 - TRADE RECEIVABLES 2167.61 1926.79 - 240.82 CASH & BANK BALANCES 241.26 323.58 82.32 - SHORT TERM LOANS (ADVANCES) 1529.21 - - 1529.21 CURRENT TAX ASSET - 341.10 341.10 - OTHER CURRENT ASSET - 400.66 400.66 - TOTAL 11551.47 4388.24 B. CURRENT LIABILITIES - - - - TRADE PAYABLES 1332.39 1466.81 - 134.42 OTHER FINANCIAL LIABILITIES - 102.66 - 102.66 OTHER CURRENT LIABILITIES 1393.24 339.95 1053.29 - SHORT TERM PROVISIONS 818.11 150.80 667.31 - TOTAL 3543.74 2060.22 - - C. NET WORKING CAPITAL (A-B) 8007.73 2328.02 - - DECREASE IN WORKING CAPITAL - 5679.71 - - SUB-TOTAL - - 2553.43 8233.14 DECREASE IN WORKING CAPITAL - - 5679.71 - TOTAL 8007.73 8007.73 8233.14 8233.14
  • 13.
    13 | Pa g e STATEMENT OF CHANGES IN WORKING CAPITAL OF RELIANCE INDUSTRIES LIMITED FOR THE FINANCIAL YEAR OF 2017-2018(₹ in Lakhs) PARTICULARS BALANCE OF 2017 BALANCE OF 2018 EFFECTS ON WORKING CAPITAL A. CURRENT ASSETS - - INCREASE DECREASE CURRENT INVESTMENT 187.14 880.96 - 328.01 INVENTORIES 1208.97 177.26 - 9.88 TRADE RECEIVABLES 1926.79 1850.25 - 76.54 CASH & BANK BALANCES 323.58 199.42 - 124.16 CURRENT TAX ASSET 341.10 311.41 - 29.69 OTHER CURRENT ASSET 400.66 585.14 184.48 - OTHER FINANCIAL ASSET - 774.59 774.59 - TOTAL 4388.24 4779.03 - - B. CURRENT LIABILITIES - - - - TRADE PAYABLES 1466.81 1864.78 - 397.97 OTHER FINANCIAL LIABILITIES 102.66 118.35 - 15.69 OTHER CURRENT LIABILITIES 339.95 373.15 - 33.2 SHORT TERM PROVISIONS 150.80 159.07 - 8.27 TOTAL 2060.22 2515.35 - - C. NET WORKING CAPITAL (A-B) 2328.02 2263.68 - - DECREASE IN WORKING CAPITAL - 64.34 - - SUB-TOTAL - - 959.07 1023.41 DECREASE IN WORKING CAPITAL - - 64.34 - TOTAL 2328.02 2328.02 1023.41 1023.41
  • 14.
    14 | Pa g e STATEMENT OF CHANGES IN WORKING CAPITAL OF RELIANCE INDUSTRIES LIMITED FOR THE FINANCIAL YEAR OF 2018-2019(₹ in Lakhs) PARTICULARS BALANCE OF 2018 BALANCE OF 2019 EFFECTS ON WORKING CAPITAL A. CURRENT ASSETS - - INCREASE DECREASE CURRENT INVESTMENT 880.96 71.023 - 809.937 INVENTORIES 177.26 67.561 - 109.699 TRADE RECEIVABLES 1850.25 30.089 - 1820.161 CASH & BANK BALANCES 199.42 11.081 - 188.339 CURRENT TAX ASSET 311.41 - - 311.41 OTHER CURRENT ASSET 585.14 36.804 - 548.336 OTHER FINANCIAL ASSET 774.59 10.283 - 764.307 SHORT TERM LOAN (ADVANCES) - 0.545 0.545 - TOTAL 4779.03 227.386 - - B. CURRENT LIABILITIES - - - - TRADE PAYABLES 1864.78 108.309 1756.471 - OTHER FINANCIAL LIABILITIES 118.35 87.051 31.299 - OTHER CURRENT LIABILITIES 373.15 52.901 320.249 - SHORT TERM PROVISIONS 159.07 1.326 157.744 - SHORT TERM BORROWING - 64.436 - 64.436 TOTAL 2515.35 314.023 - - C. NET WORKING CAPITAL (A-B) 2263.68 -86.637 - - DECREASE IN WORKING CAPITAL - 2350.317 - - SUB-TOTAL - - 2266.308 4616.625 DECREASE IN WORKING CAPITAL - - 2350.317 - TOTAL 2263.68 2263.68 4616.625 4616.625
  • 15.
    15 | Pa g e STATEMENT OF CHANGES IN WORKING CAPITAL OF RELIANCE INDUSTRIES LIMITED FOR THE FINANCIAL YEAR OF 2019-2020(₹ in Lakhs) PARTICULARS BALANCE OF 2019 BALANCE OF 2020 EFFECTS ON WORKING CAPITAL A. CURRENT ASSETS - - INCREASE DECREASE CURRENT INVESTMENT 71.023 72.915 1.892 - INVENTORIES 67.561 73.903 6.342 - TRADE RECEIVABLES 30.089 19.656 - 10.433 CASH & BANK BALANCES 11.081 30.920 19.839 - OTHER CURRENT ASSET 36.804 32.763 - 4.041 OTHER FINANCIAL ASSET 10.283 27.434 17.151 - SHORT TERM LOAN (ADVANCES) 0.545 0.669 0.124 - TOTAL 227.386 258.26 - - B. CURRENT LIABILITIES - - - - TRADE PAYABLES 108.309 96.799 11.51 - OTHER FINANCIAL LIABILITIES 87.051 144.778 - 57.727 OTHER CURRENT LIABILITIES 52.901 75.663 - 22.762 SHORT TERM PROVISIONS 1.326 1.89 - 0.564 SHORT TERM BORROWING 64.436 93.786 - 29.35 TOTAL 314.023 412.916 C. NET WORKING CAPITAL (A-B) -86.637 -154.656 - - DECREASE IN WORKING CAPITAL - 68.019 - - SUB-TOTAL - - 56.858 124.877 DECREASE IN WORKING CAPITAL - - 68.019 - TOTAL -86.637 -86.637 124.877 124.877
  • 16.
    16 | Pa g e RATIO ANALYSIS OF RELIANCE INDUSTRIES LIMITED FROM THE YEAR 2015-2020 RATIOS 2020 2019 2018 2017 2016 2015 Current Ratio 0.63 0.73 0.59 0.62 0.69 0.99 Quick Ratio 0.45 0.52 0.39 0.42 0.44 0.60 Inventory Turnover Ratio 9.32 9.73 7.84 6.91 5.88 7.06 Debtors Turnover Ratio 26.50 26.24 33.48 52.21 59.93 52.74 Creditors Turnover Ratio 4.68 4.40 3.66 3.89 3.94 5.68 Cash Ratio 0.01 0.01 0.01 0.01 0.06 0.09 Debt Collection Period(365 days) 13.77 13.91 10.90 6.99 6.09 6.92 Credit Collection Period(365 days) 77.87 82.92 99.48 93.81 92.56 64.15 Working Capital to Sales Ratio -0.441 -0.102 0.254 0.705 2.731 1.944 Working Capital Ratio -0.132 -0.086 0.056 0.061 0.221 0.209 Working Capital Turnover Ratio -2.268 -9.763 3.925 1.418 0.366 0.514 Working Capital to Net Worth Ratio -0.347 -0.228 0.064 0.068 0.265 0.249 Current Asset to Total Asset Ratio 0.221 0.226 0.121 0.114 1.44 0.295 Net Working Capital (₹ in Lakhs) - 154.65 6 -86.637 2263.6 8 2328.02 8007.7 3 7299.4 4
  • 17.
    17 | Pa g e To analyze the efficiency of working capital management various liquidity ratios are used- • Current Ratio - The current ratio is a liquidity ratio that measures whether or not a firm has enough resources to meet its short-term obligations. Current Ratio = Current Assets/ Current Liabilities • Quick Ratio - The quick ratio is an indicator of a company's short-term liquidity position, and measures a company's ability to meet its short- term obligations with its most liquid assets. Quick ratio = (Cash and Equivalents + Marketable Securities + Accounts Receivable)/Current Liabilites • Cash Ratio - The cash ratio is the ratio of a company's total cash and cash equivalents (CCE) to its current liabilities. The metric calculates a company's ability to pay current liabilities using only cash and cash equivalents on hand Cash Ratio = Cash & Cash Equivalents/ Current Liabilities • Inventory Turnover Ratio - Inventory turnover is a ratio showing how many times a company has sold and replaced inventory during a given period. Inventory turnover measures how fast a company sells inventory and how analysts compare it to industry averages. Inventory Turnover Ratio = Cost Of Goods Sold/Average Inventory • Debtors Turnover Ratio - The receivables turnover ratio is an accounting measure used extending credit and in collecting debts on that credit. In essence, it quantify a firm's effectiveness in indicates the efficiency with which a firm collects on the credit it issues to customers. Debtors Turnover Ratio = Net Credit Sales/Average Accounts Receivables
  • 18.
    18 | Pa g e • Debt Collection Period - Debtor Turnover Ratio can be converted into the number of days within which the cash is collected from the debtors. It is expressed in number of days. It is calculated as, Debt Collection Period = 365/ Debtors Turnover Ratio • Creditors Turnover Ratio- The accounts payable turnover ratio is a short-term liquidity measure used to quantify the rate at which a company pays off its suppliers. The measure shows investors how many times per period the company pays its accounts payable. Creditors Turnover Ratio =Total Supplier Purchases/ Average Accounts Payable • Credit Collection Period – Creditor Turnover Ratio can be converted into the number of days taken by the firm to make payment to its trade payables. It is expressed in the number of days. Credit Collection Period = 365/ Credit Turnover Ratio • Working Capital Turnover Ratio – This ratio reveals how efficiently working capital has been utilized in making revenue from operations. A high working capital turnover ratio shows efficient use of working capital & quick turnover of current assets like inventory and trade receivables. However a very high ratio is not desirable as it shows doing business with too little working capital. It is calculated as follows, Working Capital Turnover Ratio- Net Revenue From Operations/ Working Capital • Working Capital To Net Worth Ratio = Working Capital/ Net Worth = Total Assets – Total Liabilities/ Current Assets – Current Liabilities • Current Asset To Total Asset Ratio – This ratio helpd in measuring the liquidity of the company. A company with a high ratio indicates high liquidity & vice versa. It is calculated as follows,
  • 19.
    19 | Pa g e Current Asset To Total Asset Ratio= Current Assets/ Total Assets • Working Capital To Sales Ratio : When companies use the same working capital to generate more sales, it means that they are using the same funds over and over again. This is why this ratio is also called “Working Capital Turnover Ratio” as it measures the number of times working capital has been turned over. The higher the sales, the more the profits and therefore the more appropriate use of working capital has been made. It is calculated as follows, Working Capital To Sales Ratio = Working Capital/ Sales • Net Working Capital - Net working capital (NWC) is the difference between a company's current assets and current liabilities. It is a liquidity calculation that measures a company's ability to pay off its current liabilities with current assets. This measurement is important to management, vendors, and general creditors because it shows the firm's short- term liquidity as well as management's ability to use its assets efficiently. Net Working Capital= Current Assets-Current Liabilities Trend Analysis
  • 20.
    20 | Pa g e Trend analysis is based on historical data about the stock's performance given the overall trends of the market and particular indicators within the market. When trend analysis is performed, a company is able to see if its financial position is improving or declining based on the percentage change in the balance sheet accounts. Trend analysis is useful because it helps management determine if certain items are impacting the organization in a negative way if they are consistently decreasing over time. Trend Analysis is done of all the components of current assets as well as current liabilities of Reliance Industries Limited of past 6 years (2015-2020). Data Analysis & Interpretation Current Ratios As it can be implied from the graph that current ratio of Reliance Industries went down continuously from 2015-18 but in the year 2018-19 it went upto 0.73 and in the year 2019-20 it reaches 0.63. • Current Ratio of Reliance Industries is 0.63 which is below 1 and it is a good sign as company squeezes out short term cash sources to achieve a capital intensive plan with a longer term outlook. • Reliance manages its liquidity and funding risk by diversifying its resource base and tapping new investor pools across different markets. Quick Ratio Quick ratio of Reliance Industry also shows a fluctuating trend in the past 5 years. In the year 2020 quick ratio reaches to 0.45 which is basically due to sharp increase in other current liabilities and financial liabilities which includes advances from customers and statutory dues. Inventory Turnover Ratio 0 0.2 0.4 0.6 0.8 1 1.2 2015 2016 2017 2018 2019 2020 Current Ratio Quick Ratio
  • 21.
    21 | Pa g e Inventory Turnover Ratio indicates how many times average inventory is turned or sold during a period. Inventory Turnover Ratio of Reliance Industries keeps on fluctuating in the last 5 years. In the year 2020 it is 9.32 and inventory days is 78 days which means that company does not overspend by buying too much inventory and wastes resources by storing non-salable inventory as a result it shows its efficiency to sell its inventory. Some of the reasons for efficient inventory management by Reliance area: • Digitization and automation initiatives to transform supply chain and deliver unparalleled customer experience at an unmatched cost basis. • Utilizing robotics and Artificial Intelligence in product handling, ware-housing and inventory management. • Expanding portfolio to advanced materials and composites to diversify RIL's market offerings and make RIL future ready Receivables Turnover Ratio 0 2 4 6 8 10 12 2015 2016 2017 2018 2019 2020 Inventory Turnover Ratio Inventory Turnover Ratio
  • 22.
    22 | Pa g e Debtors Turnover Ratio of Reliance Industries tends to decrease from the year 2016 which shows that the firm uses liberal credit policy for its customers. It allows customers more time to pay, this can have a significant drag on a company's resources, because it is money that is not coming in as quickly. Creditors Turnover Ratio Creditors Turnover Ratio of Reliance Industries tend to rise in the last five years. In the year 2020 Creditors Turnover Ratio is 4.68. The accounts payable turnover ratio indicates how many times a company pays off its suppliers during an accounting period. It also measures how a company manages paying its own bills. A high ratio of 4.68 indicates faster payment to suppliers for purchases on credit. This may be due to favorable credit terms and implies that the company has successfully managed to make the payments faster to its suppliers. Cash Ratio 0 10 20 30 40 50 60 70 2015 2016 2017 2018 2019 2020 Debtors Turnover Ratio Debtors Turnover Ratio 0 1 2 3 4 5 6 2015 2016 2017 2018 2019 2020 Creditors Turnover Ratio Creditors Turnover Ratio
  • 23.
    23 | Pa g e Cash ratio of Reliance Industries also shows a constant trend in the last 3 years with a decline in cash and cash equivalents along with sharp increase in current liabilities. It also implies a very high liquidity position, the firm does not hold large amount of cash. One of the main reason for reliance high liquidity position is tight management of cash to cash cycle by extending the payable WORKING CAPITAL TO SALES RATIO: From the above graph, the relationship between working capital and net sales is depicted. If we look at the results of the second graph, for FY 2020 the ratio of WC to sales is -0.441 i.e. for one rupee of sales, the company needs Rs -0.441 of net current assets (working capital). This gap will be met from bank borrowings and long term sources of funds. WORKING CAPITAL RATIO 0 0.02 0.04 0.06 0.08 0.1 2015 2016 2017 2018 2019 2020 Cash Ratio Cash Ratio -1 0 1 2 3 4 5 2015 2016 2017 2018 2019 2020 Working Capital To Sales Ratio Working Capital To Sales Ratio
  • 24.
    24 | Pa g e As it is shown in the graph, the following observations can be made: A company having a higher NWC ratio has a greater ability to meet its current obligations. From a conservative position of 2015 where the ratio was the highest at 0.209,it has now settled at (0.132) which is on the lower side. As this ratio represents a firms potential reservoir of funds, a declining trend should be taken seriously and appropriate remedial measures need to be taken so as to avert a more troubled situation. WORKING CAPITAL TURNOVERRATIO It shows the relationship between the working capital and sales. The firm should maintain a steady working capital position. It should have adequate working capital to run its business operations. Both excessive and inadequate working capital positionsaredangerousfromafirm‟spointofviewexcessiveworkingcapitalmeansholding costs -0.15 -0.1 -0.05 0 0.05 0.1 0.15 0.2 0.25 2015 2016 2017 2018 2019 2020 Working Capital Ratio Working Capital Ratio -12 -10 -8 -6 -4 -2 0 2 4 6 2015 2016 2017 2018 2019 2020 Working Capital Turnover Ratio Working Capital Turnover Ratio
  • 25.
    25 | Pa g e and idle funds which earns no profits for the firms. Paucity of working capital not only impairsfirm‟sprofitabilitybutalsoresultsinproductioninefficienciesandinterruptionsand also sales disruptions WORKING CAPITAL TO NET WORTH RATIO Similar to the previous ratio, WC to Net Worth ratio is used to represent the relationship between the shareholders money and the net worth. Similar to previous ratio, for FY2020 the ratio of (0.347) shows that for each rupee of net worth, the company needs Re. (0.347) of working capital. This gap will be met from bank borrowings and long term sources of funds. CURRENT ASSETS TO TOTAL ASSETS RATIO Current Assets to Total Assets ratio of Reliance Industries tend to rise in the last five years.RIL during the last five years has managed to keep a pretty healthy current assets ratio with an average minimum 10%. For an infrastructure company such levels of current assets help to -0.4 -0.3 -0.2 -0.1 0 0.1 0.2 0.3 2015 2016 2017 2018 2019 2020 Working Capital To Net Worth Ratio Working Capital To Net Worth Ratio 0 0.2 0.4 0.6 0.8 1 1.2 1.4 1.6 2015 2016 2017 2018 2019 2020 Current Assets To Total Assets Ratio Current Assets To Total Assets Ratio
  • 26.
    26 | Pa g e carry on daily operations without any difficulty and projects completed without such glitches also results in huge cost savings thus ultimately resulting in higher profits. A high ratio also guarantees that the company would never default on its current obligations thus maintaining a steady relationship with its suppliers. Net Working Capital Net Working Capital of Reliance Industries Limited is negative from the past two years. The main reason behind Negative working capital is sharp increase in both the other current & financial liabilities which basically includes advances from customers and statutory dues & current maturities of borrowings. Negative Working Capital • It implies that the whole of current assets are financed by the current liabilities and a portion of fixed asset is also financed by them. • On the other hand, it may be understood that the portion of current liabilities other than current assets is invested in short-term investments to earn interest from them. Apart from this reliance believes that the group has sufficient working capital resource for foreseeable requirements. It continuously monitors and optimises its working capital requirements by leveraging diverse trade financing solutions covering receivable and payable cycles and executing innovative structured trade products. -1000 0 1000 2000 3000 4000 5000 6000 7000 8000 9000 2015 2016 2017 2018 2019 2020 Net Working Capital Net Working Capital
  • 27.
    27 | Pa g e CONCLUSION The study of Working capital components, structure, policies and management of Reliance Industry states that it very effective and efficient in managing its working capital. Reliance believes that the group has sufficient working capital resource for foreseeable requirements. It continuously monitors and optimizes its working capital requirements by leveraging diverse trade financing solutions covering receivable and payable cycles and executing innovative structured trade products. Following are the conclusion derived from the project- • The company's negative working capital states that the whole of current assets are financed by the current liabilities and a portion of fixed asset is also financed by them and it's a very good sign for the company. • Reliance industry achieves liberal credit policy from its suppliers which in turn helps the company to use that money in its operating activities. As far as debtors are concerned it also provides a liberal credit policy to its customers so as to build a huge customer base. • Low current and quick ratio of RIL reveals that company squeezes out short term cash sources to achieve a capital intensive plan with a longer term outlook. • Inventory Turnover Ratio increasing from 7.06 to 9.32 states the company's efficiency in managing its inventory by using techniques like Artificial Intelligence, Robotics in inventory management and handling. • Creditors Turnover Ratio of Reliance Industries tends to be in the rang e of 3.66 – 5.68 which (RIL, 2015-2020) indicates slow payment to suppliers for purchases on credit. This may be due to favorable credit terms and implies that the company has successfully managed to negotiate better payment terms which allow it to make payments less frequently, without any penalty. • Receivables Turnover Ratio Debtors Turnover Ratio of Reliance Industries tends to decrease from the year 2015 - 2020 which shows that the firm uses liberal credit policy for its customers. It allows customers more time to pay, this can have a significant drag on a company's resources, because it is money that is not coming in as quickly. • Declining cash ratio from the year 2015 to 2016 and later stagnant from 0.01 also implies a very high liquidity position, the firm does not hold large amount of cash. Overall Reliance Industries Limited is very efficient in managing its working capital which in turn contributes to achieve its objectives in short as well as long term. Reliance also believes that the group has sufficient working capital resource for foreseeable requirements. It continuously monitors and optimizes its working capital requirements by leveraging diverse trade financing solutions covering receivable and payable cycles and executing innovative structured trade products.
  • 28.
    28 | Pa g e BIBLIOGRAPHY 1) (Sanjay Borad, 2019) 2) (GOEL, 2017) 3) (RIL, 2015-2020) 4) (TOUVILA, 2019) 5) (BAJAJ FINSERV, 2020) 6) (CFAINSTITUTE, 2020) 7) (WIKIPEDIA, 2020)
  • 29.
    29 | Pa g e THANK YOU