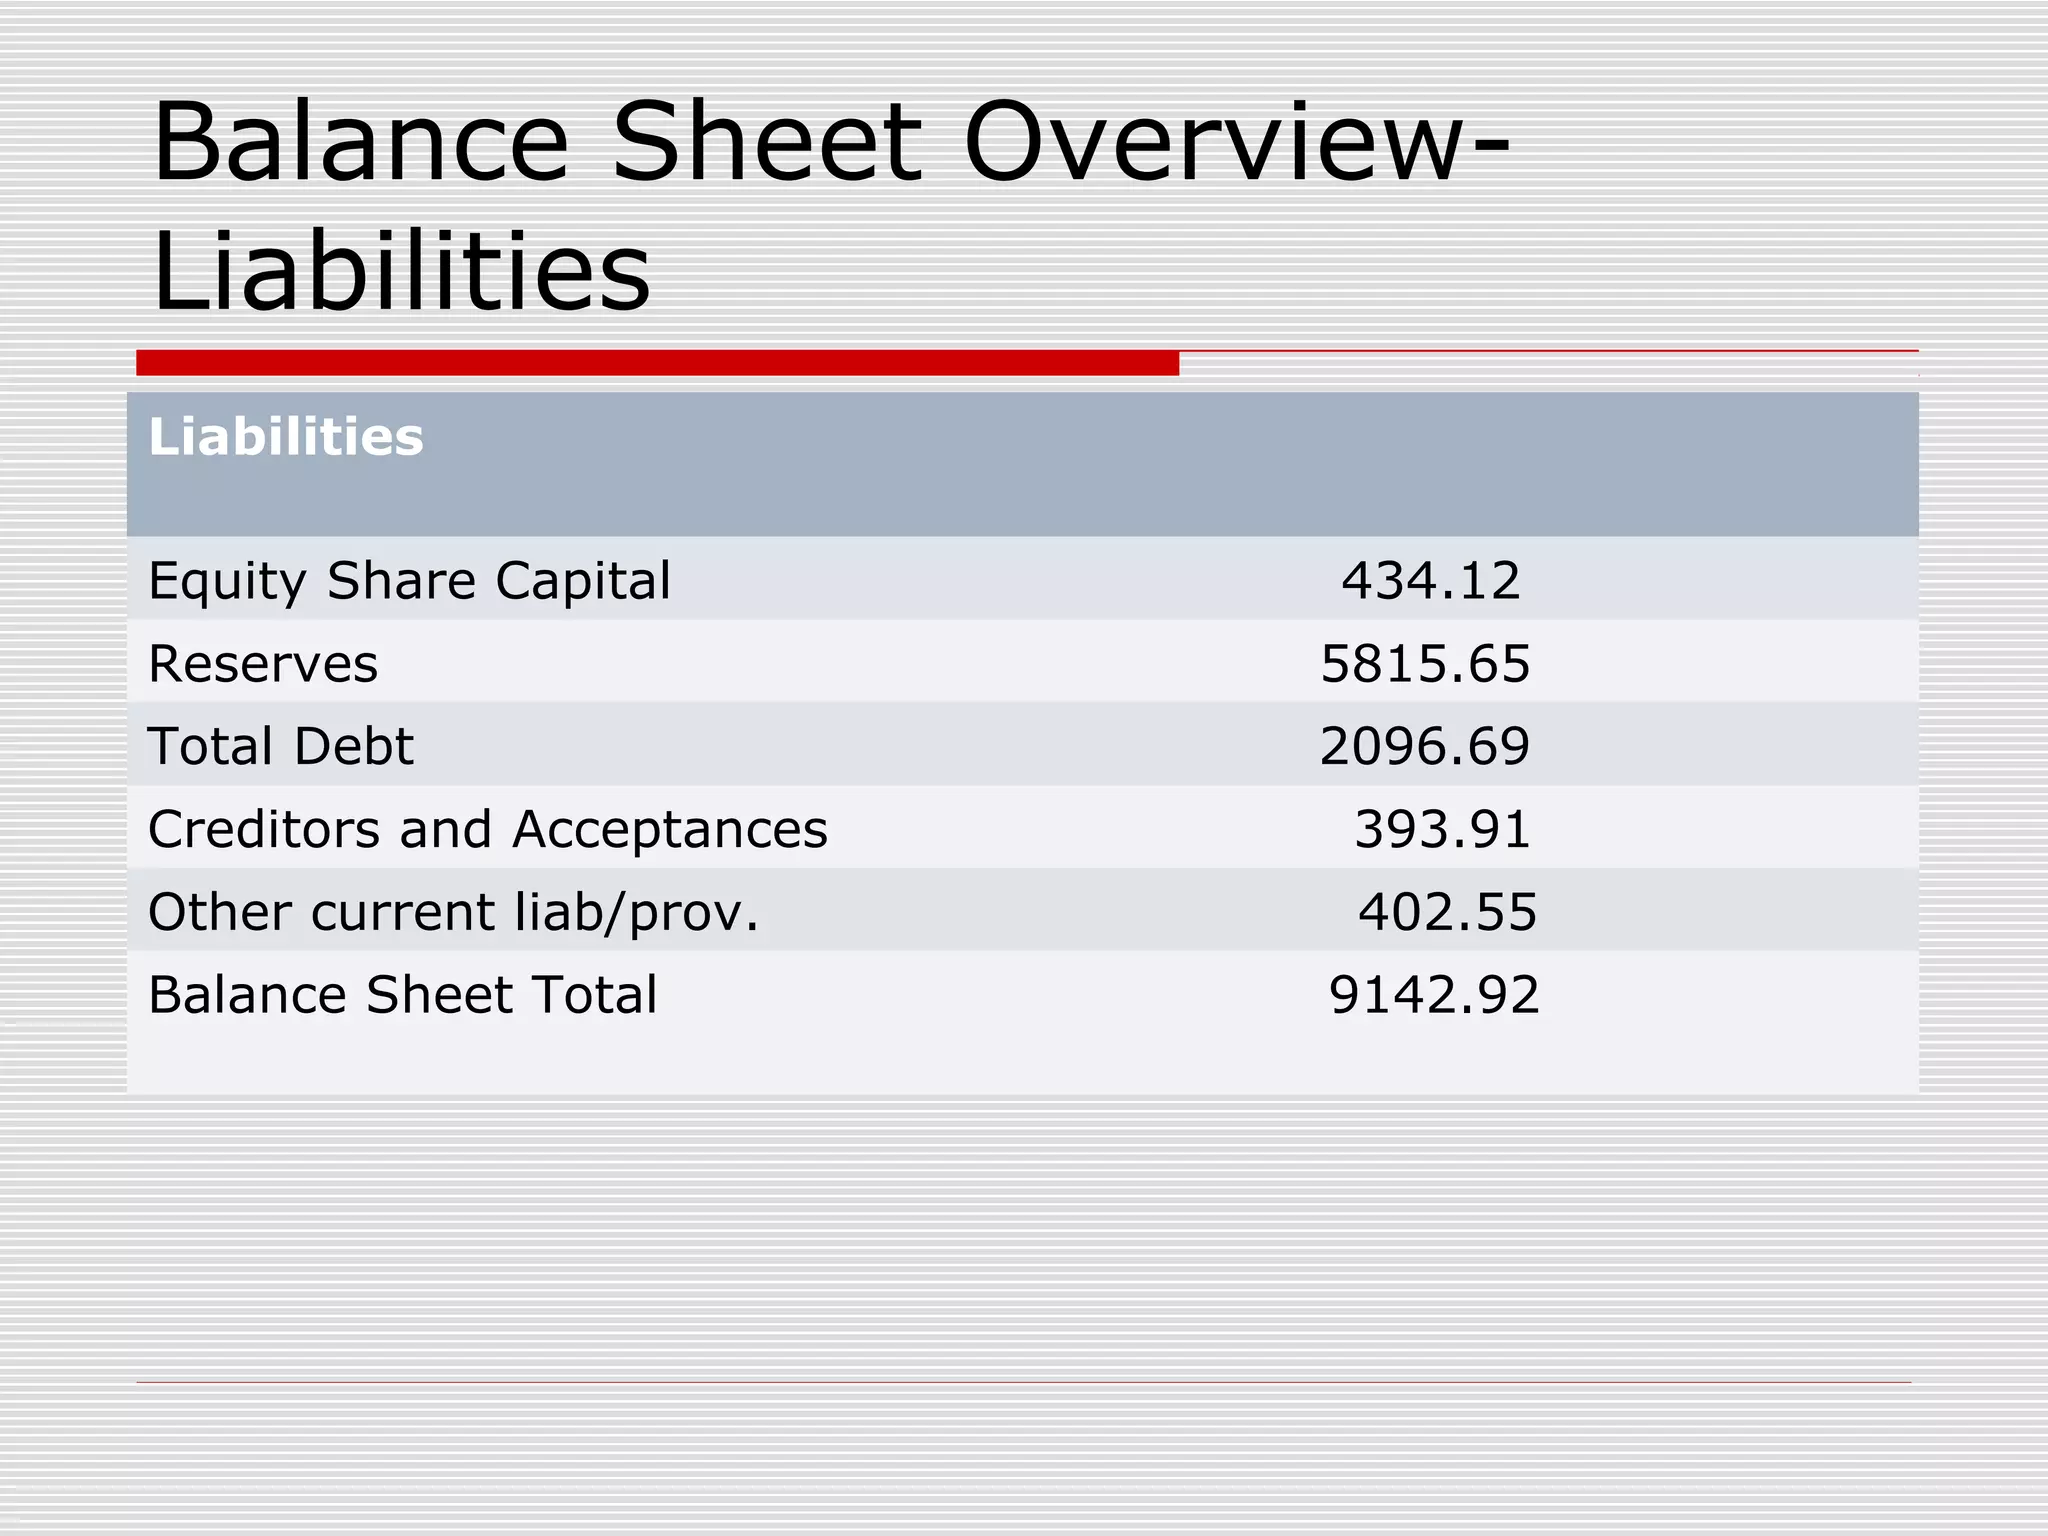
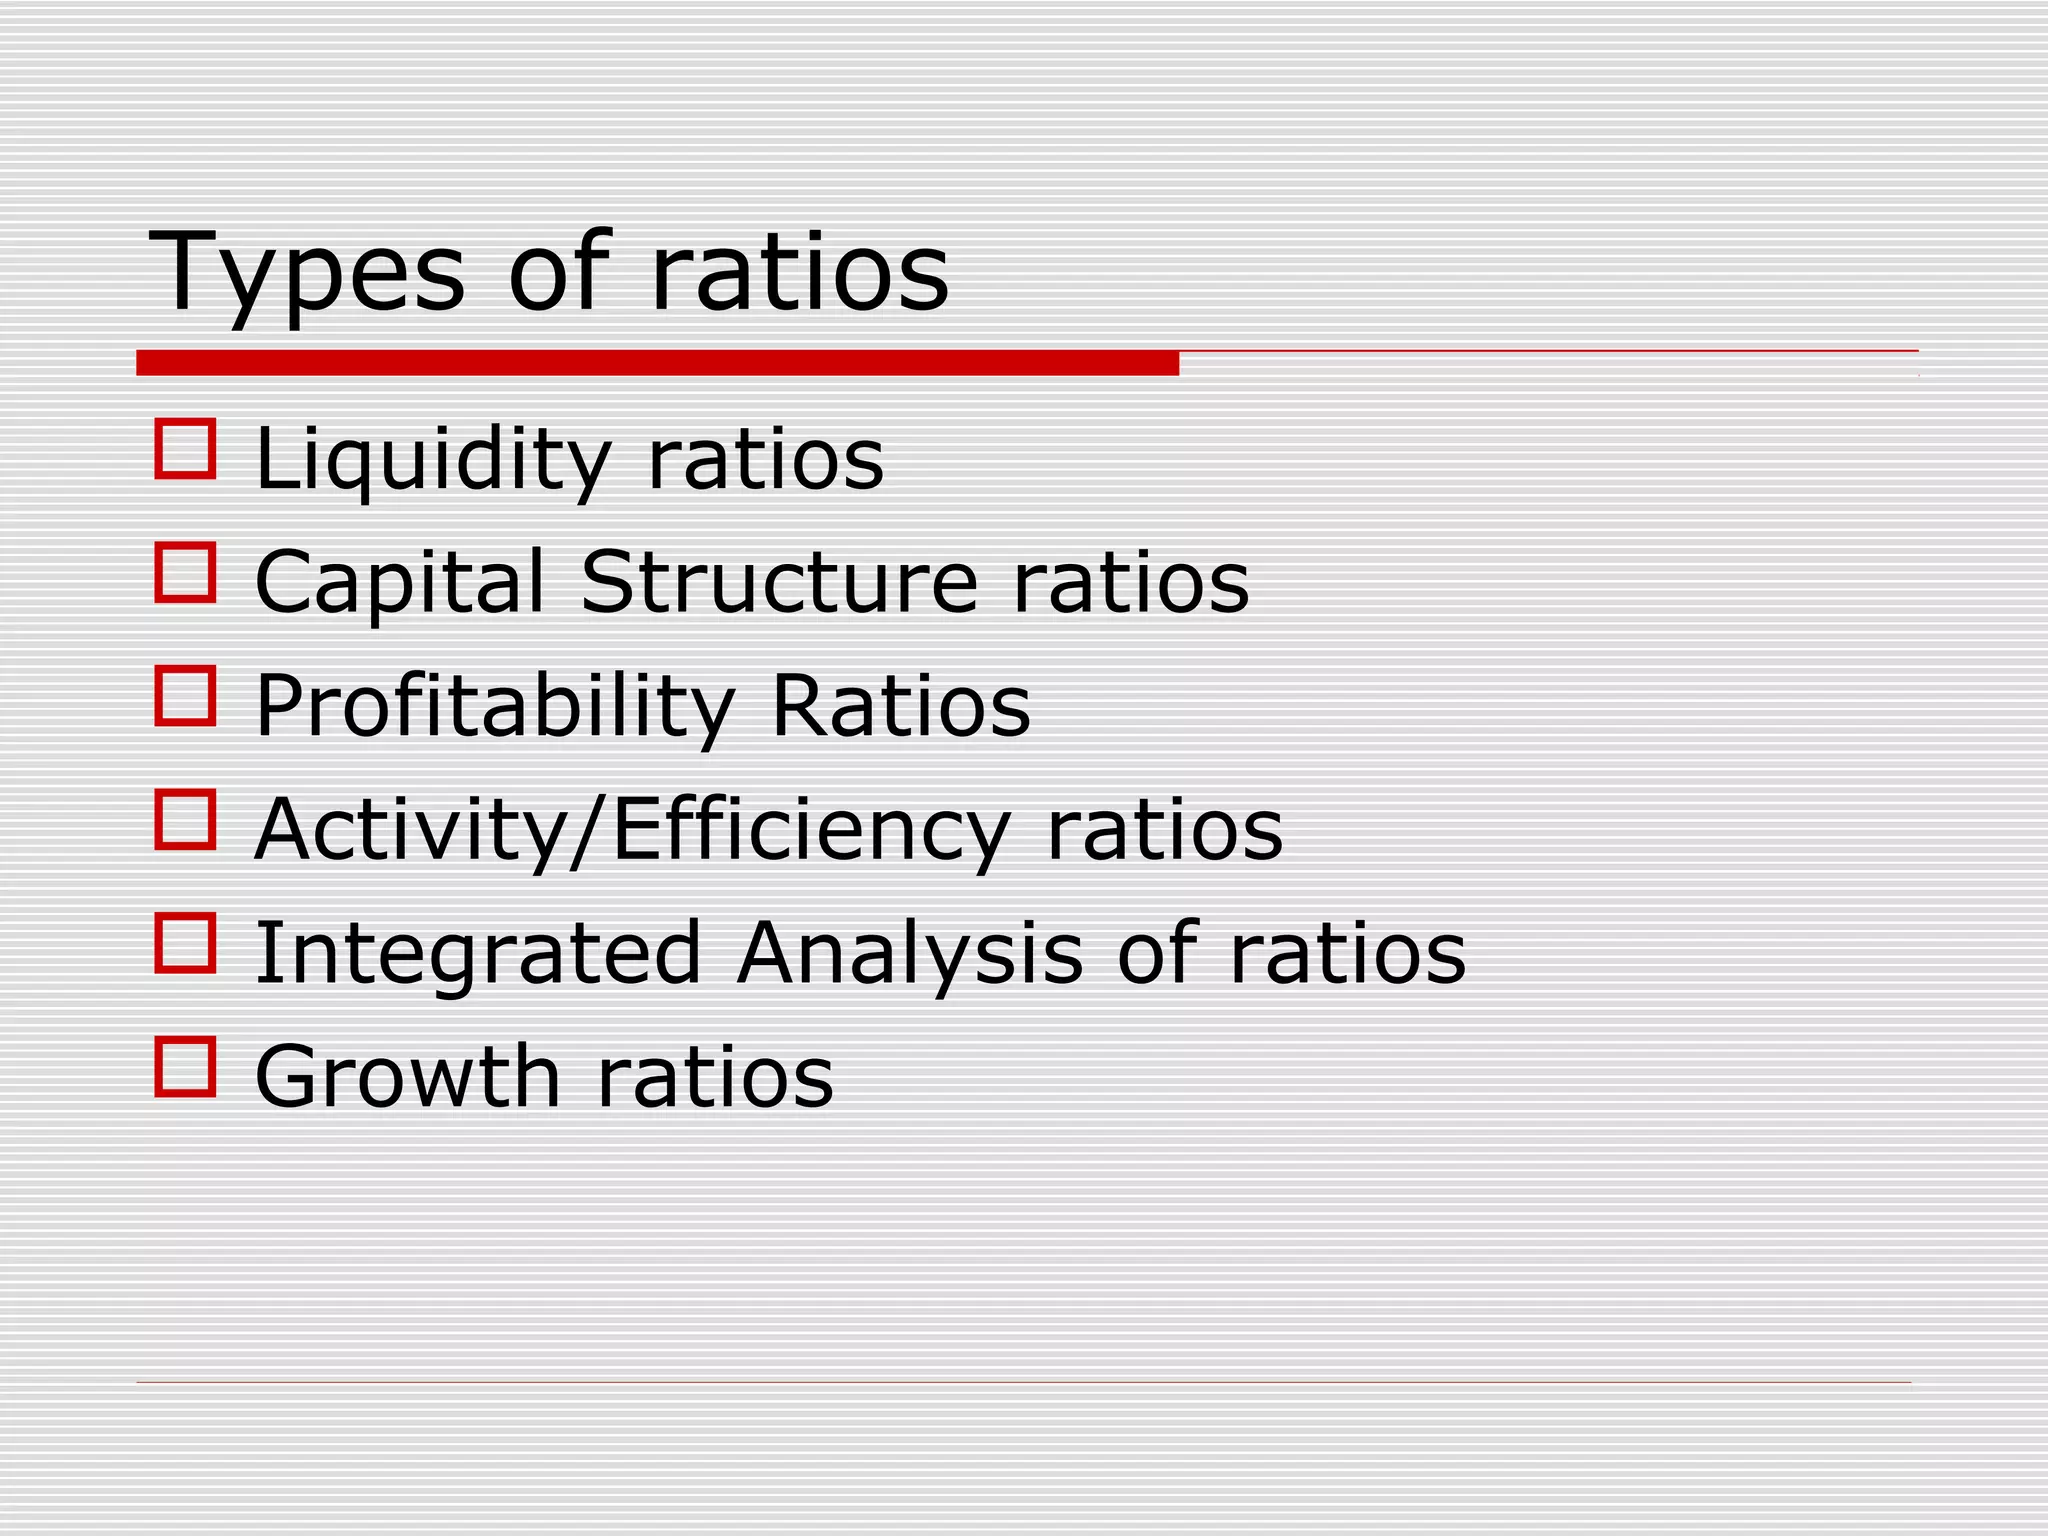
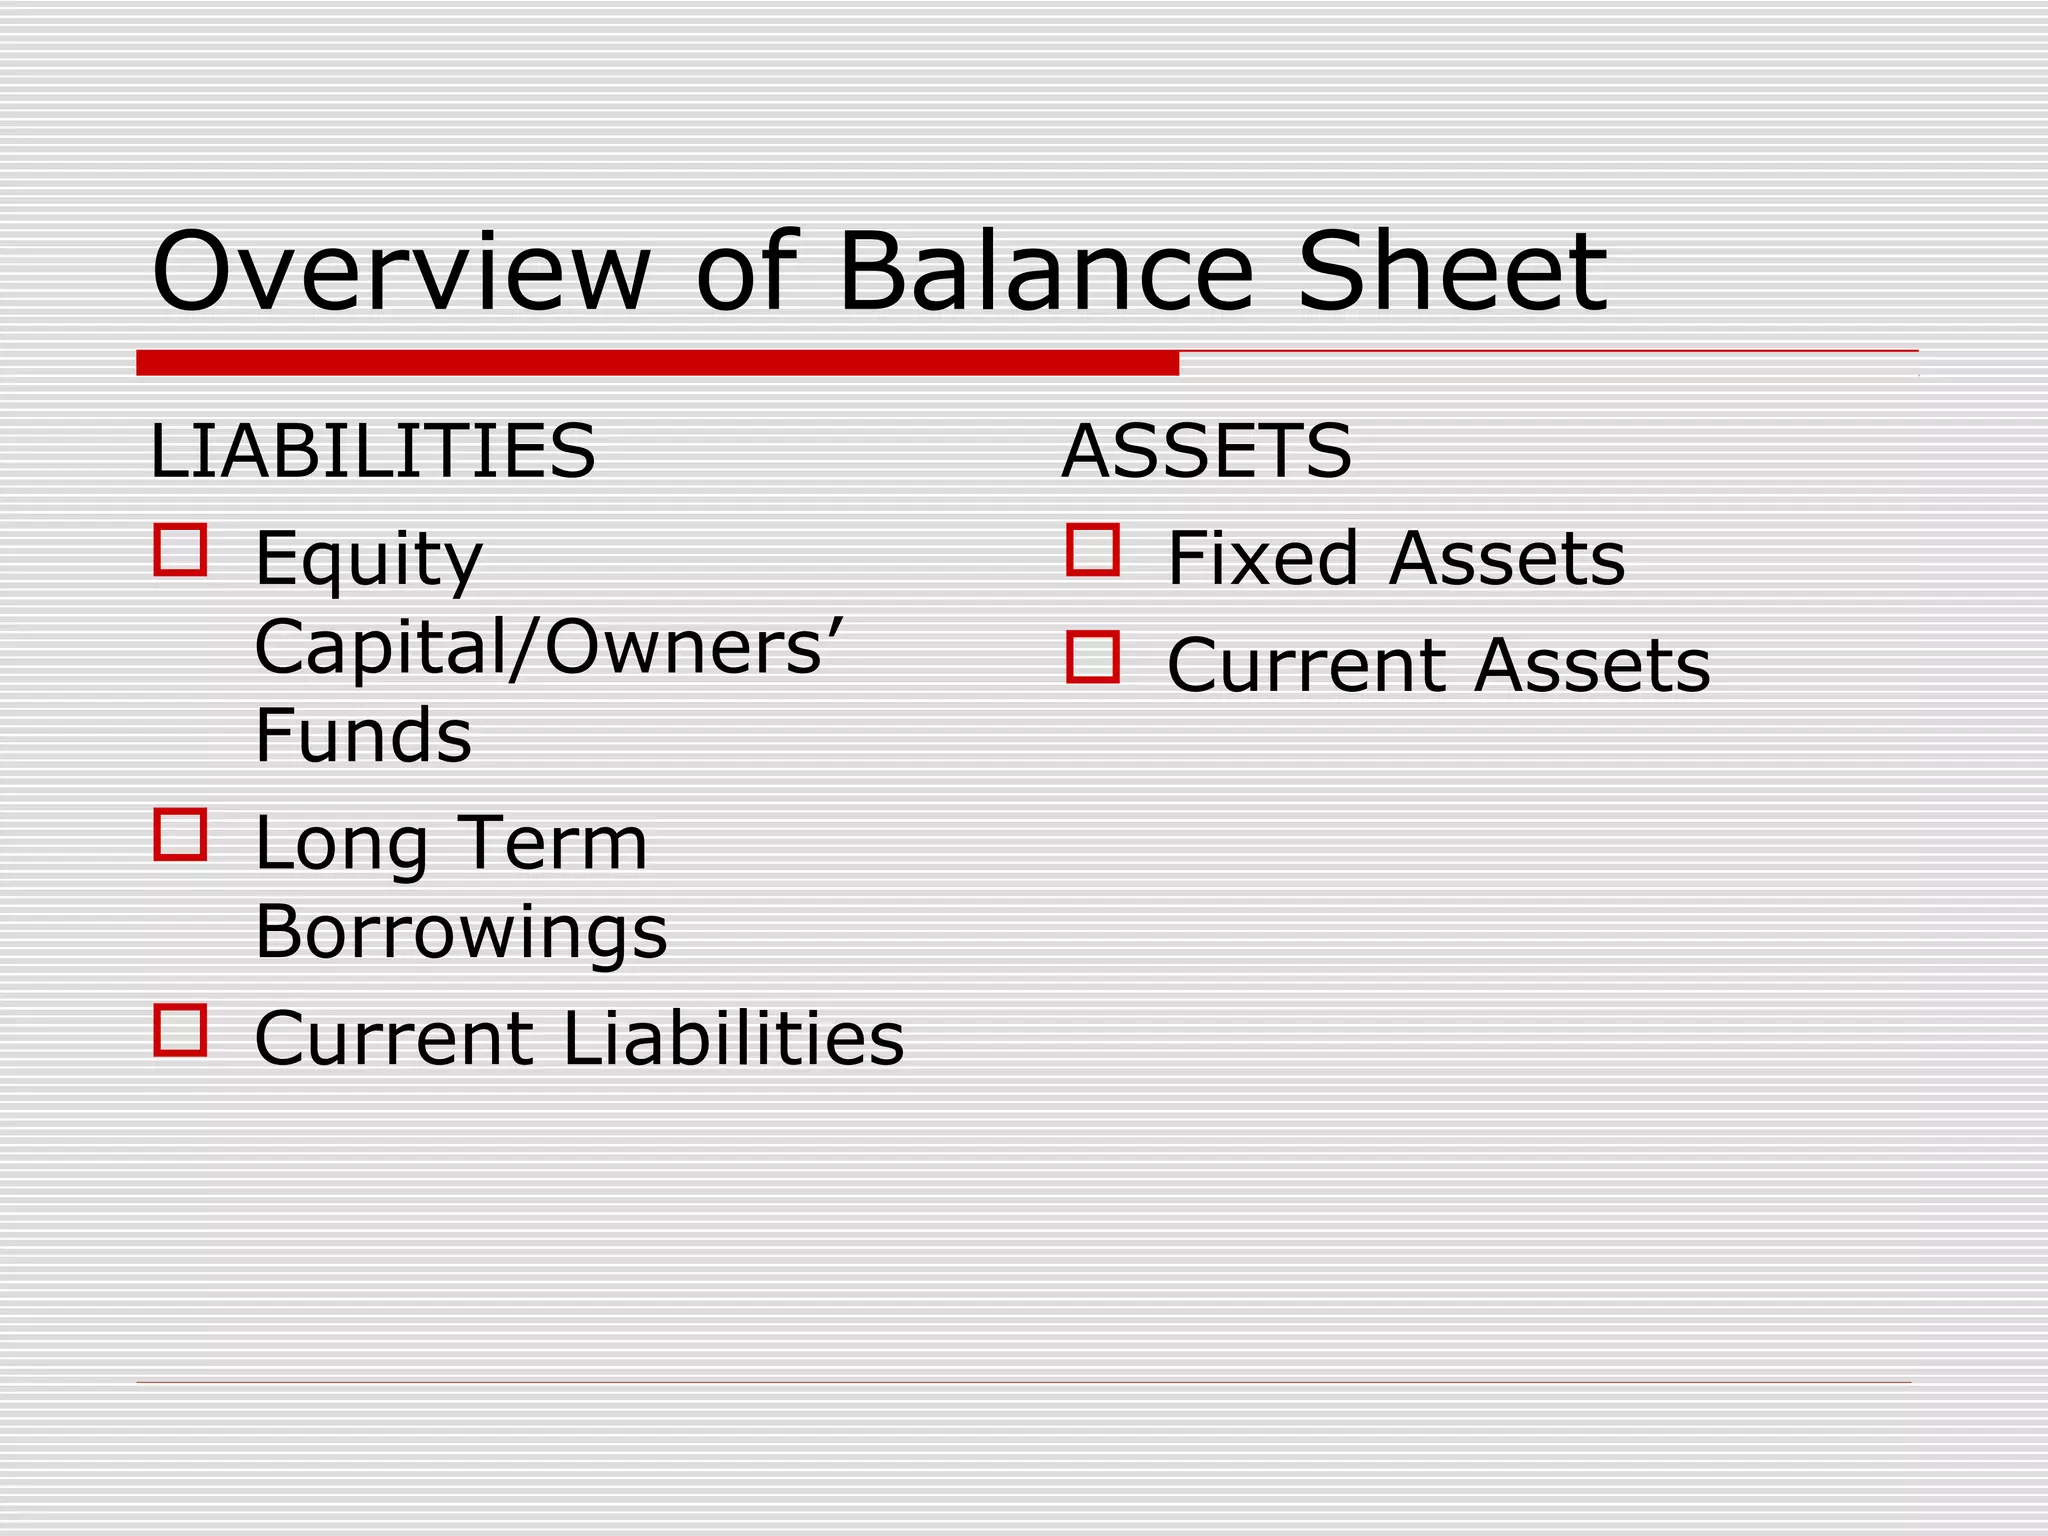
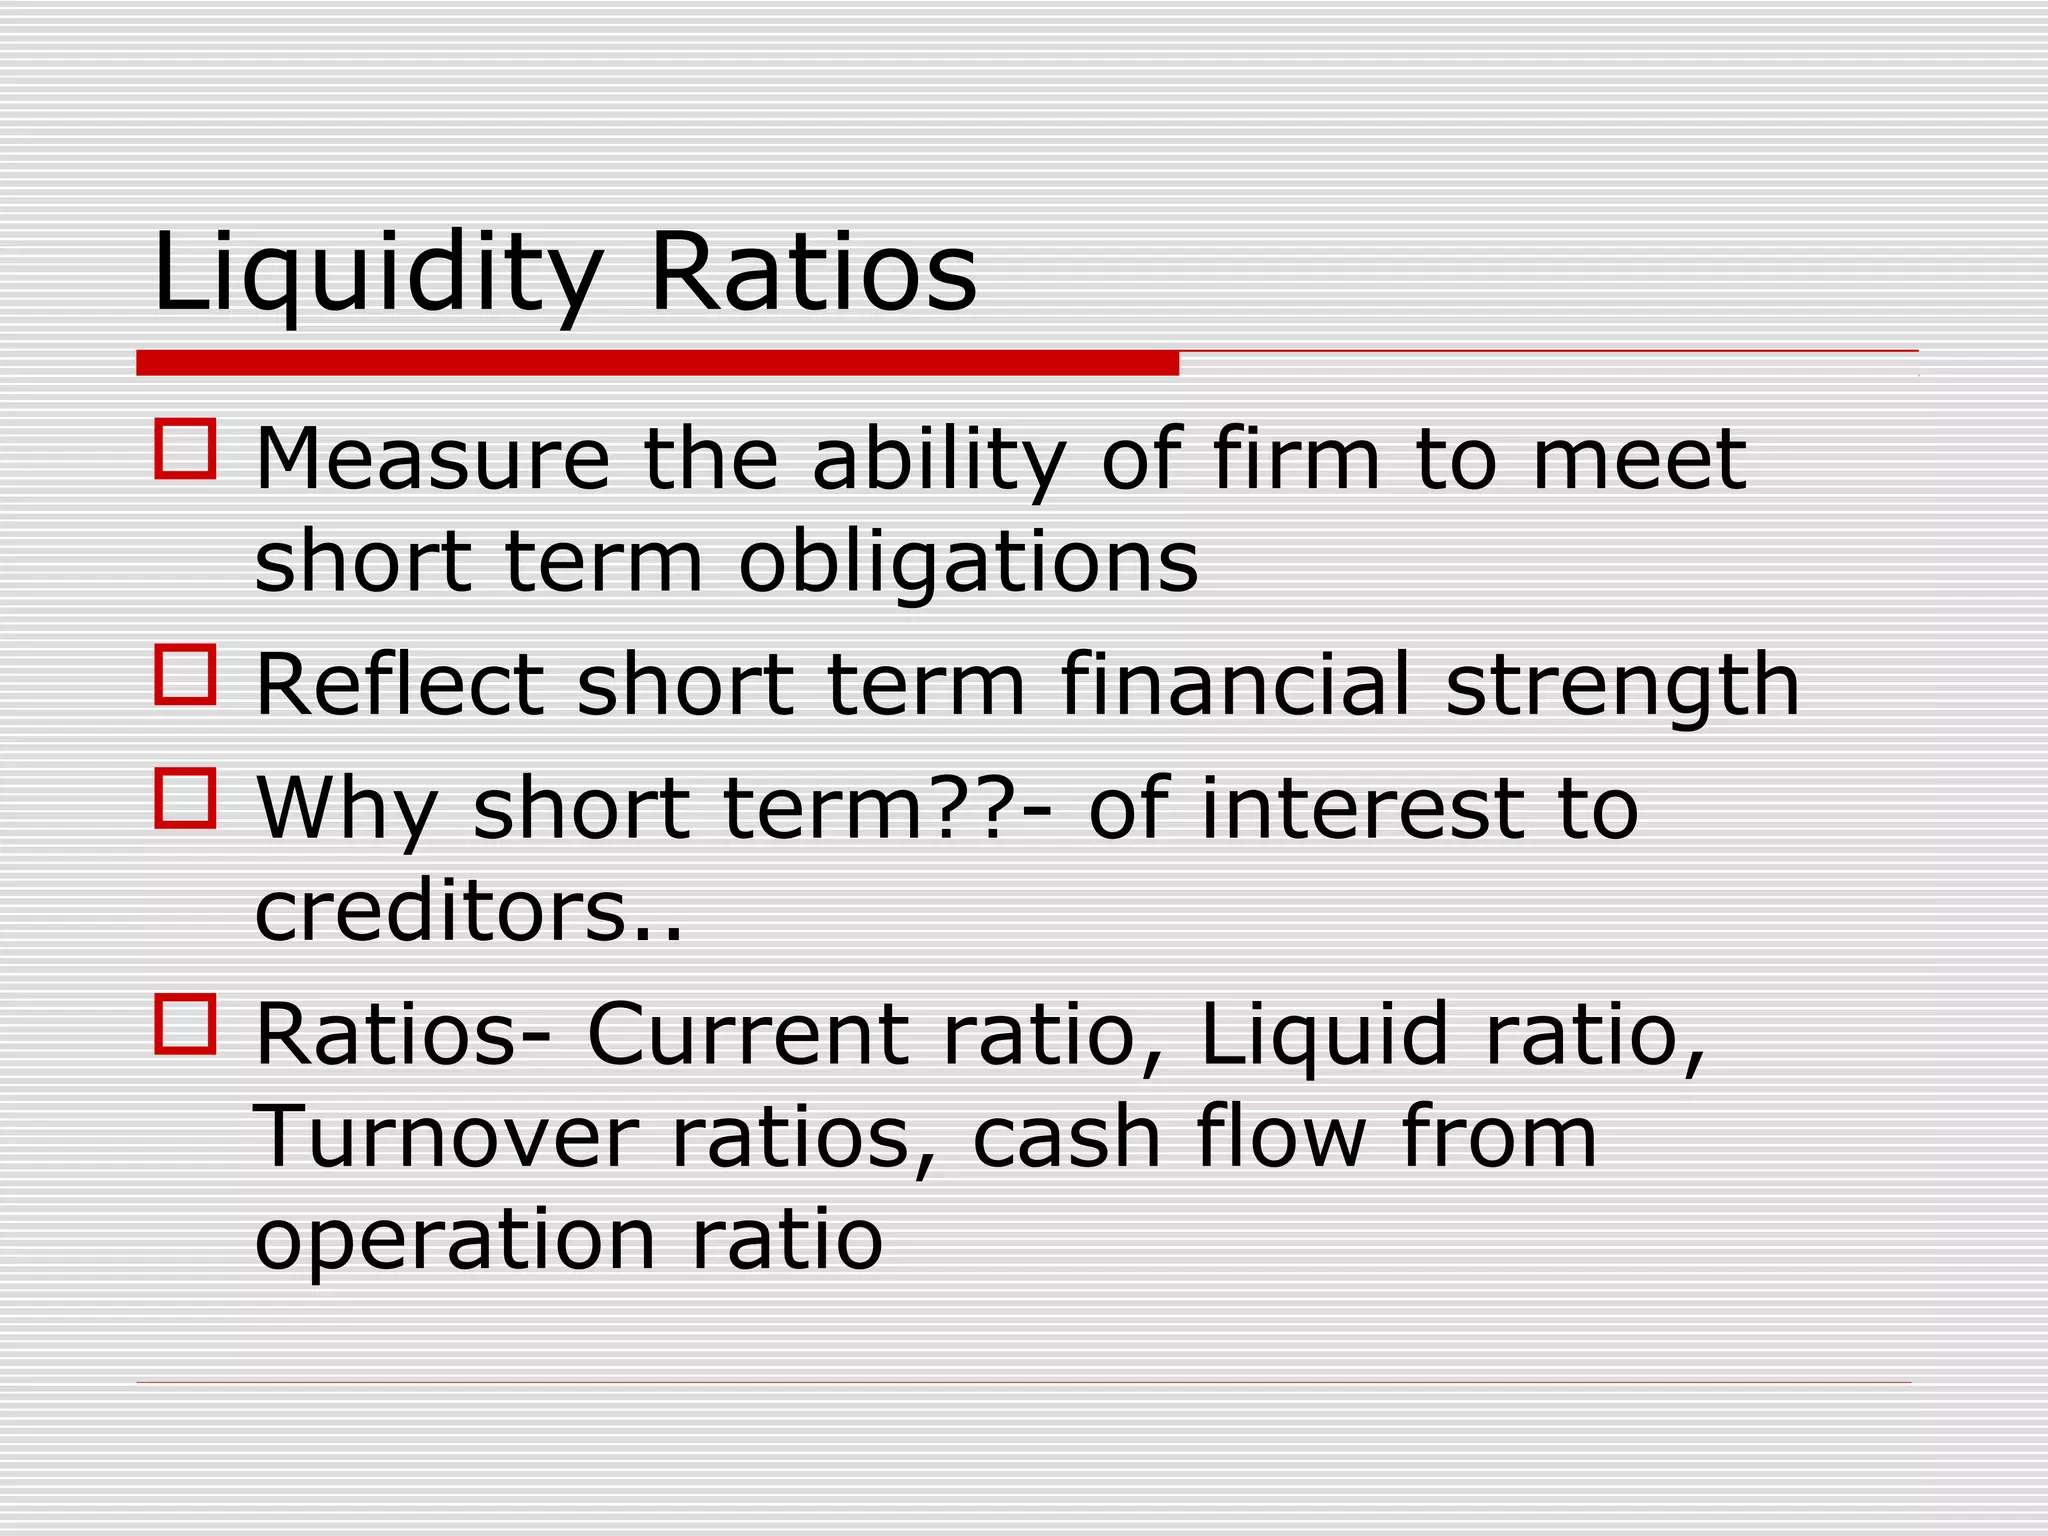
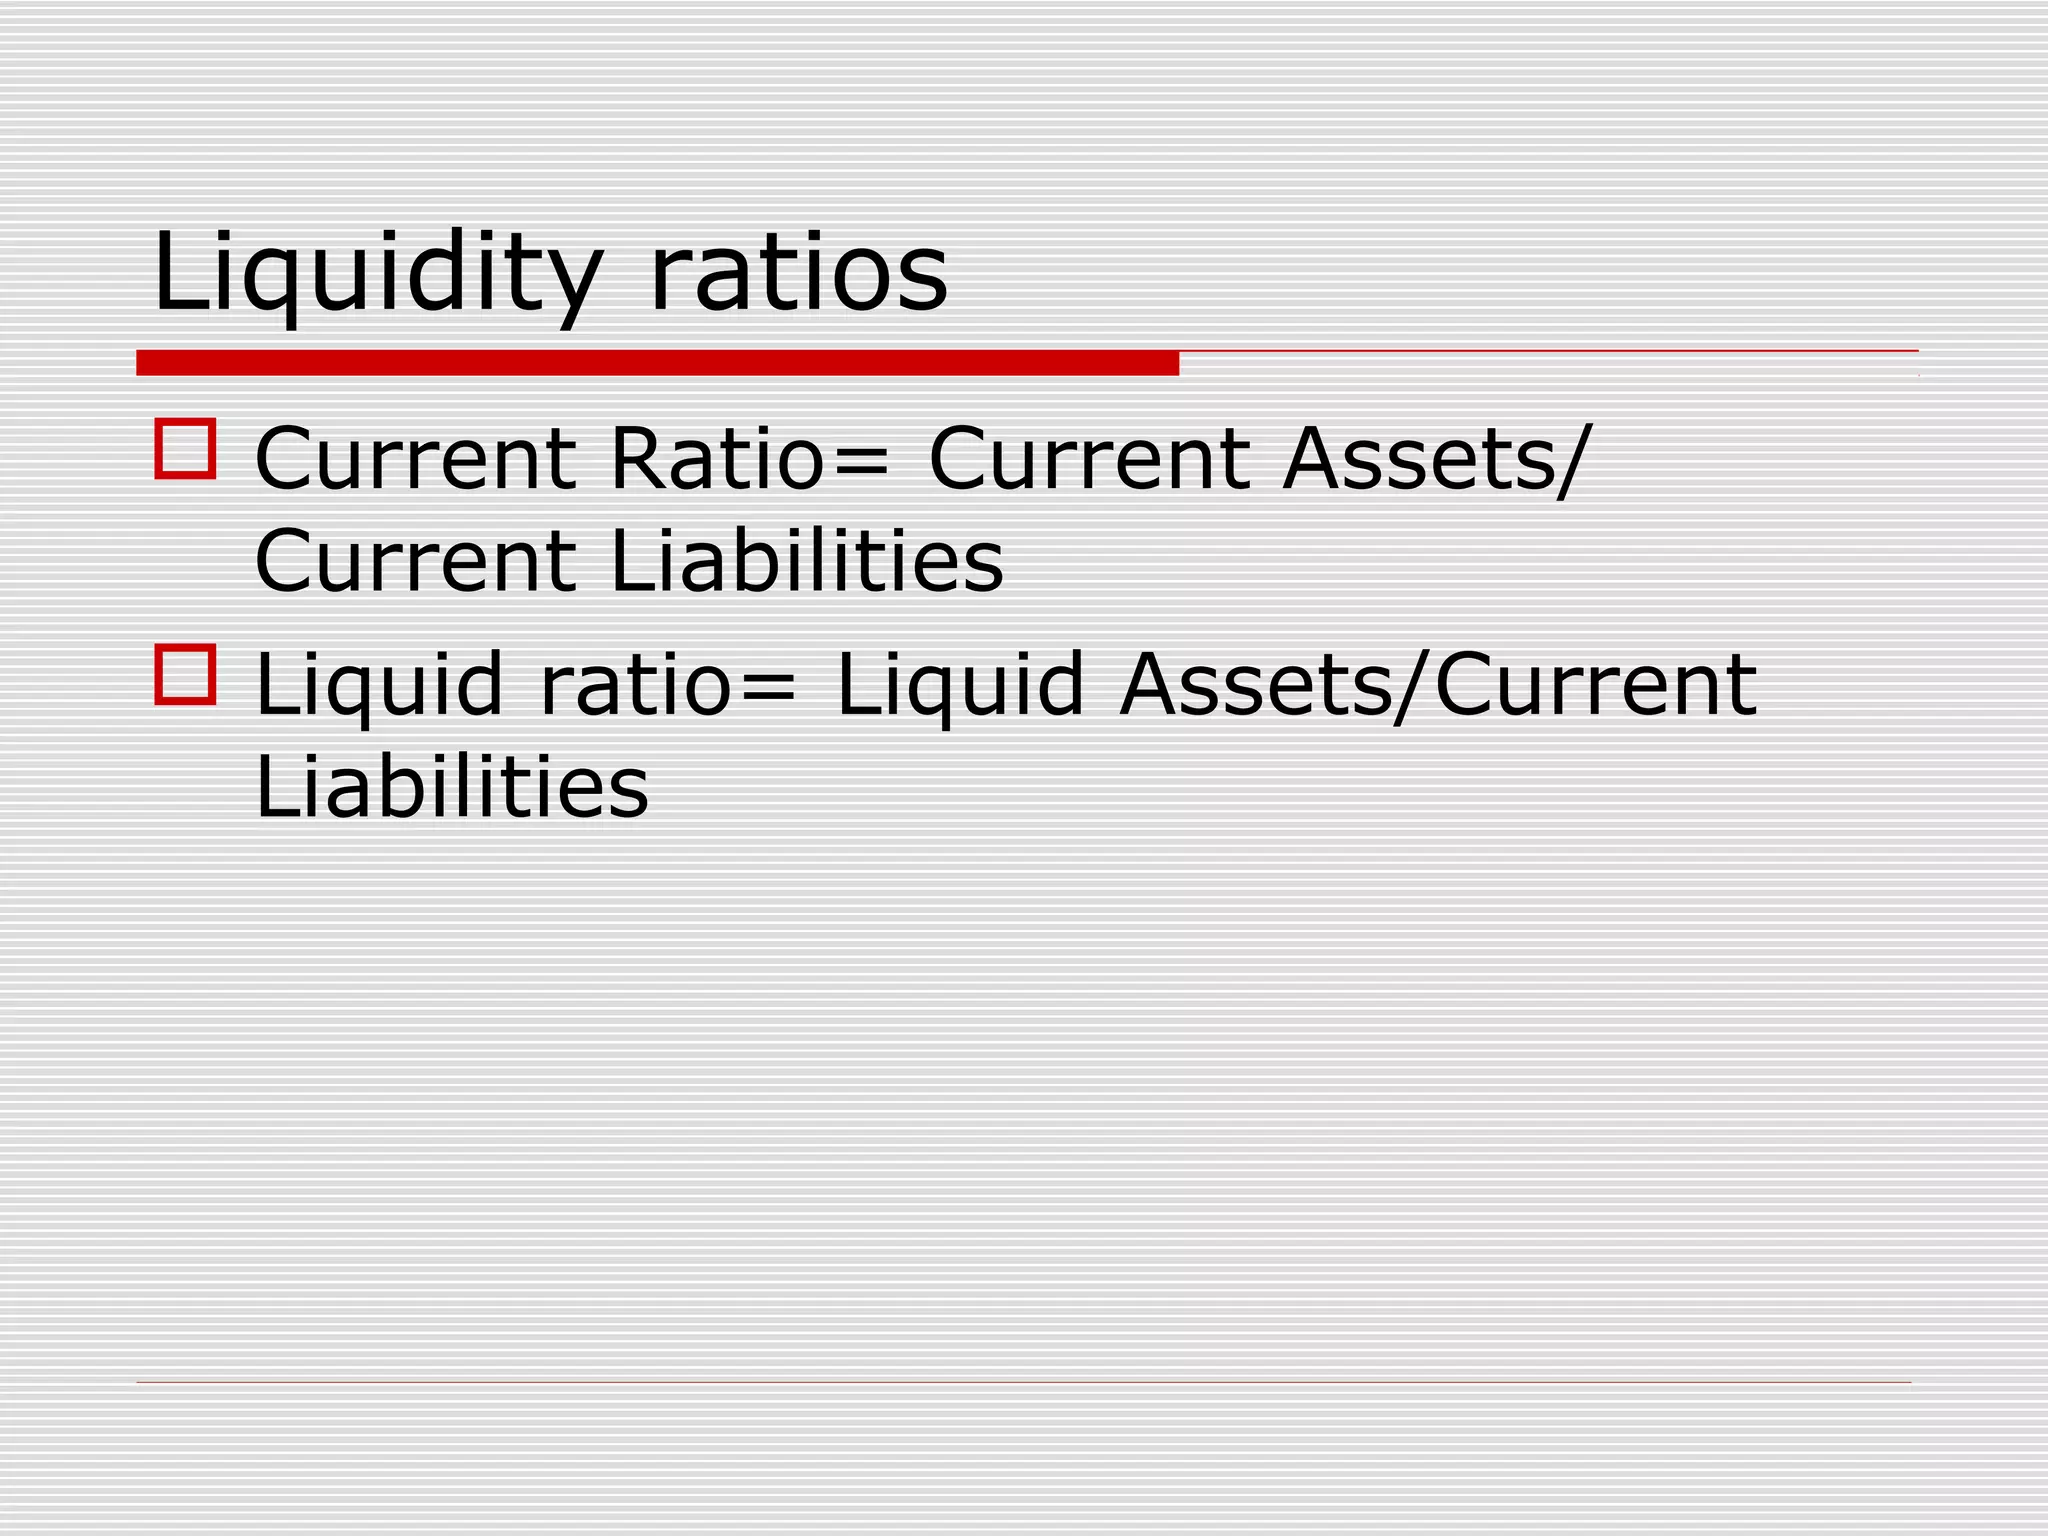
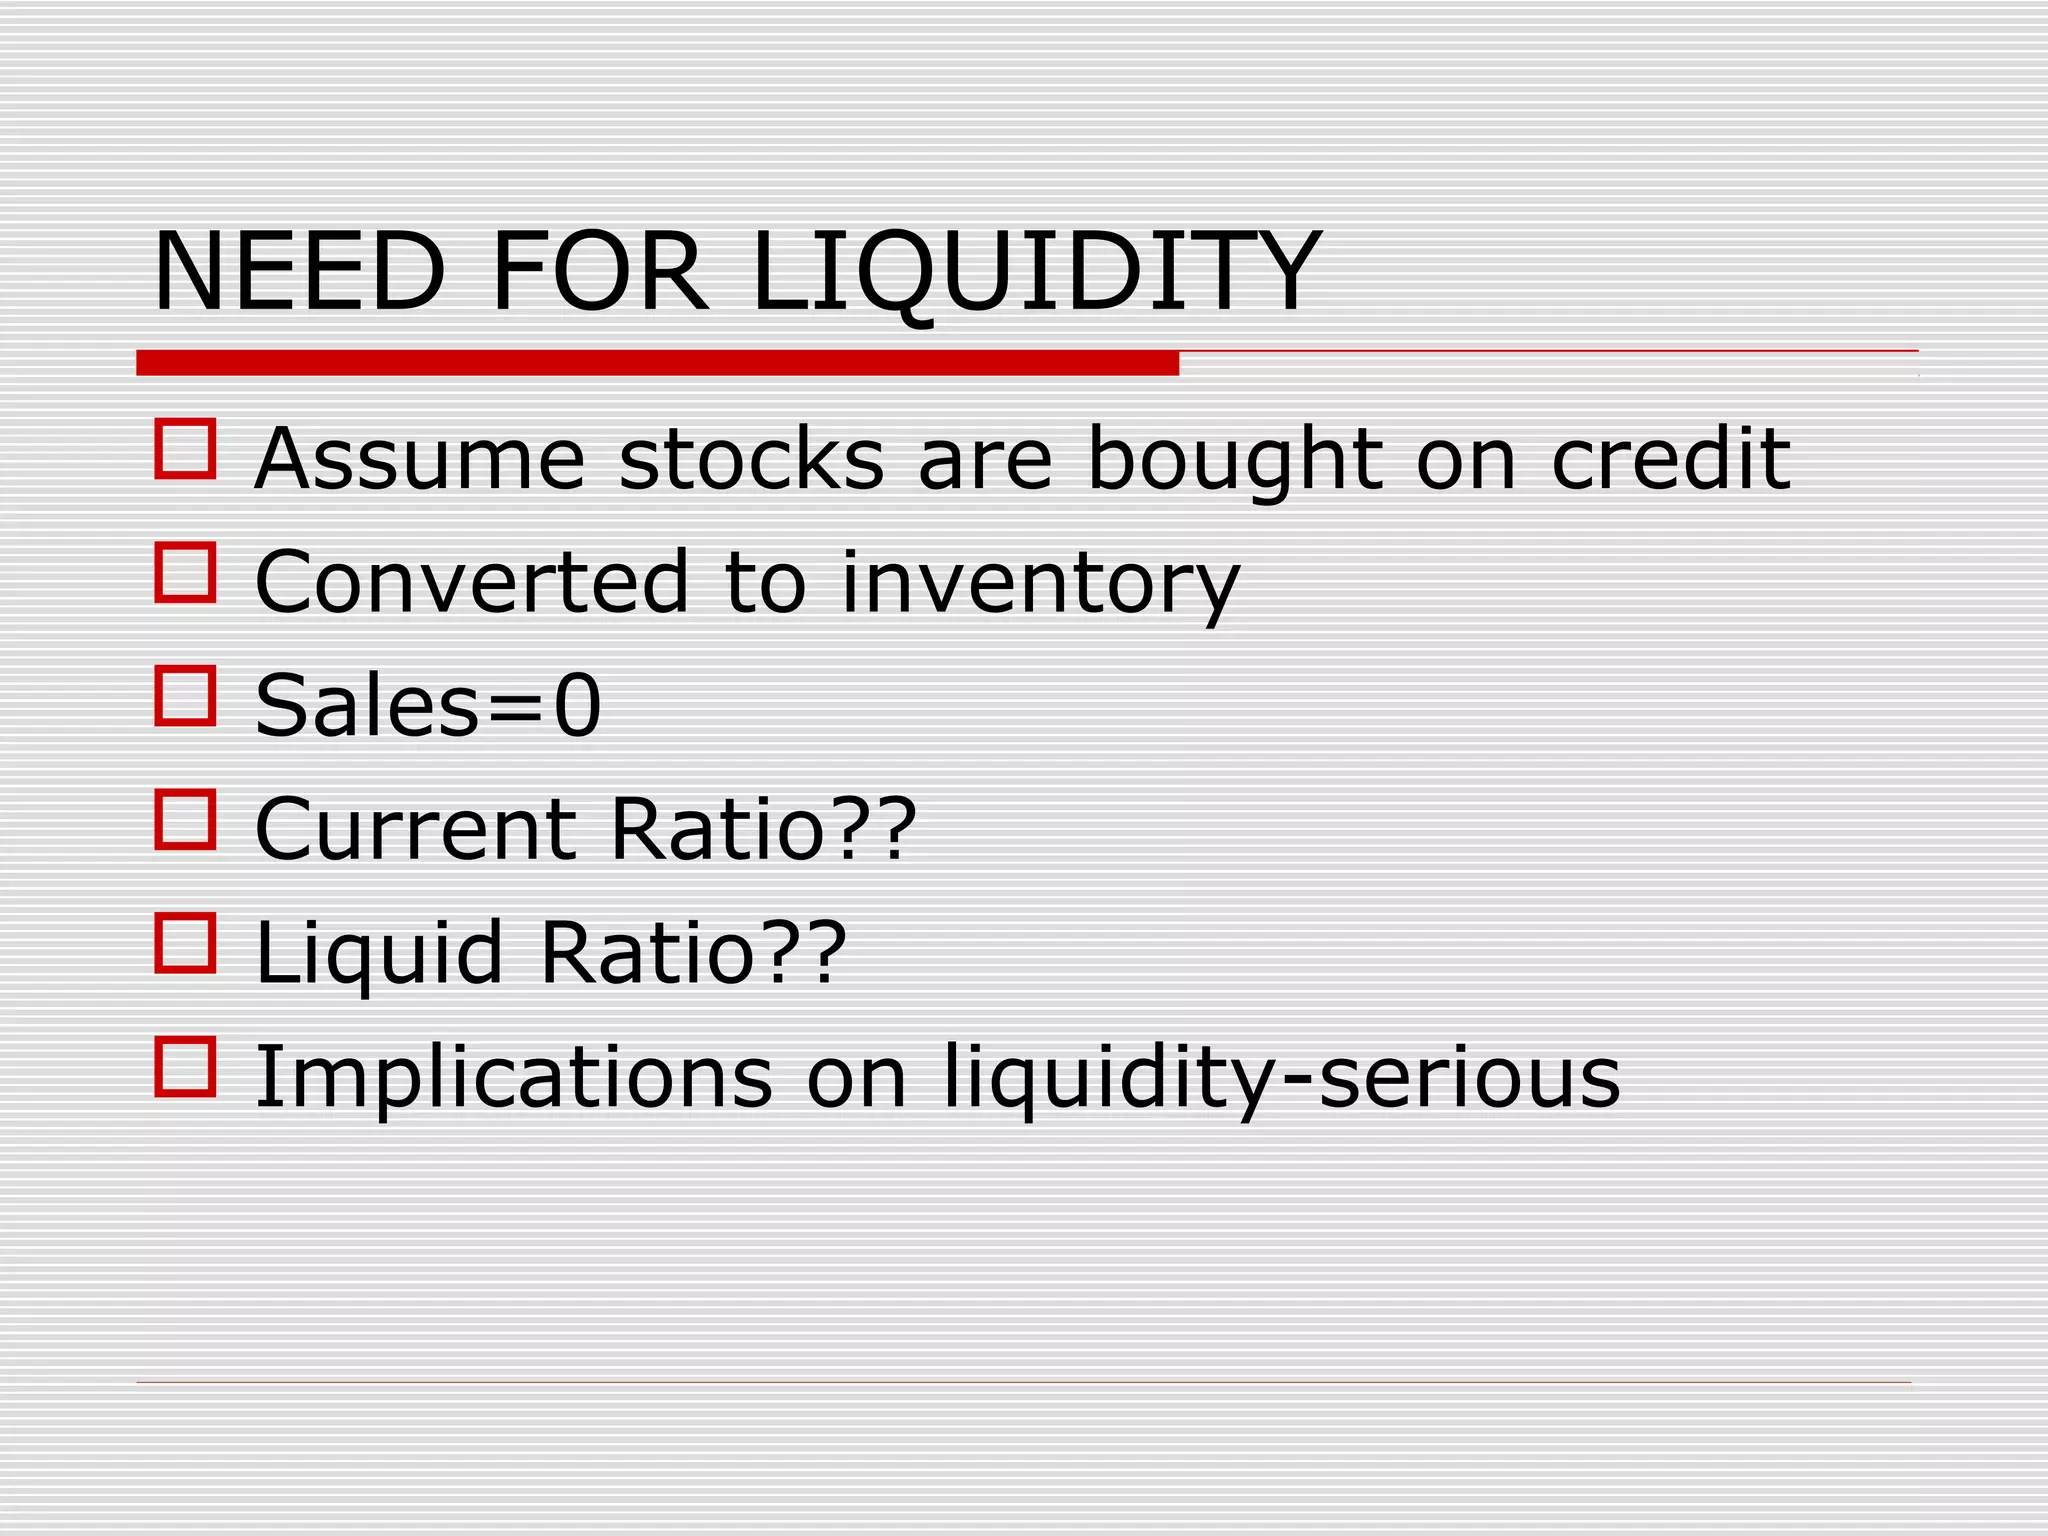
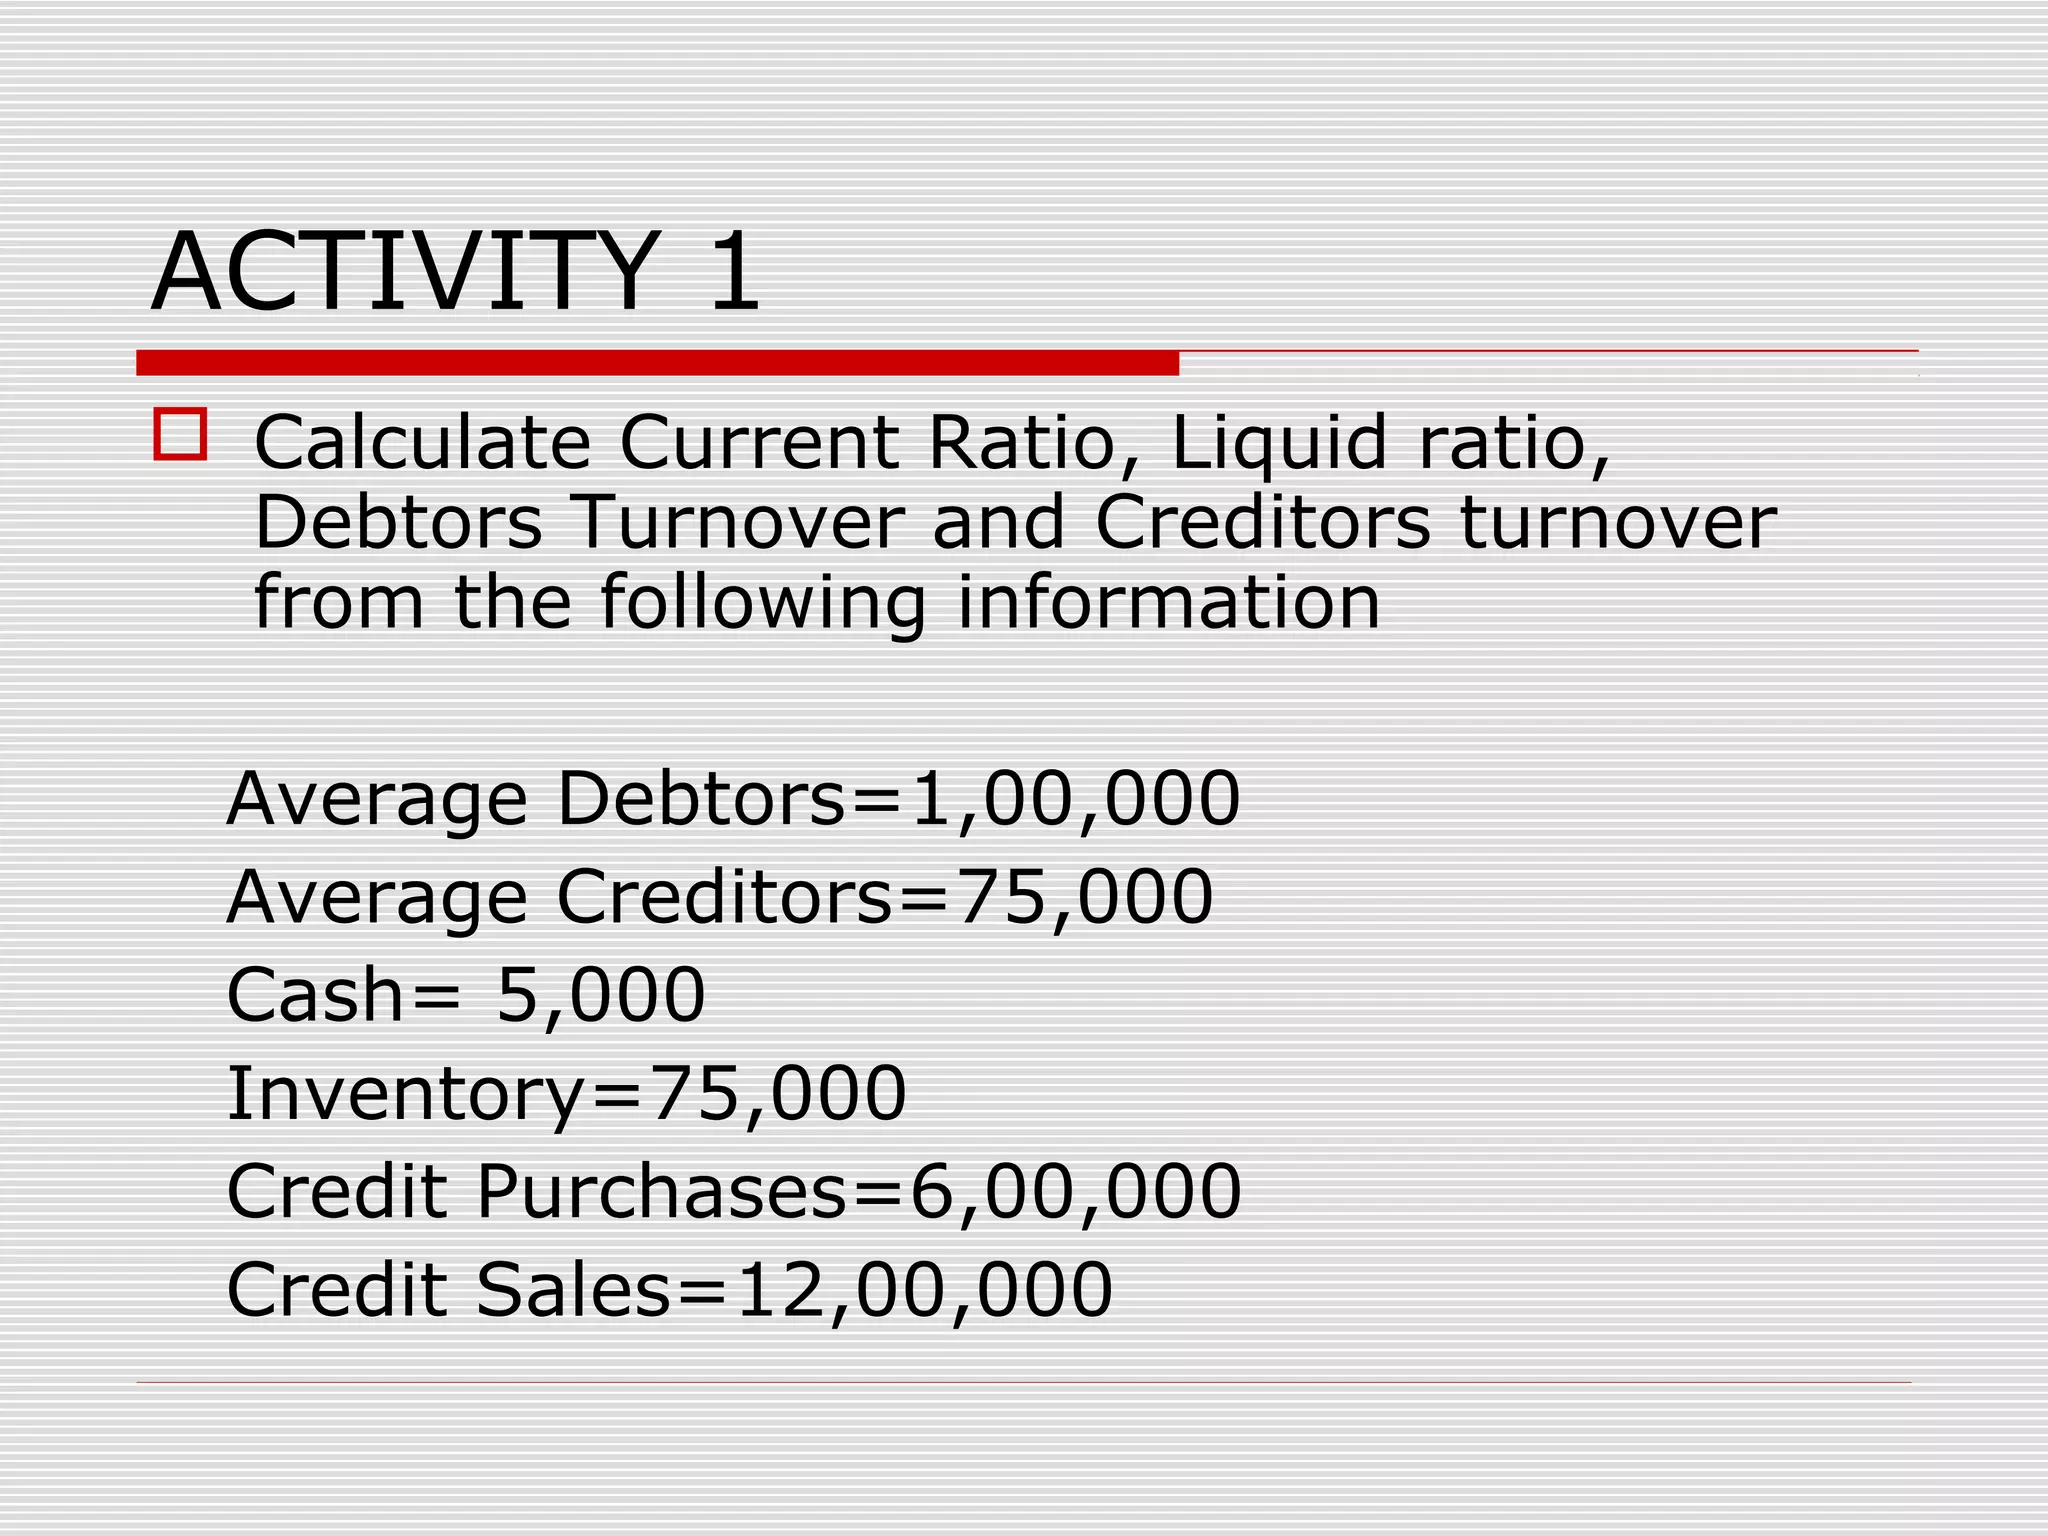
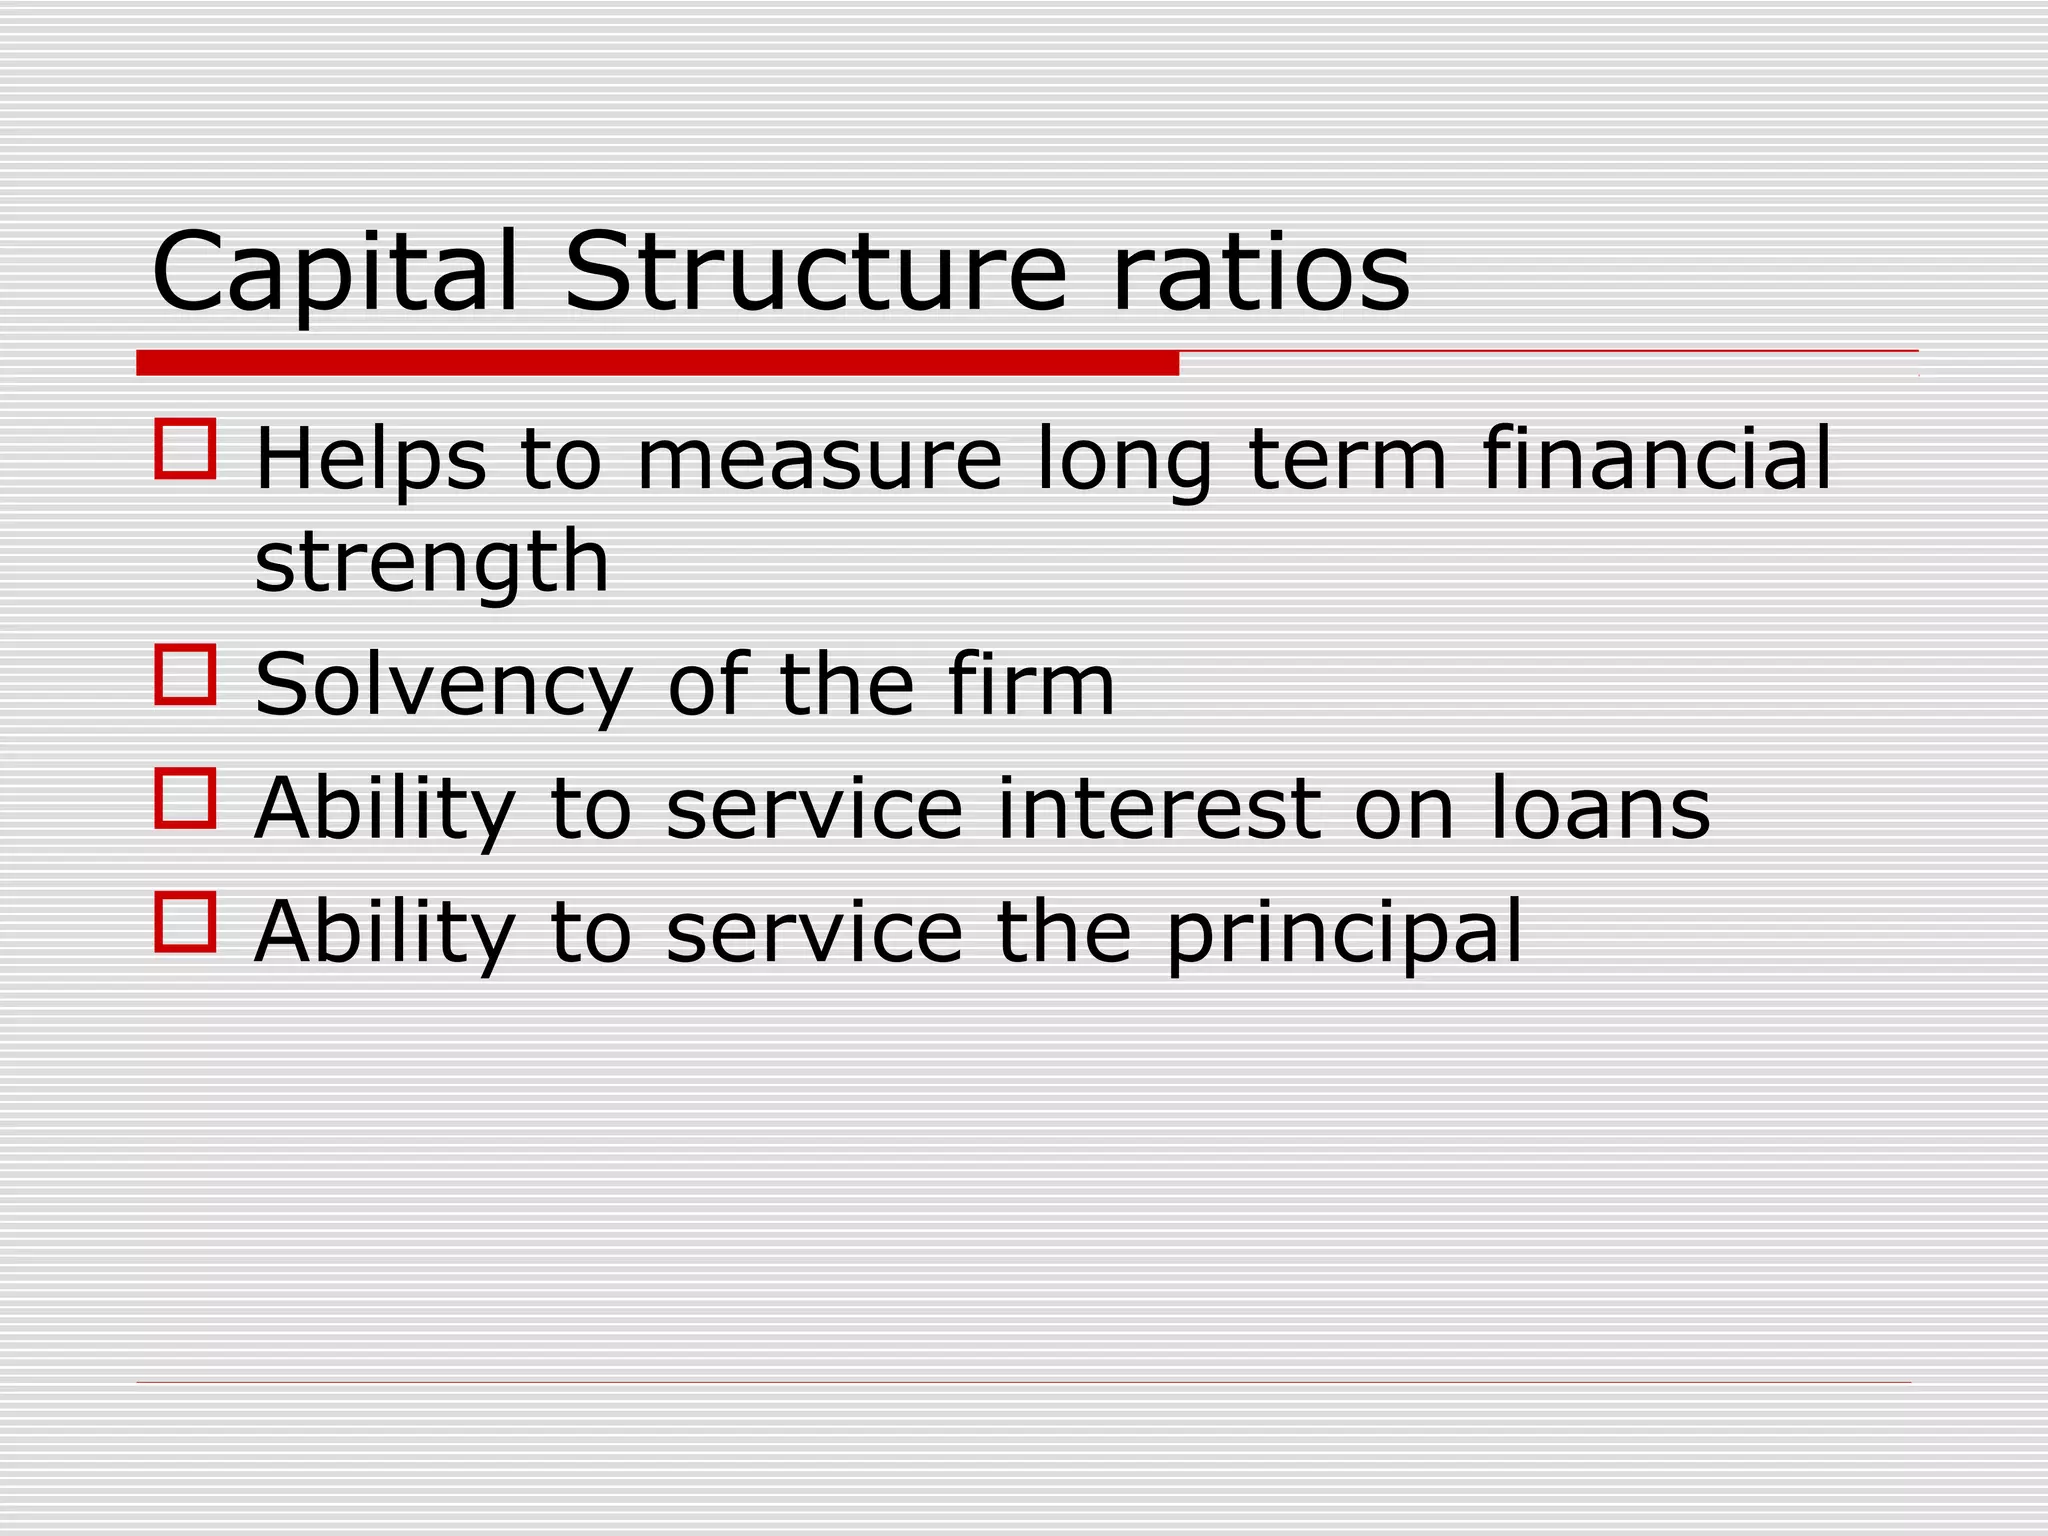
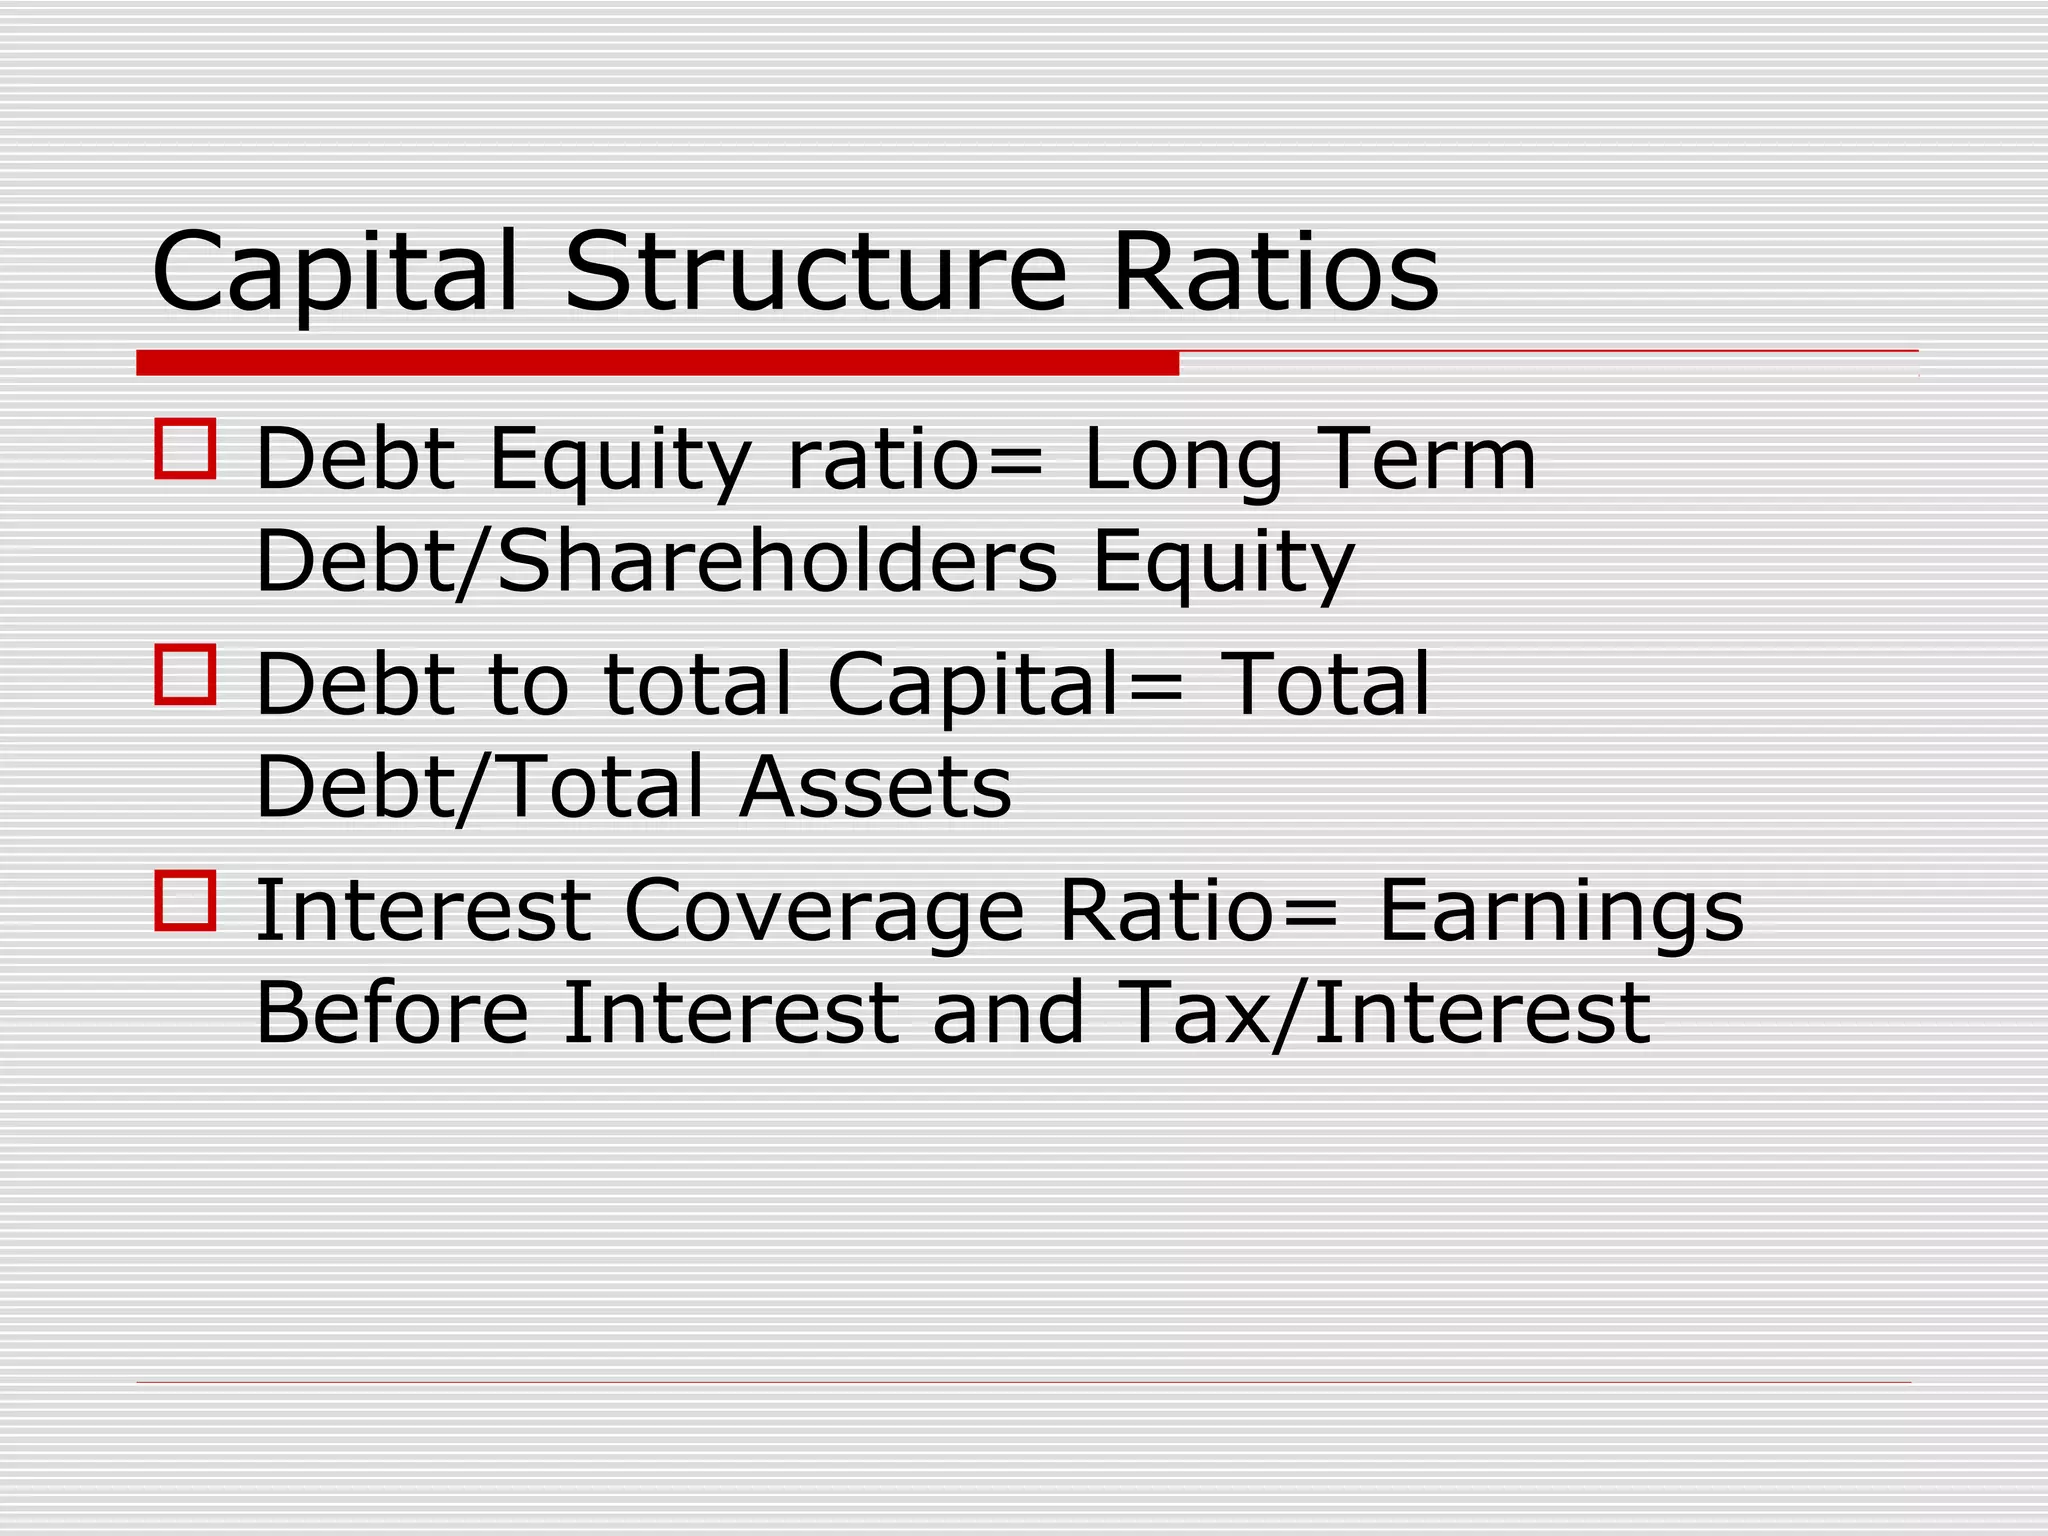
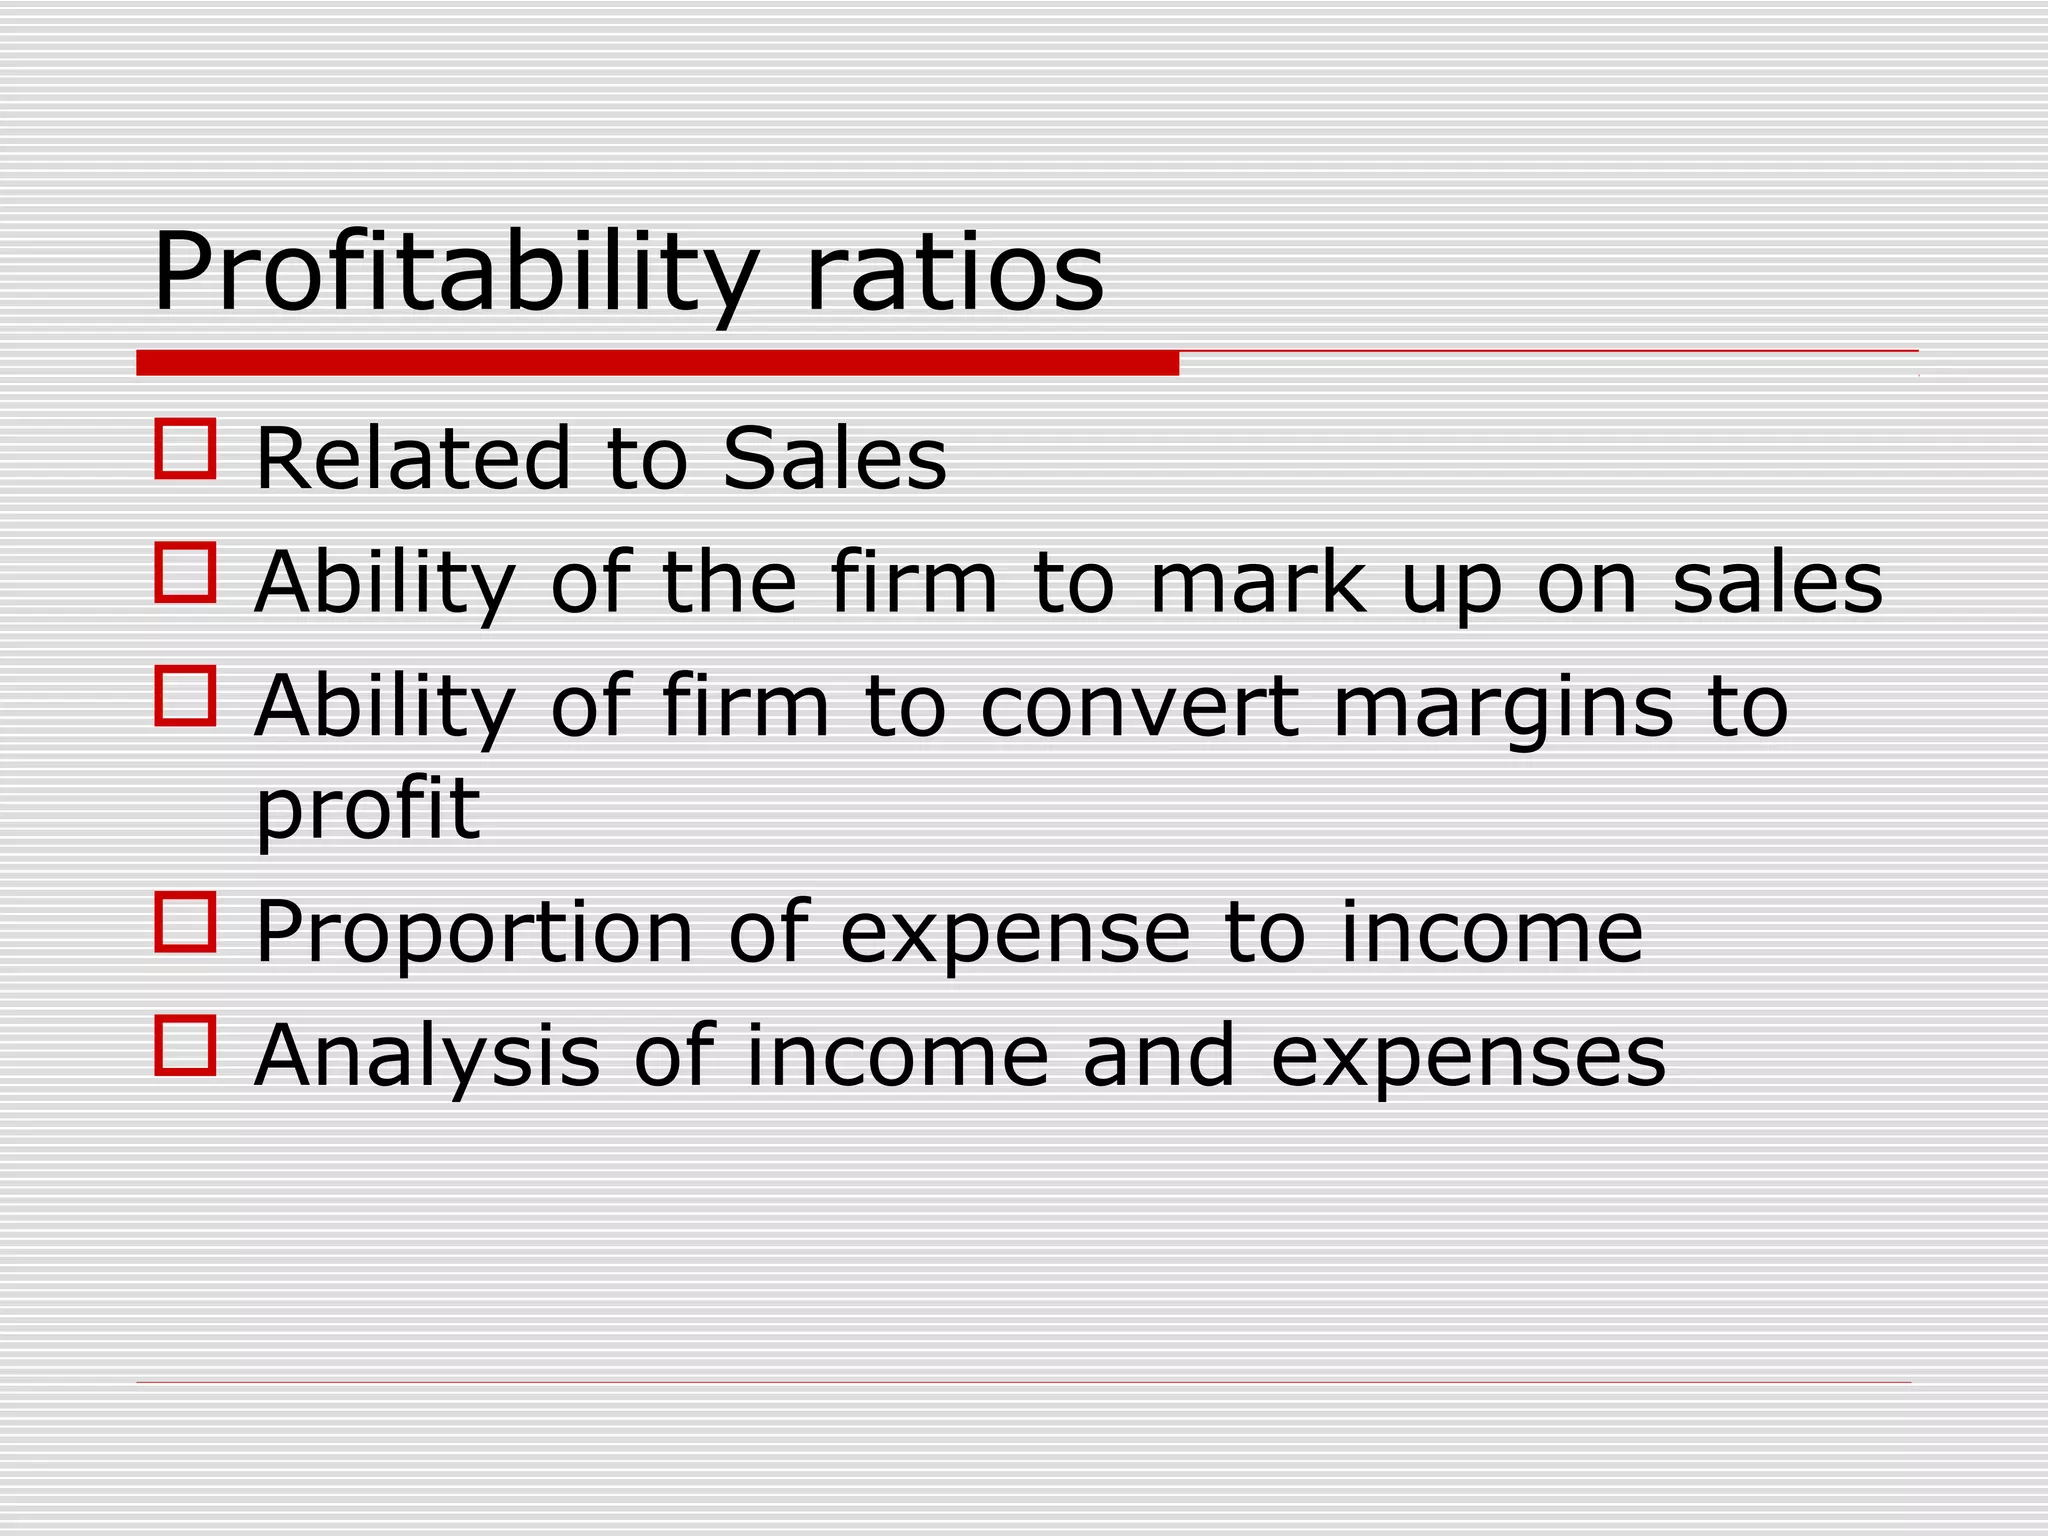
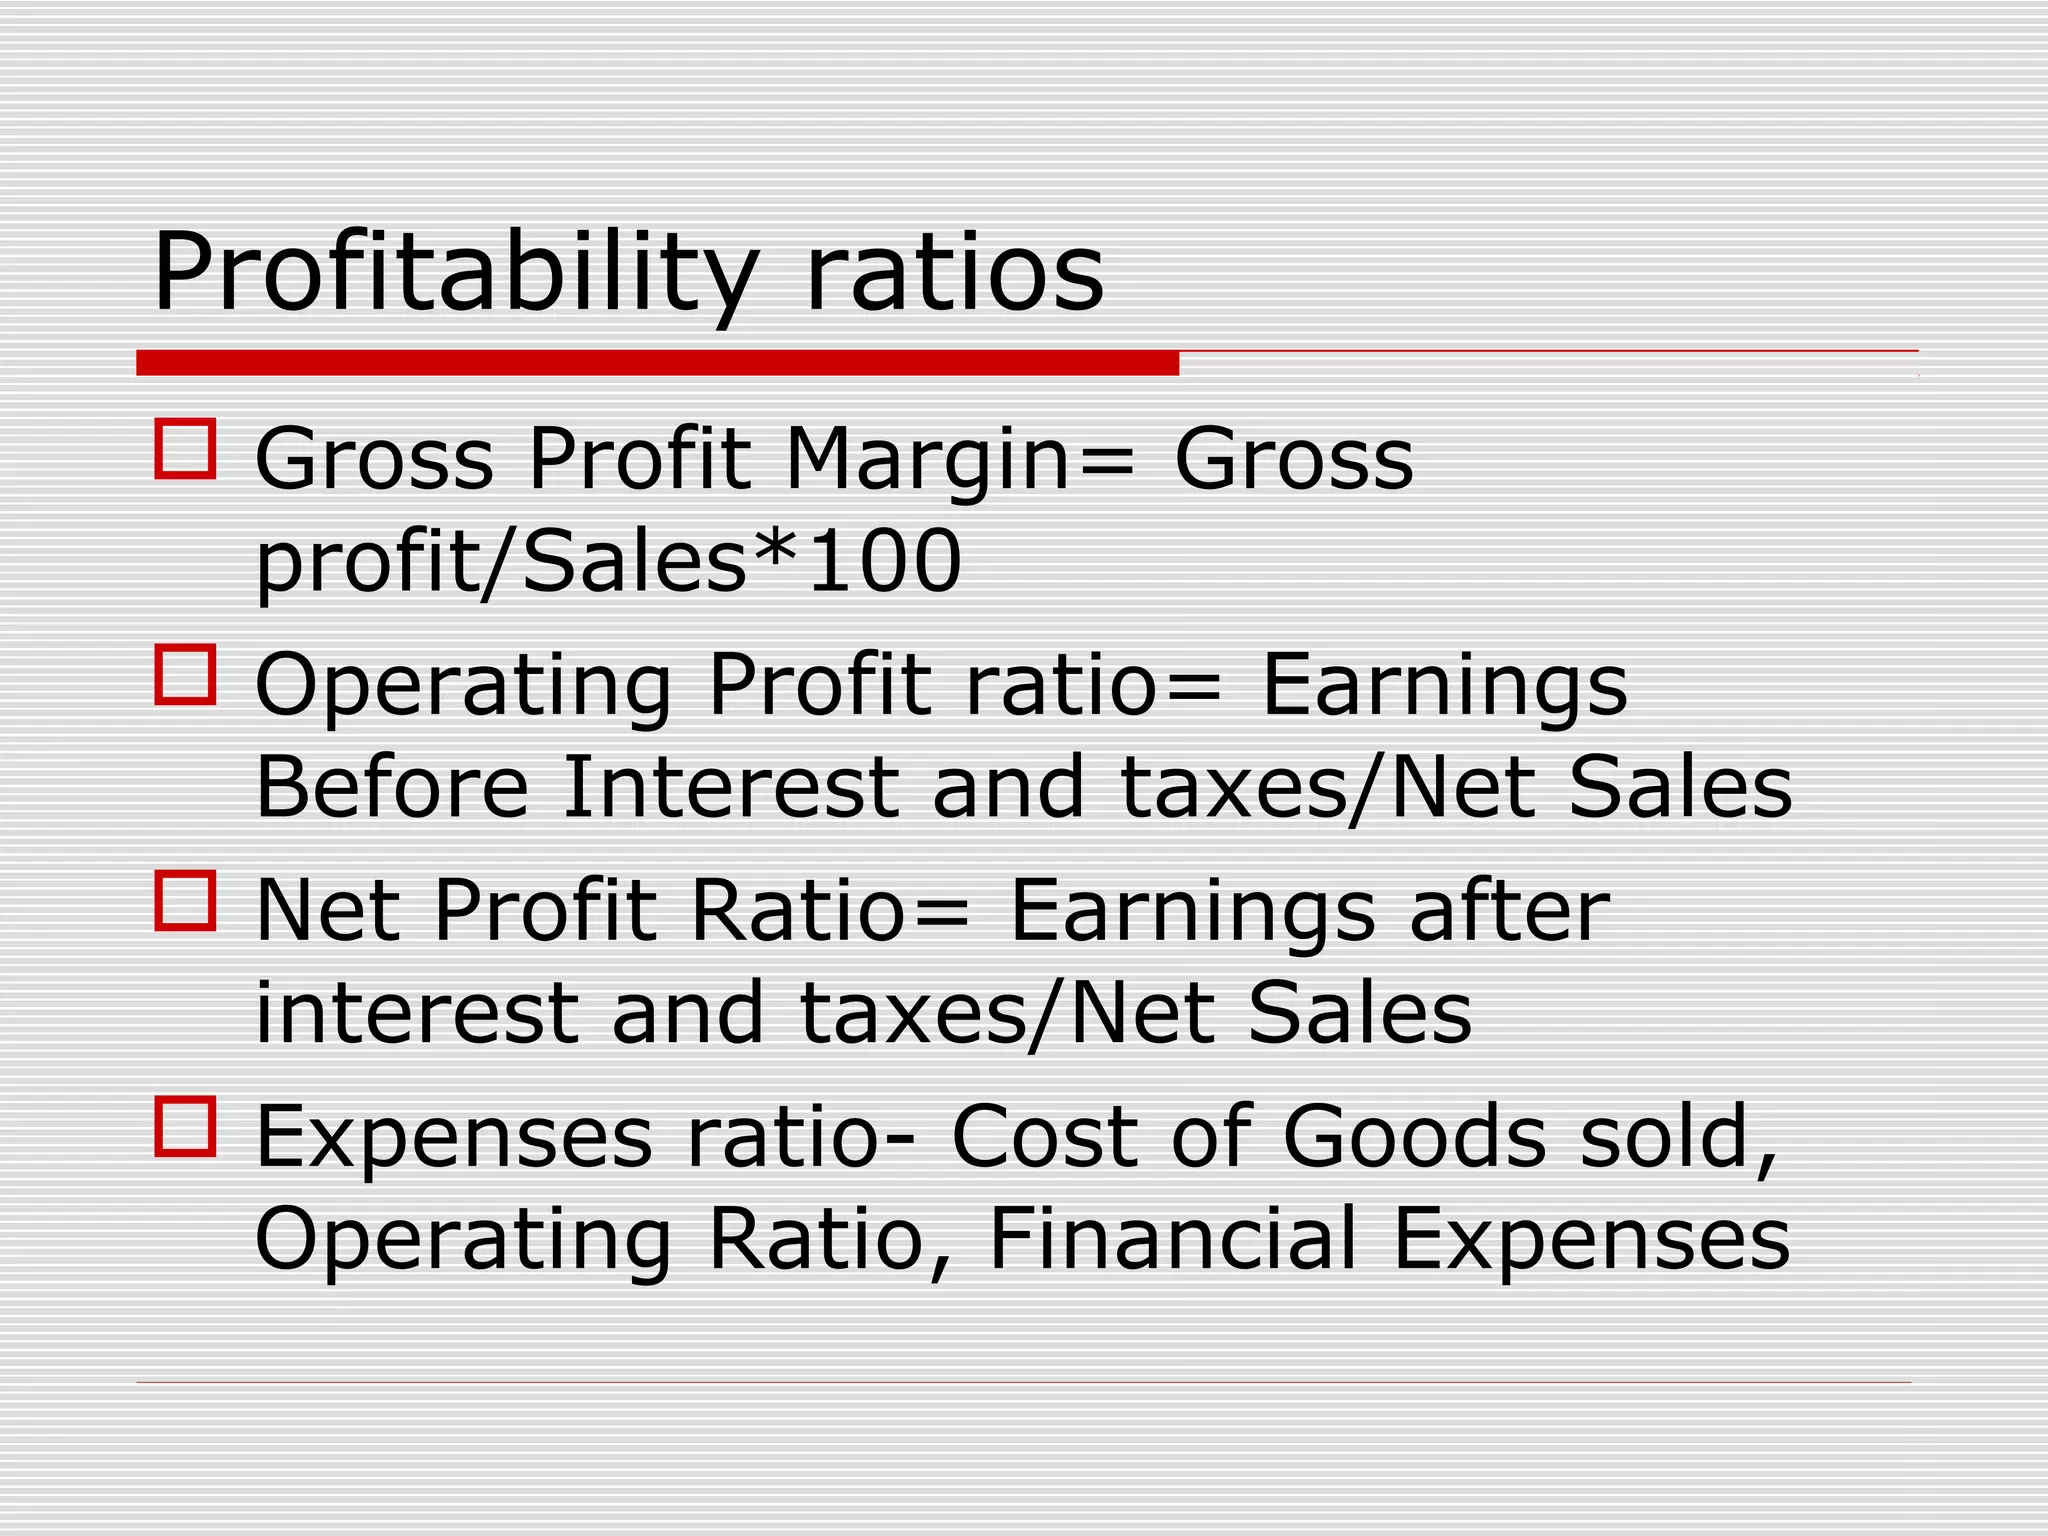
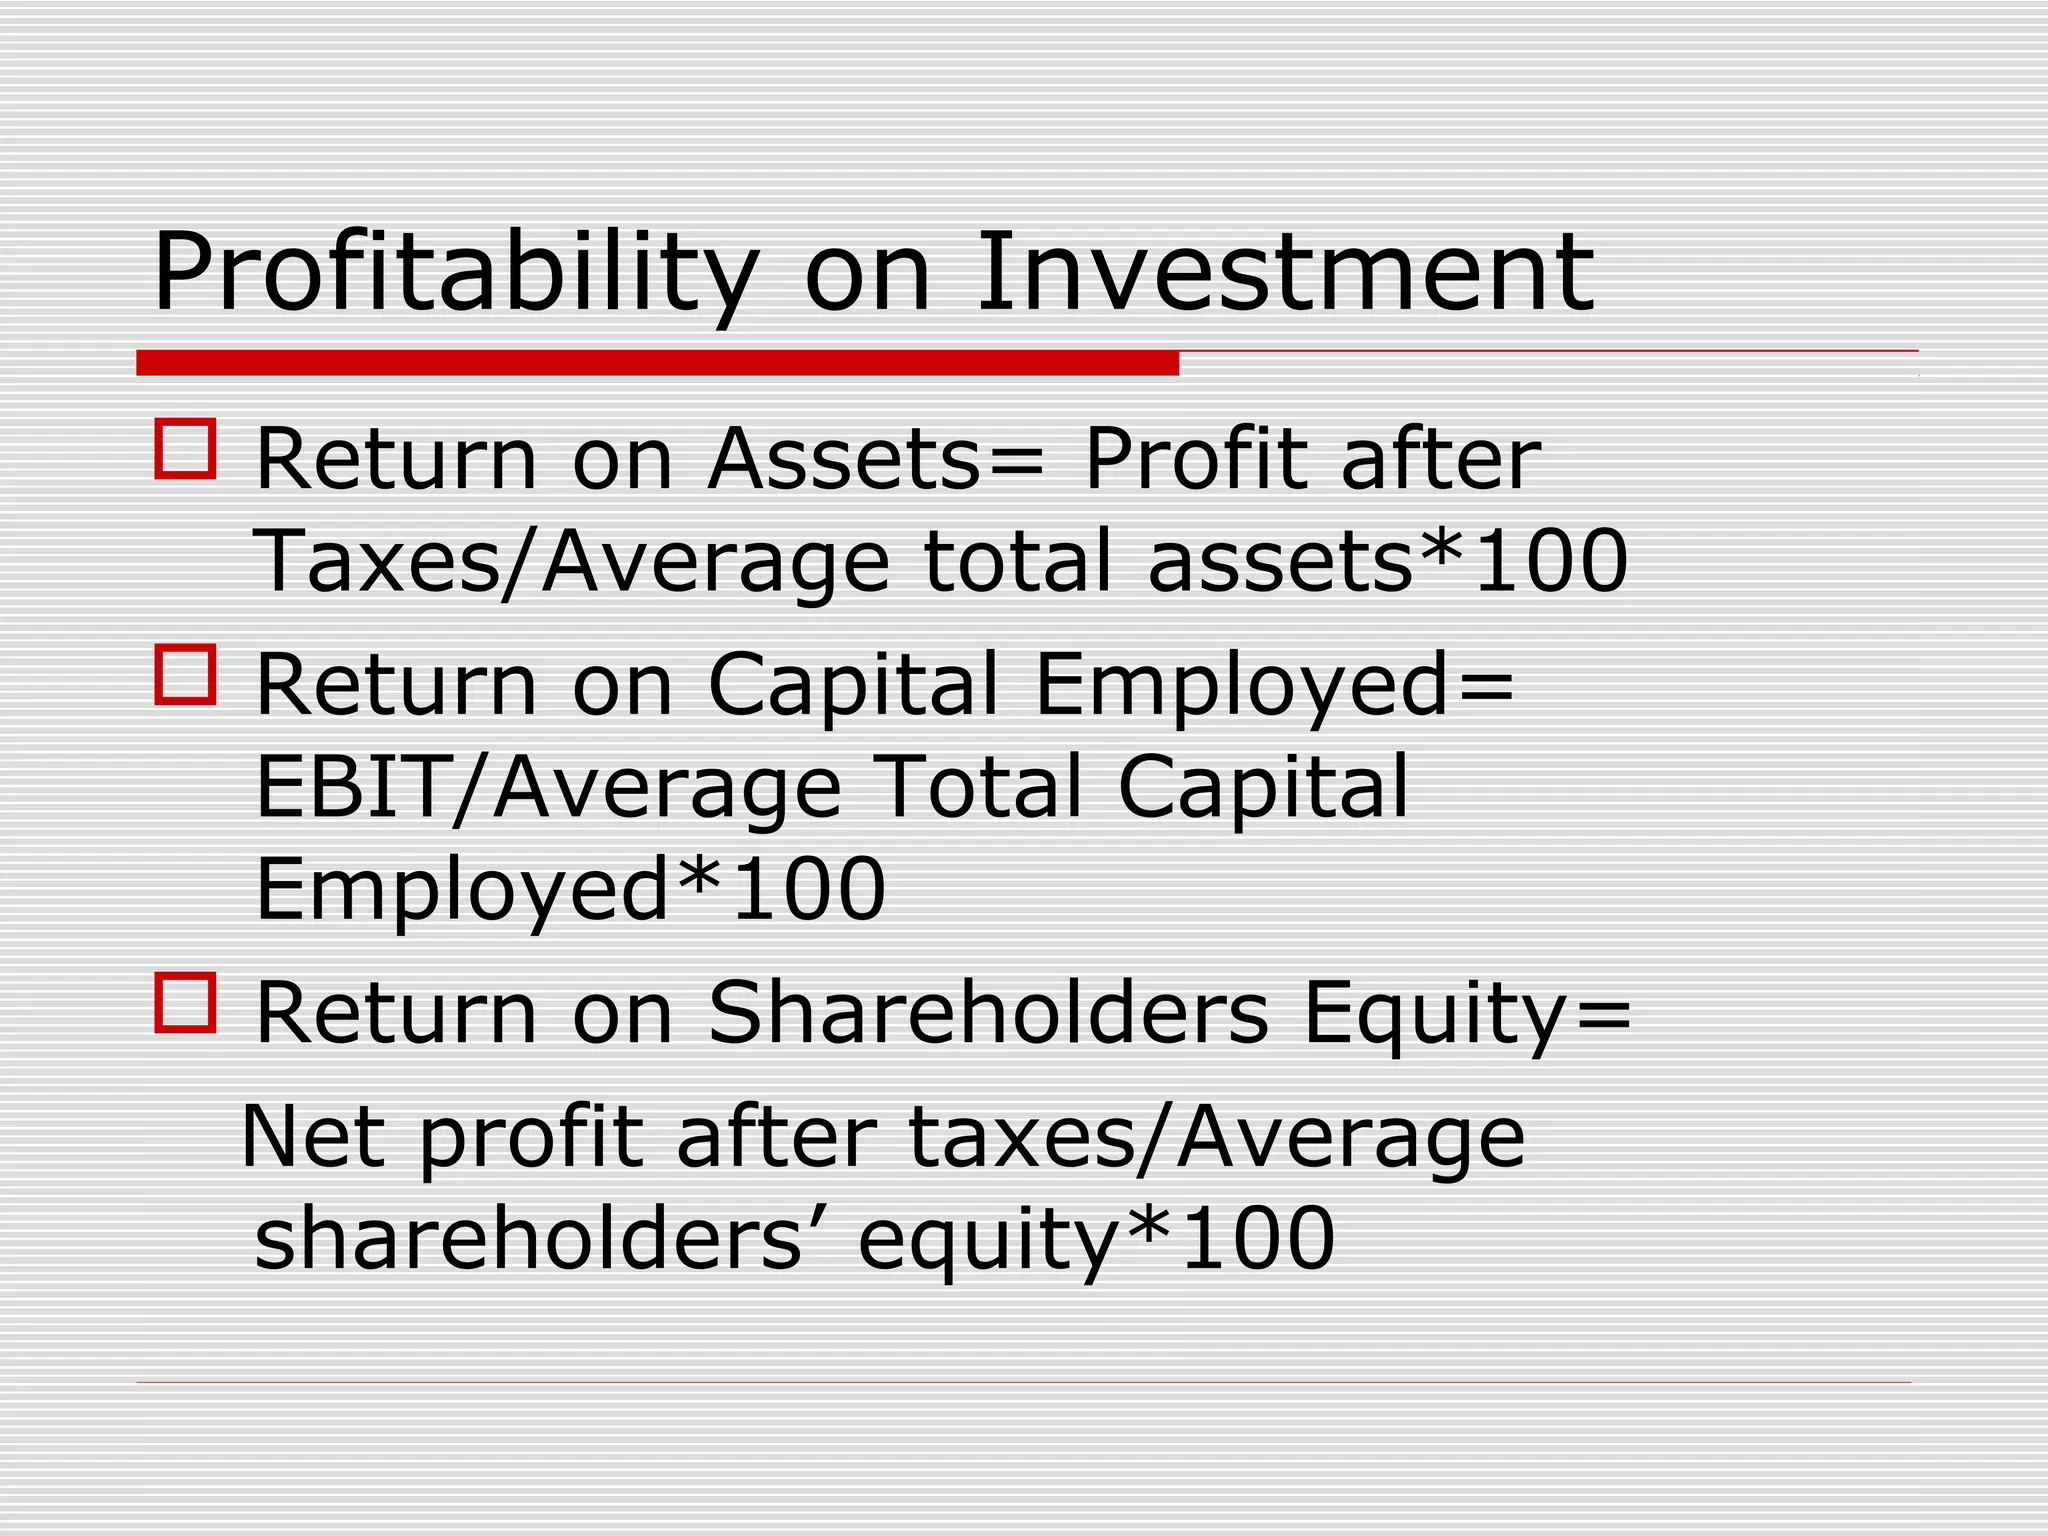
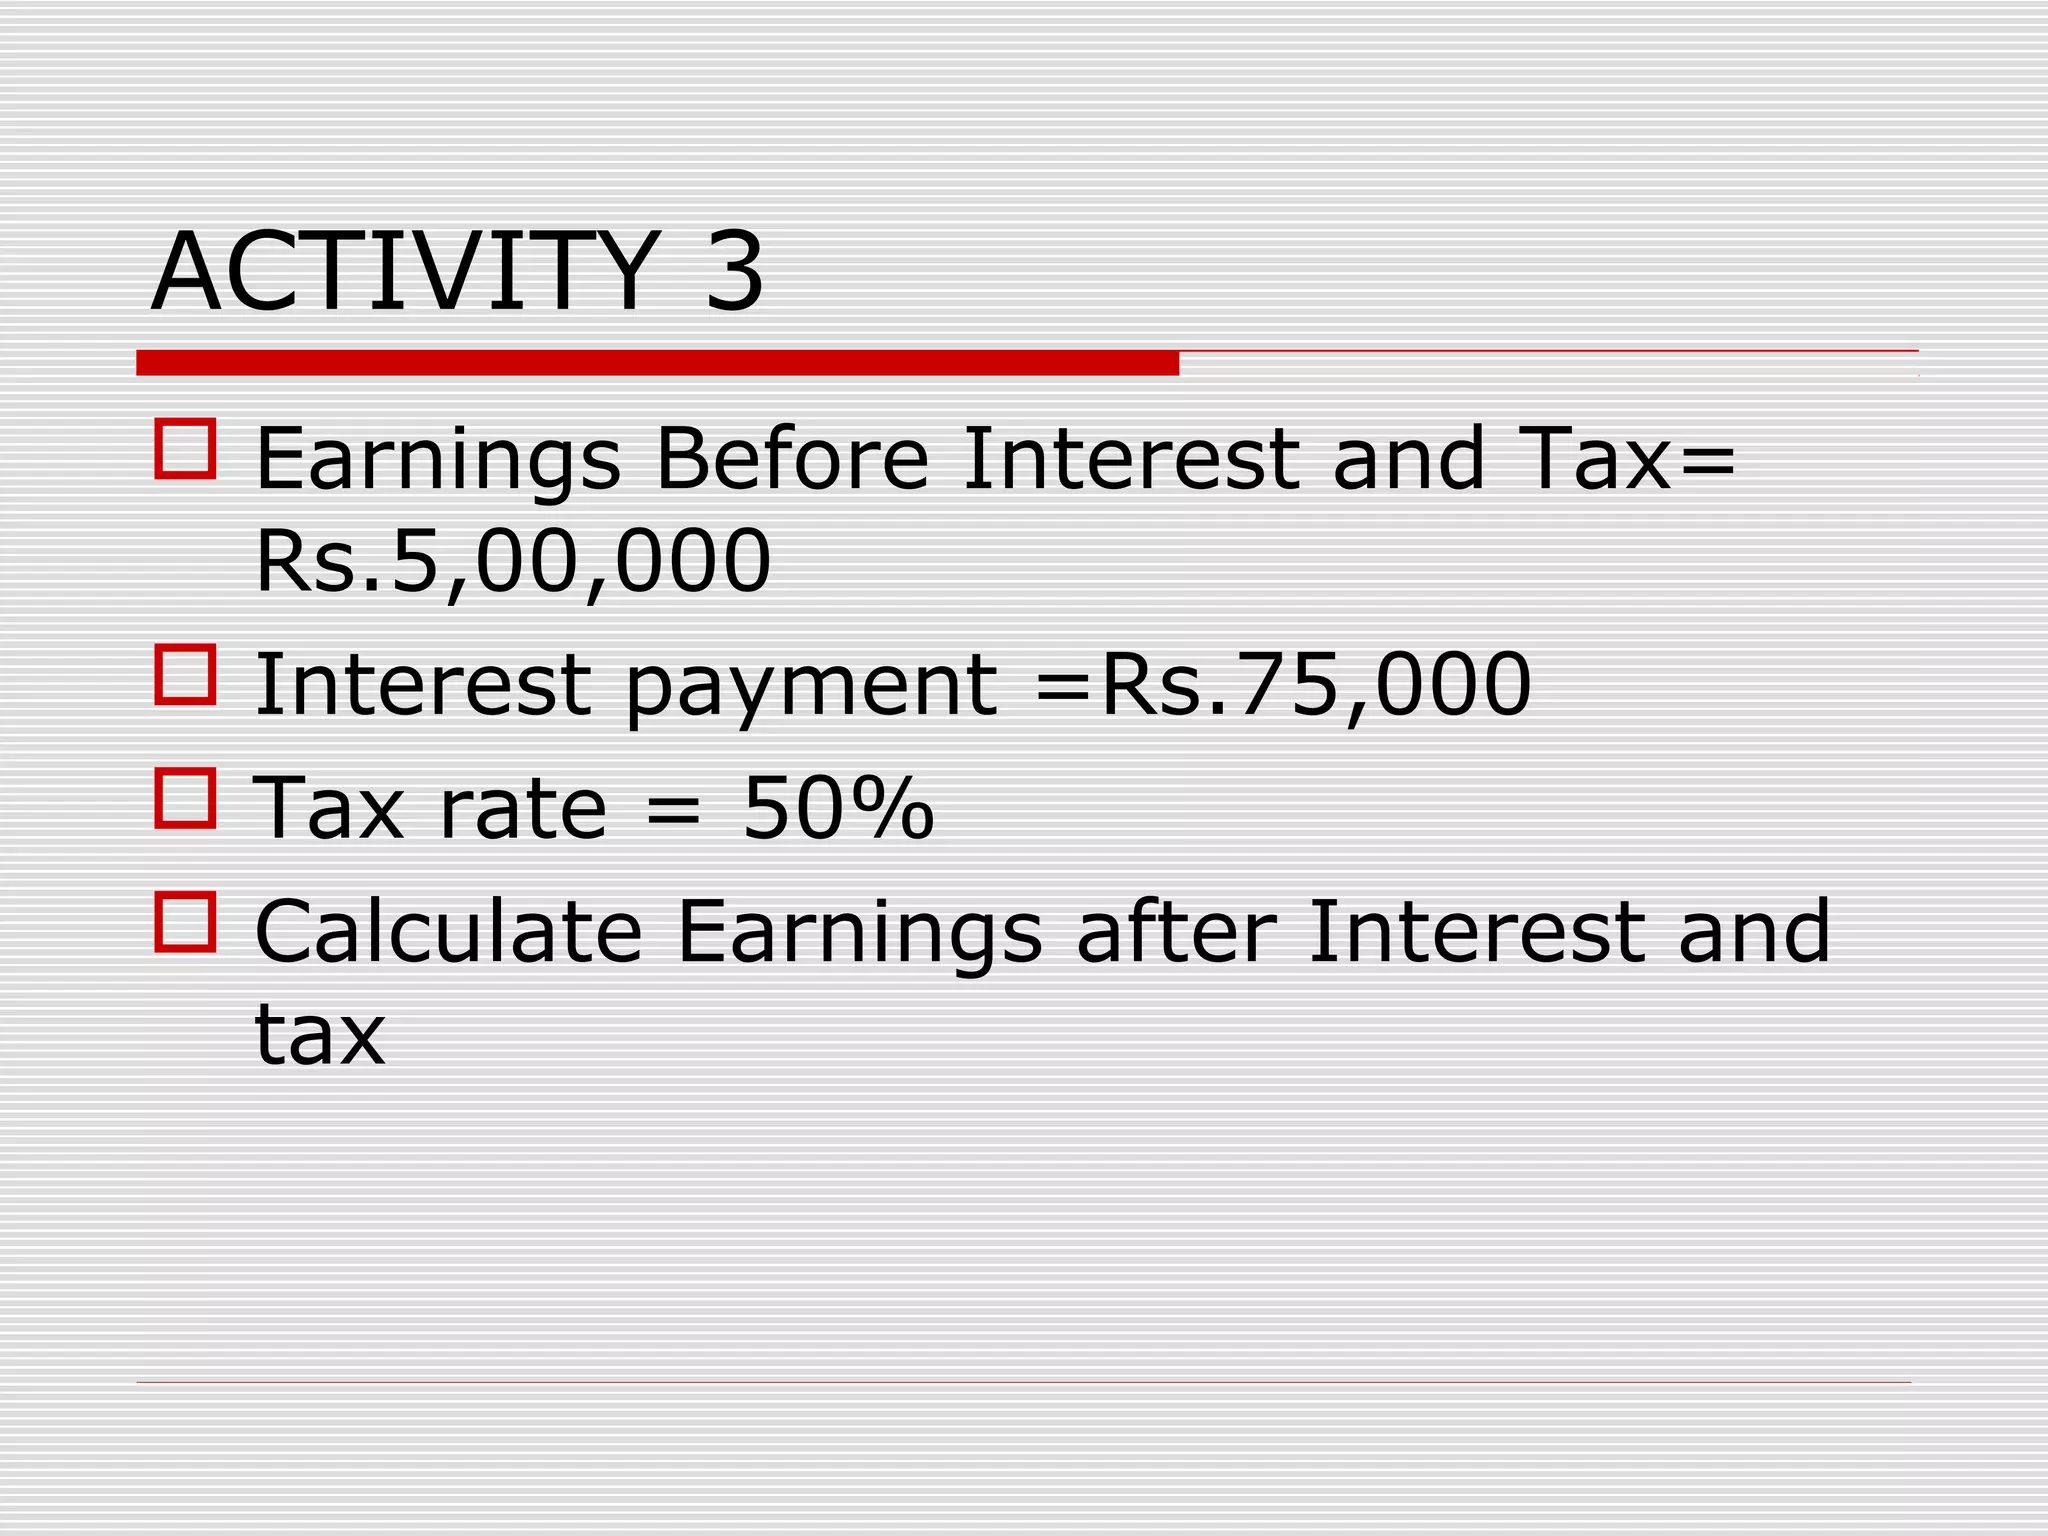
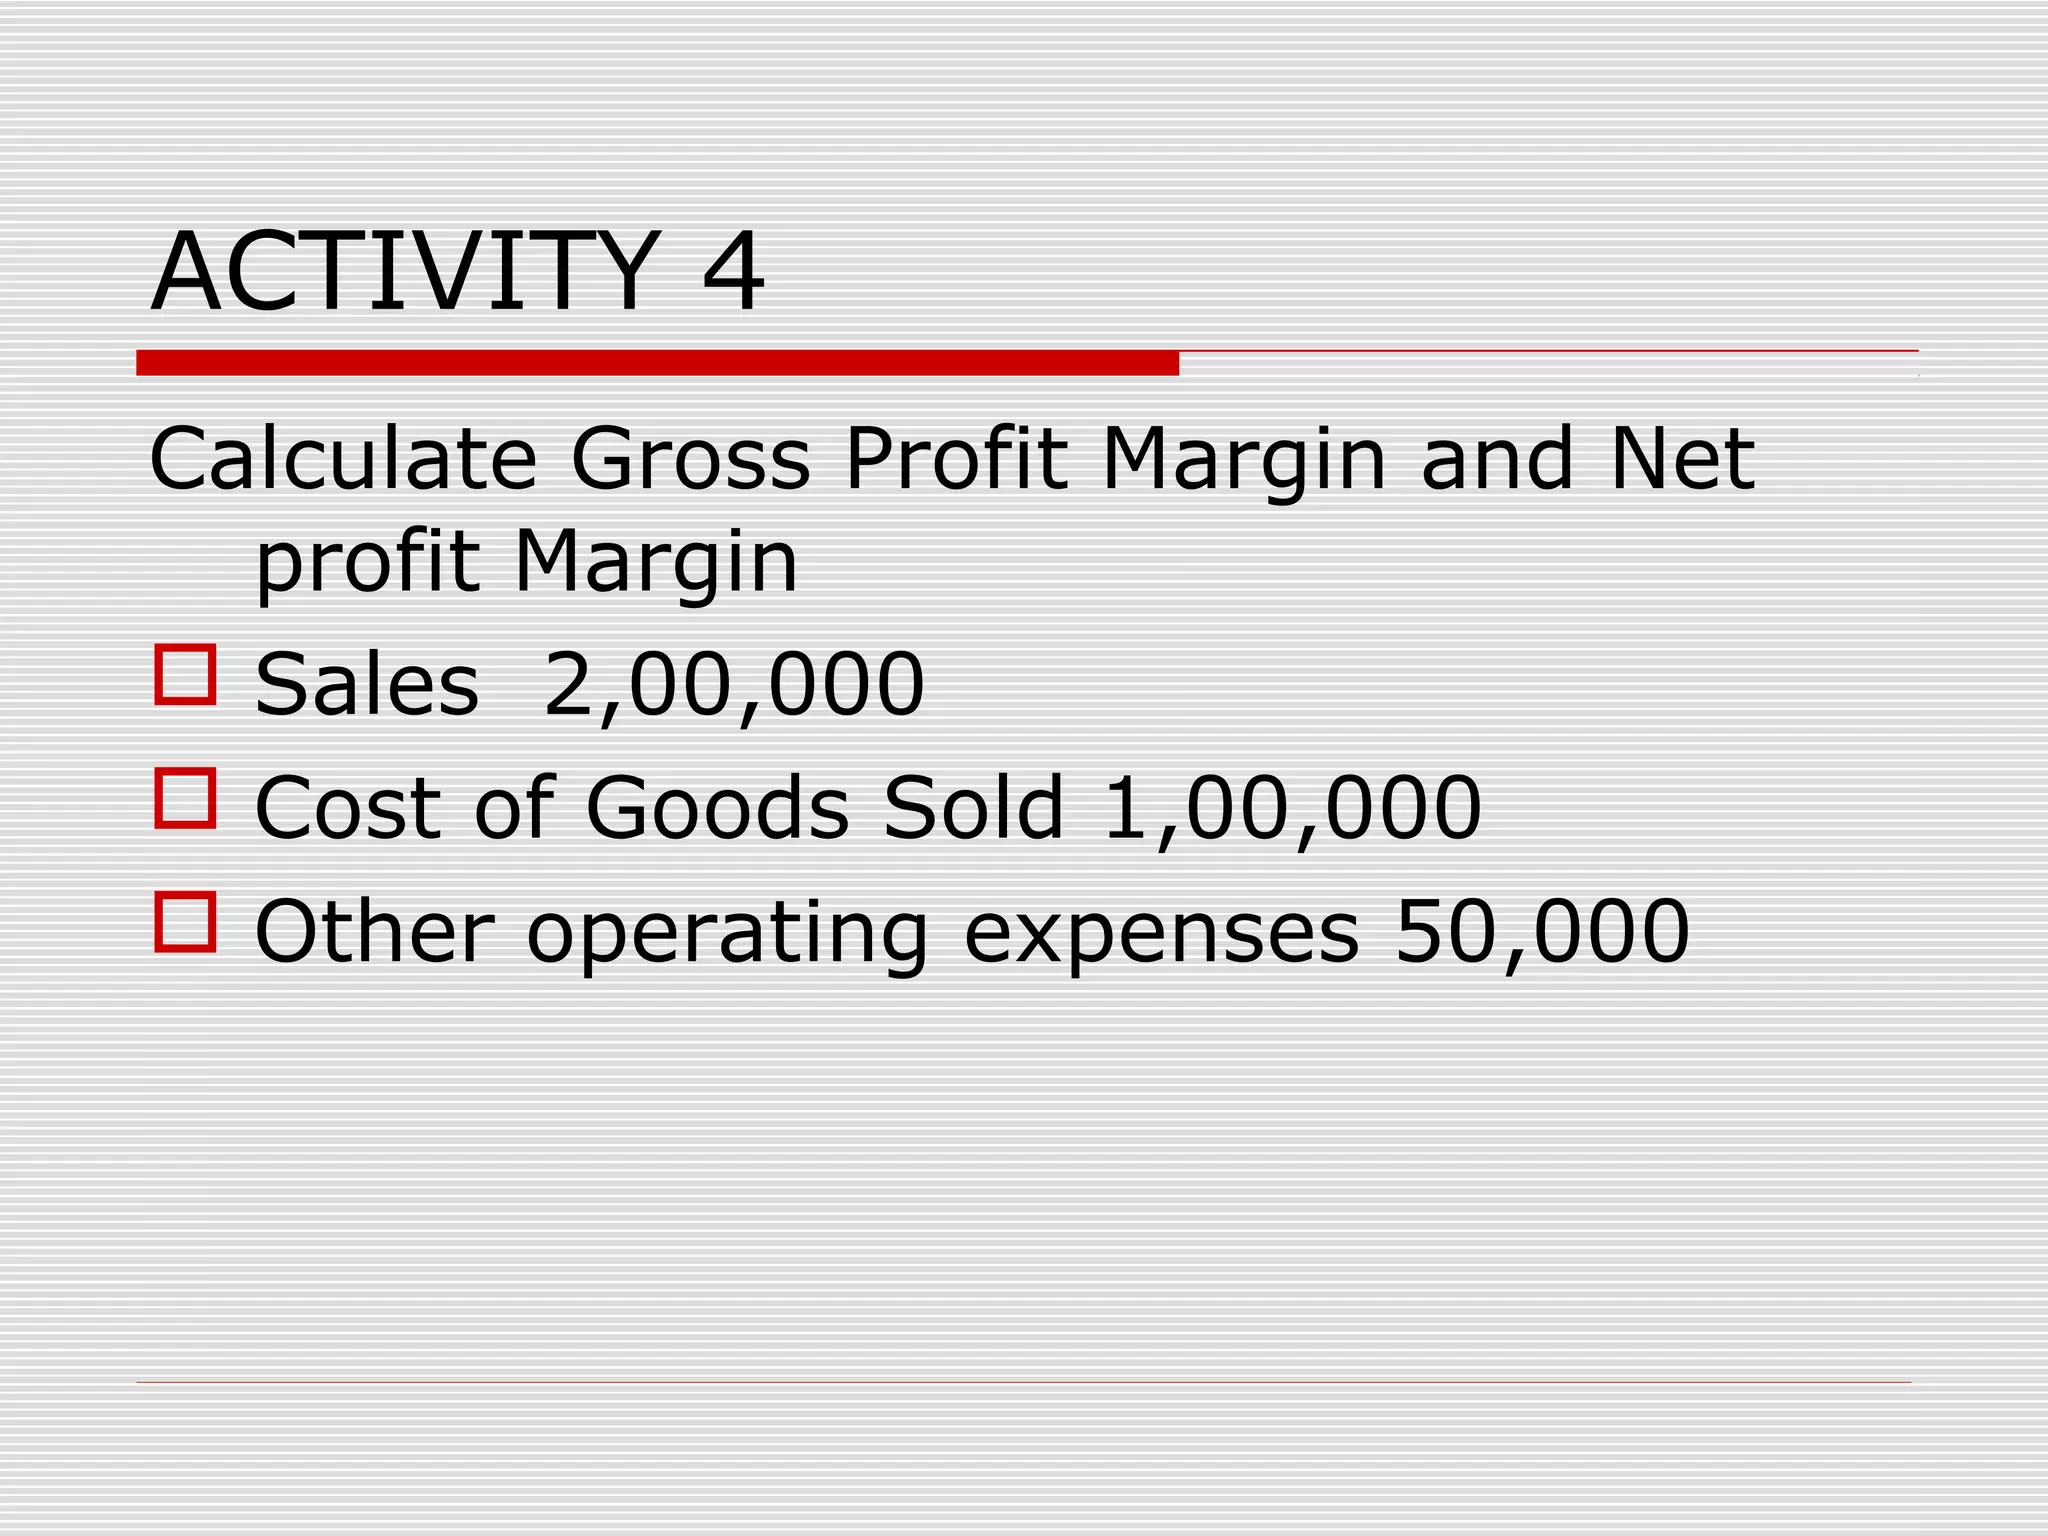
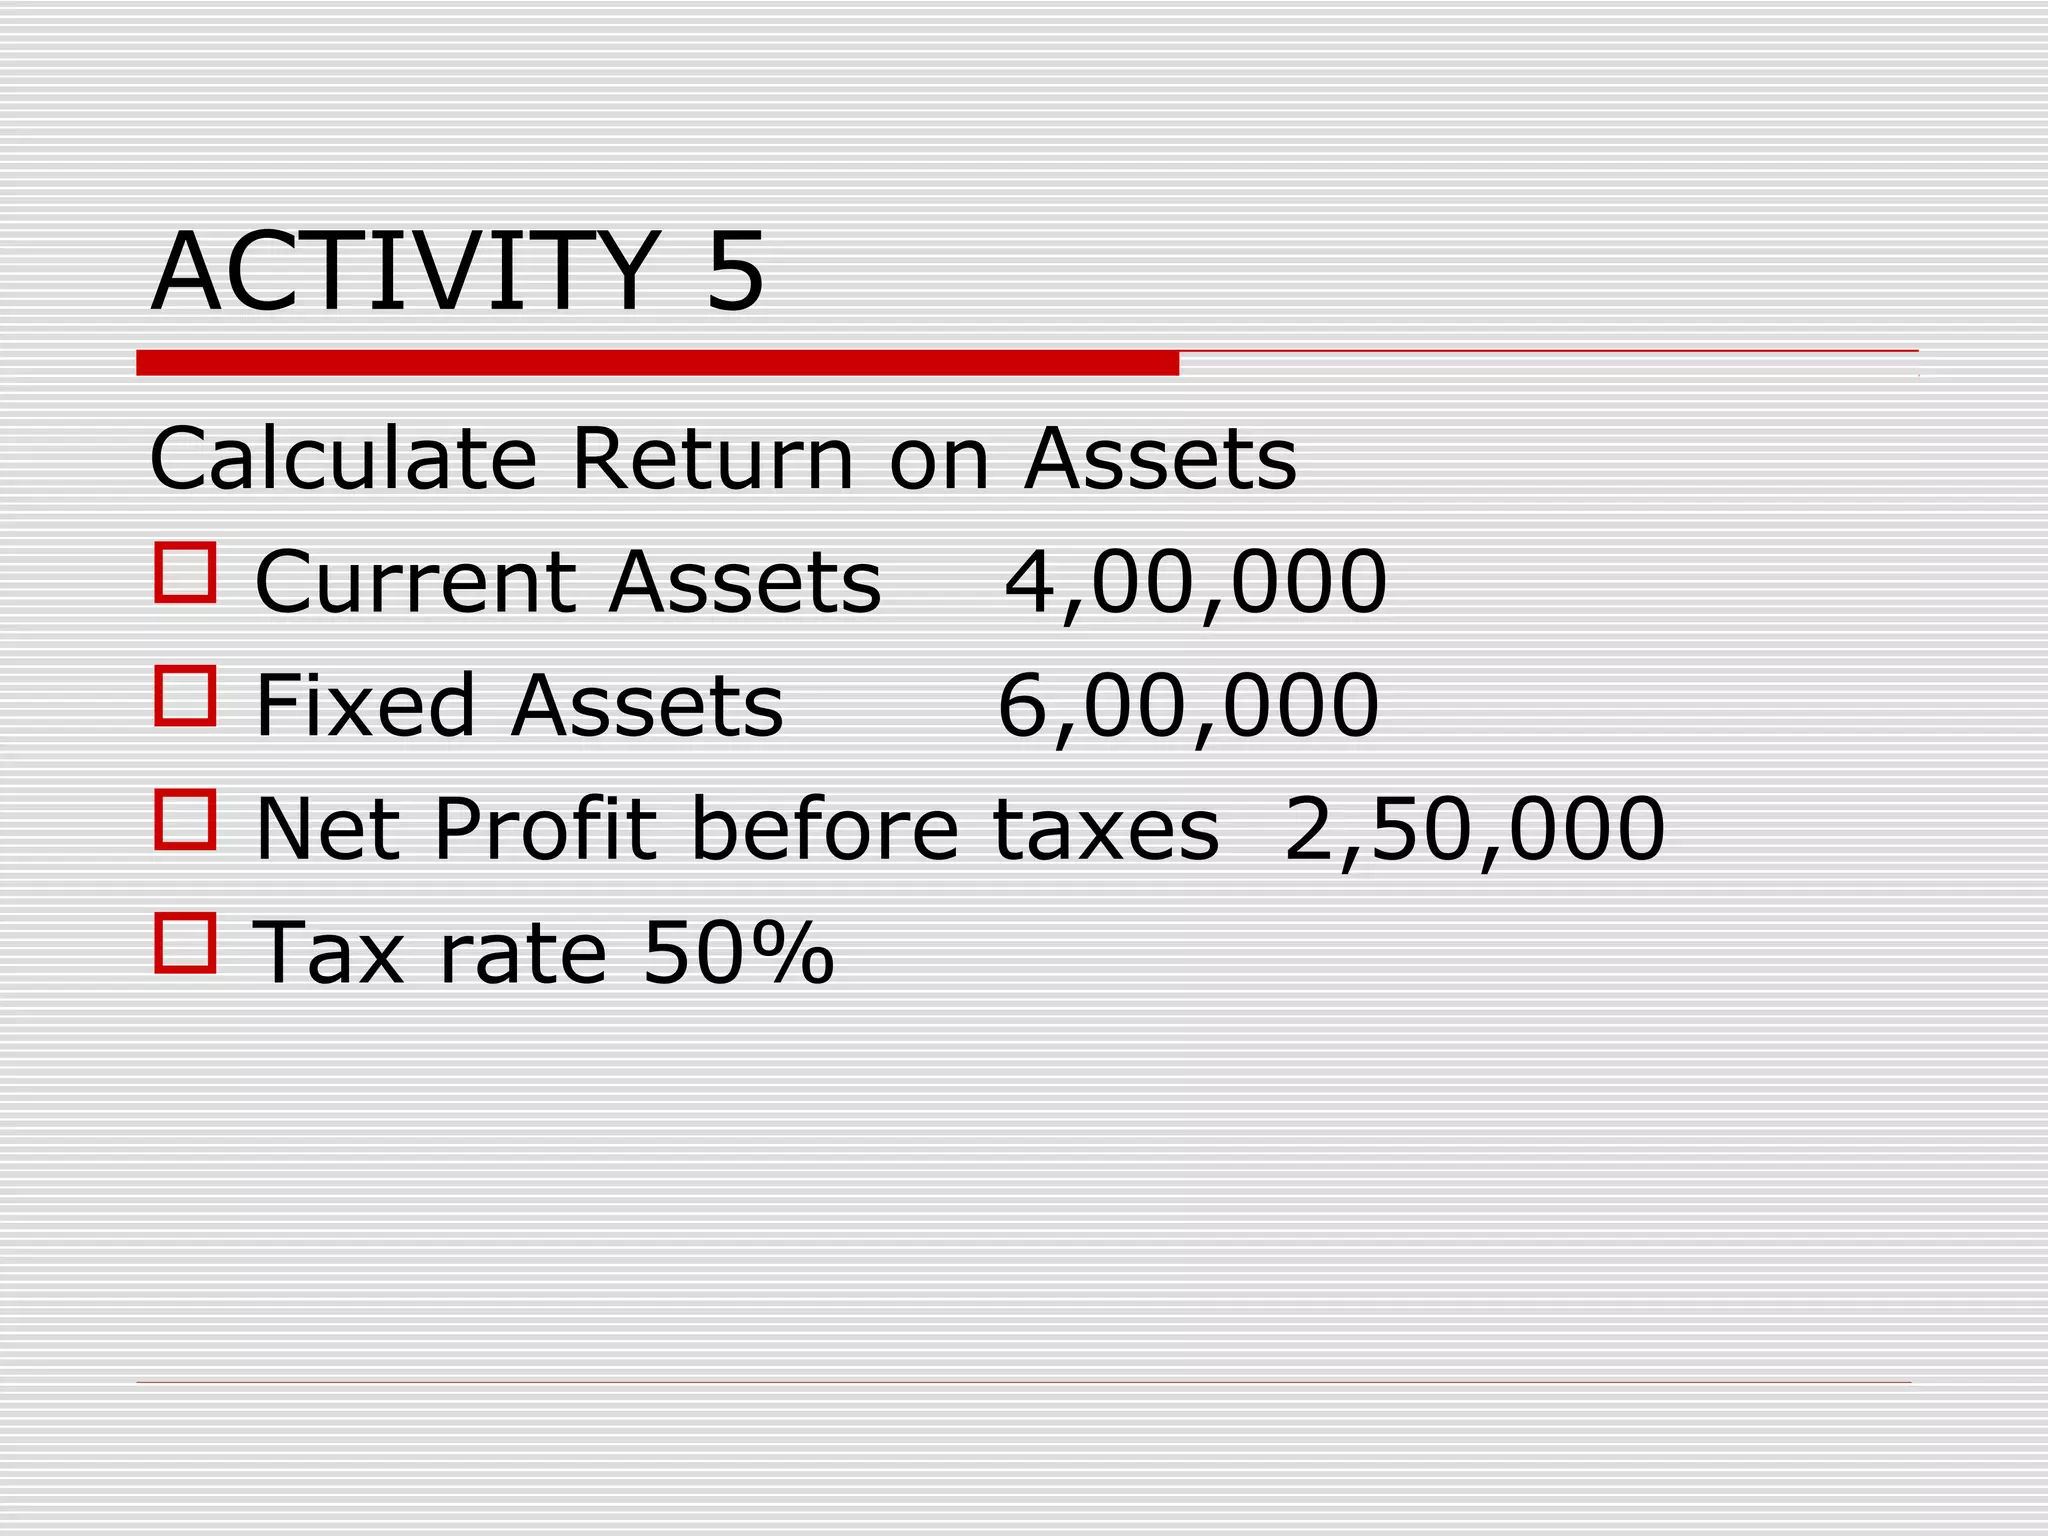
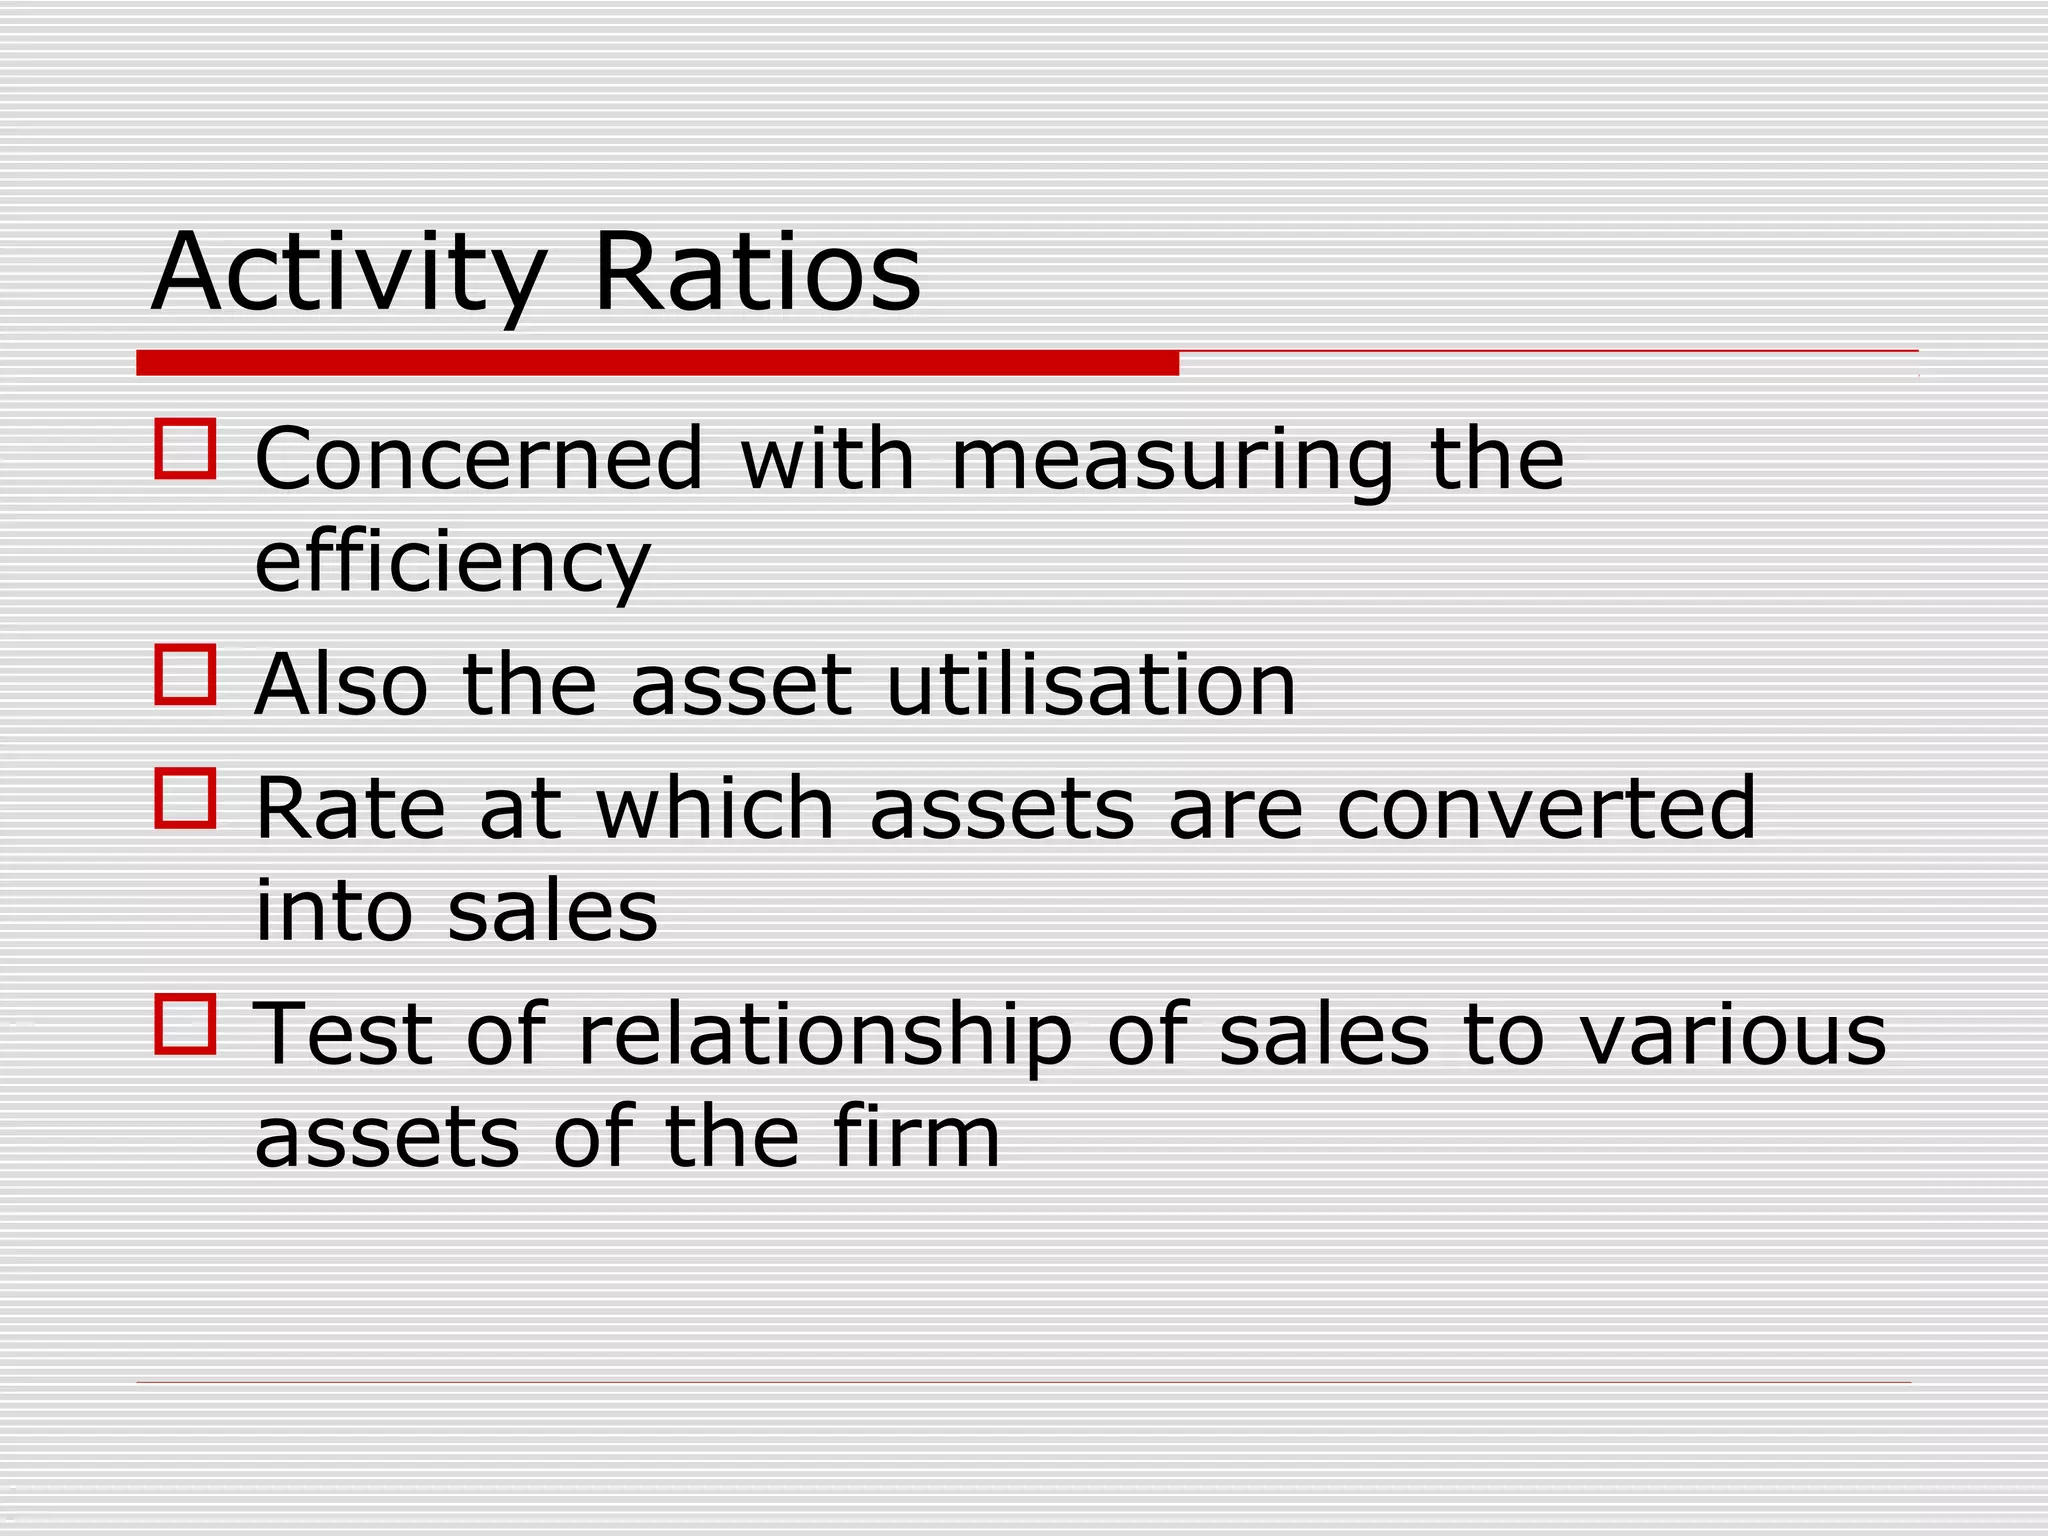
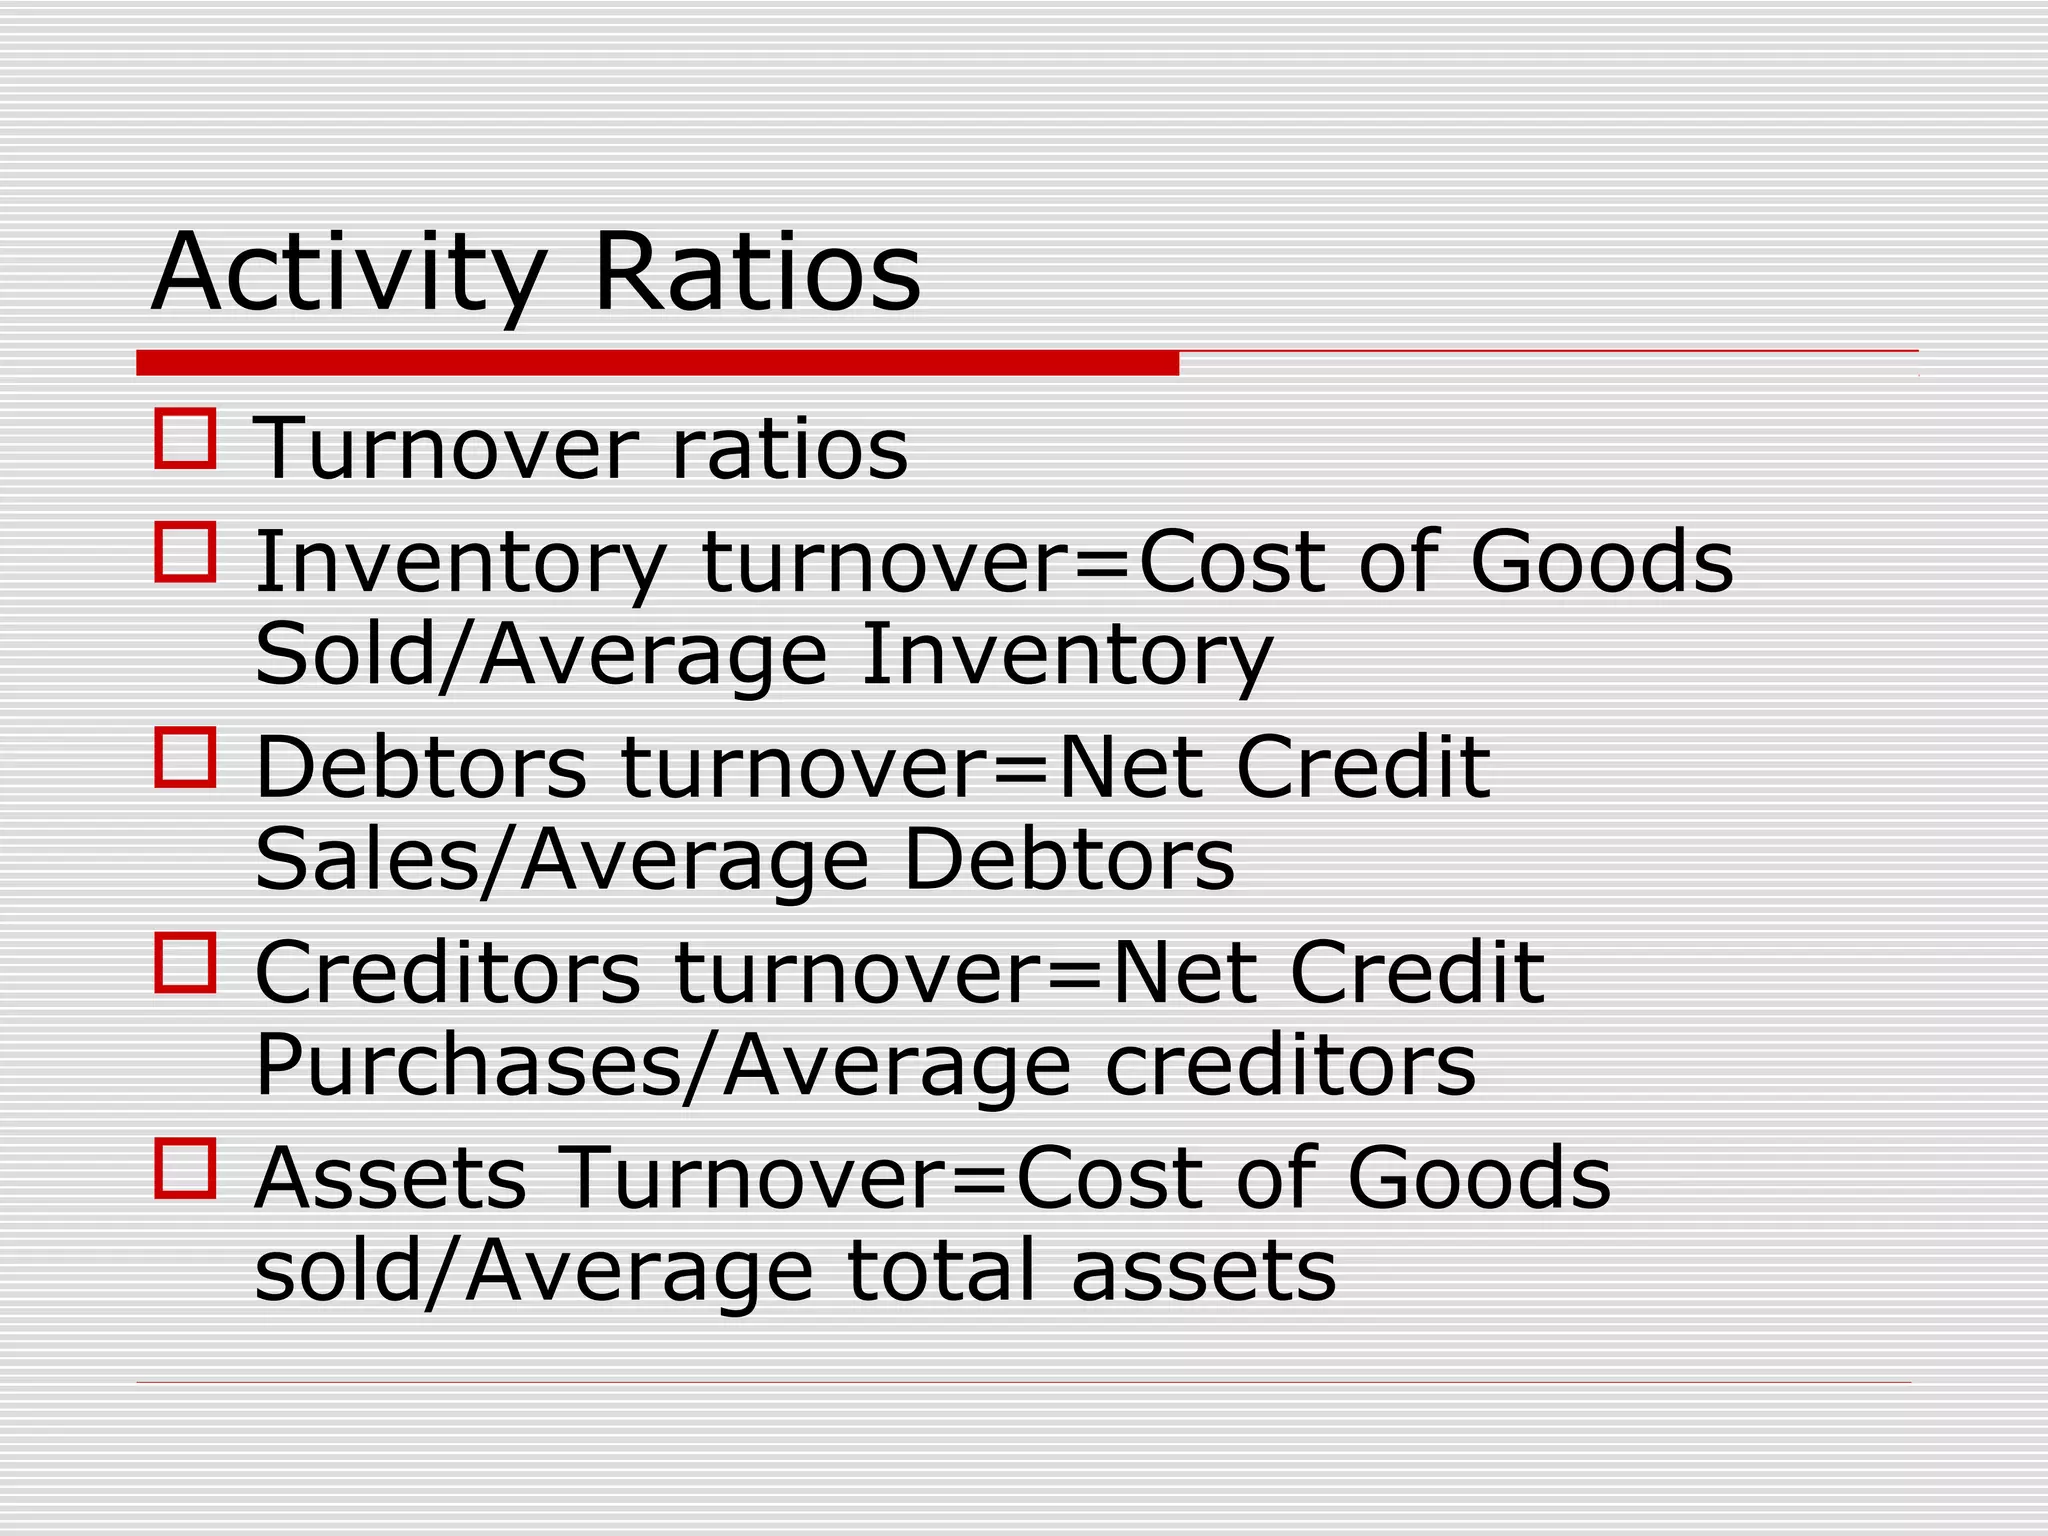
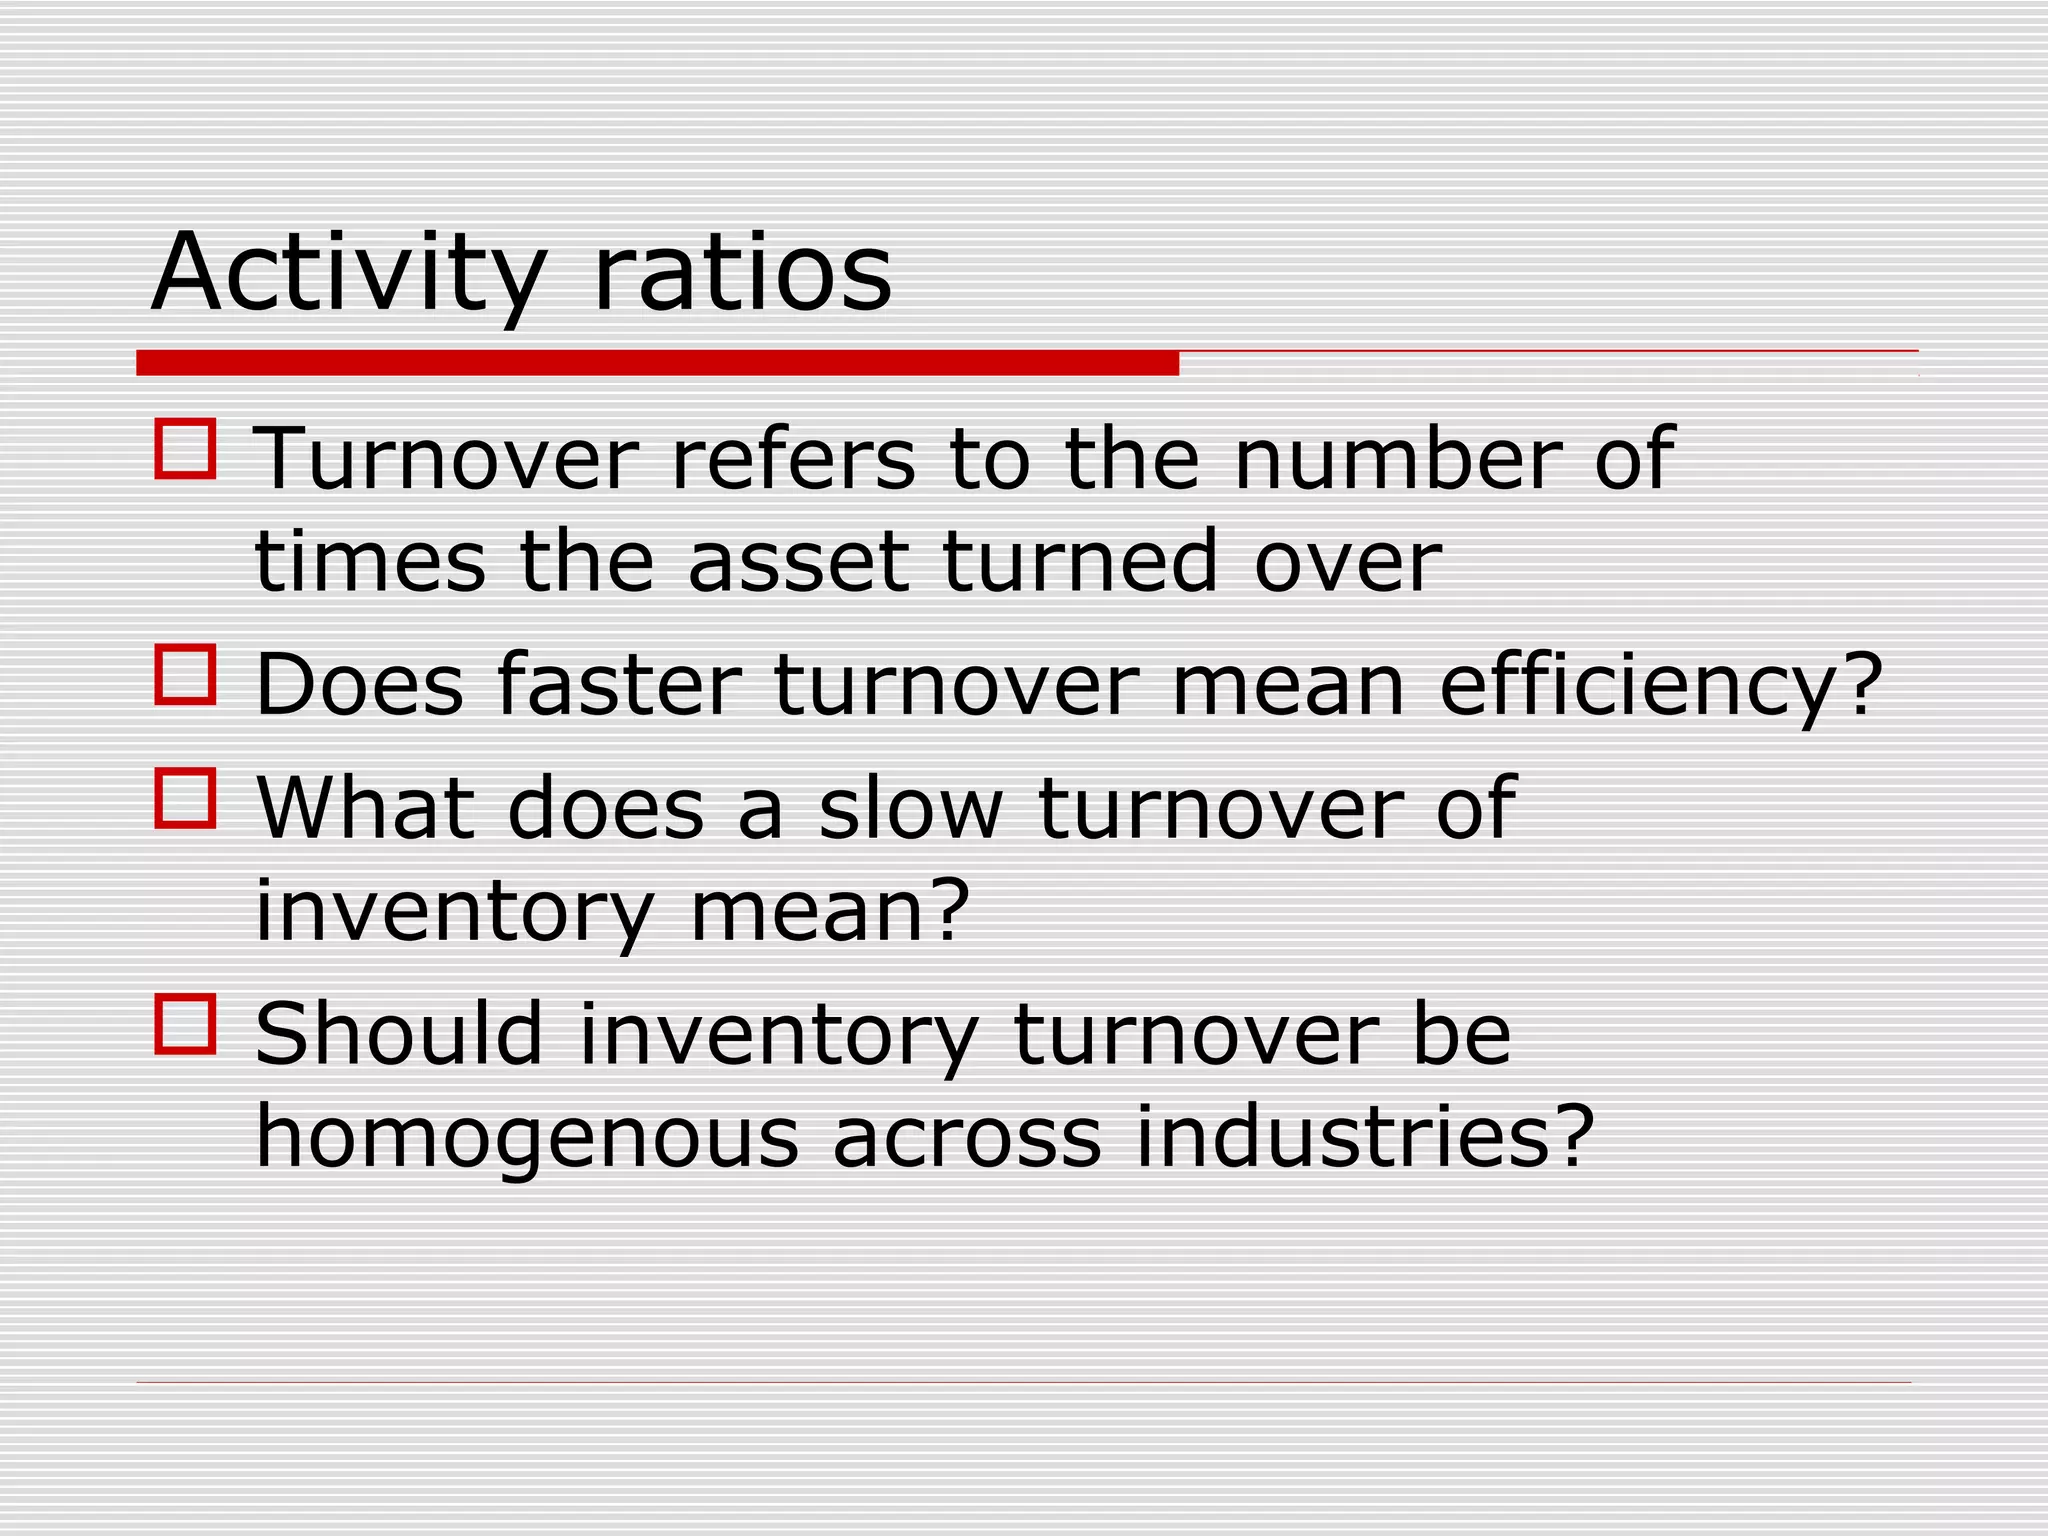
This document discusses financial statement analysis and ratio analysis. It provides an overview of the rationale, process, tools and components of financial analysis. Some key ratios discussed include liquidity ratios, capital structure ratios, profitability ratios, activity ratios and ratios on investments. Examples are given of how to calculate common ratios like current ratio, debt-to-equity ratio, gross profit margin, return on assets and inventory turnover. The document stresses the importance of ratio analysis for decision making and compares firms, while noting some limitations to keep in mind.
Horizontal analysis is also known as Trend Analysis refers to studying the behavior of individual financial statement items over several accounting periods. The Vertical Analysis concentrates on the relationships between various financial items on a financial statement. Copy the link given below and paste it in new browser window to get more information on Horizontal and Vertical Analysis:- http://www.transtutors.com/homework-help/accounting/horizontal-and-vertical-analysis.aspx
Profitability Ratio
A profitability ratio is a measure of financial ratio defining the profit percent and return percent from the business using data from financial statements at a specific point of time
It assess business’s ability to generate gross profit, operating profit and net profit from the sales using data from profit& loss statement
It even takes into consideration various return generating ability of business in terms of return on assets, return on capital employed, return on equity, return on investment using data from balance sheet
Types of profitability ratio
Gross Profit Ratio, Net Profit Ratio, Operating Profit Ratio, Return on Assets, Return on Equity, Return on Investment, Return on Capital Employed
Gross Profit Ratio
Gross Profit Ratio(GPR) is a profitability ratio that shows the relationship between gross profit and the revenue from net sales
GPR = (퐆퐫퐨퐬퐬 퐏퐫퐨퐟퐢퐭)/(퐍퐞퐭 퐒퐚퐥퐞퐬)
Net Profit Ratio
The net profit ratio is equal to how much net profit is generated as a ratio of revenue earned through sales
Net Profit Ratio = (퐍퐞퐭 푷풓풐풇풊풕)/(퐍퐞퐭 푺풂풍풆풔)
Operating Profit Margin is a profitability ratio used to calculate the percentage of operating profit a company produces from its operations, prior to deduction of taxes and interest charges
Operating Profit Ratio
Operating Profit Ratio = (퐎퐩퐞퐫퐚퐭퐢퐧퐠 퐏퐫퐨퐟퐢퐭)/(퐍퐞퐭 퐒퐚퐥퐞퐬)
Return on assets (ROA) is a kind of profitability measure used to determine returns on assets relevant when compared across the companies or previous performance of the company
Return On Asset = (퐍퐞퐭 퐏퐫퐨퐟퐢퐭)/(퐀퐯퐠.퐓퐨퐭퐚퐥 퐀퐬퐬퐞퐭퐬)
Return on equity (ROE) is a measure of financial performance calculated by dividing net profit by average shareholders' equity
ROE = (퐍퐞퐭 퐏퐫퐨퐟퐢퐭)/(퐀퐯퐠.퐓퐨퐭퐚퐥 퐄퐪퐮퐢퐭퐲)
Return on capital employed is a profitability ratio used in valuation of company’s financial position depicting the return out of capital employed
ROCE = 퐄퐁퐈퐓/(퐂퐚퐩퐢퐭퐚퐥 퐄퐦퐩퐥퐨퐲퐞퐝)
Return on investment is a profitability measure used by businesses to identify the efficiency of business in generating return out of an investment
ROI = (퐍퐞퐭 퐏퐫퐨퐟퐢퐭)/(퐂퐨퐬퐭 퐨퐟 퐈퐧퐯퐞퐬퐭퐦퐞퐧퐭)
Ratio analysis refers to the analysis and interpretation of the data collected from the financial statements (i.e., Profit and Loss Statement, Balance Sheet and Fund/Cash Flow statement etc.)
Thank You for Watching
DevTech Finance
Guidelines and uses of financial statement analysisTutors On Net
Computing ratios help in questioning
correctly about the company’s financial position, even though accurate answers may
be given, ratios form a mode in understanding company’s affairs
Jimmy Gentry presents "Common Size Analysis" in Minneapolis on Oct. 4, 2011 at the Star Tribune during the Reynolds Center's free workshop, "Business Journalism Boot Camp."
For more information about training for business journalists, please visit businessjournalism.org.
Ratio Analysis is a part of Financial Statement Analysis that is used to obtain a quick indication of a firm's financial performance in several key areas.
Liquidity ratios
Activity ratios
Solvency ratios
Profitability ratios
Financial ratios and their use in understanding Financial StatementsPranav Dedhia
An introduction and in-depth understanding on the importance of Financial ratios in understanding financial statements of business entities along with relevant examples
Which key numbers help you asses your performance in an organizat.pdfarenamobiles123
Which key numbers help you asses your performance in an organization
Solution
Performance Ratios
Calculation
What It Measures
Cash flow to revenue
CFO / Net revenue
Cash generated per dollar of revenue
Cash return on assets
CFO / Average total assets
Cash generated from all resources
Cash return on equity
CFO / Average shareholders’ equity
Cash generated from owner resources
Cash to income
CFO / Operating income
Cash-generating ability of operations
Cash flow per share
(CFO –Preferred dividends) / Number of common shares outstanding
Operating cash flow on a per-share basis
Profitability Ratios: Time Series Analysis (within company) OR Cross-Sectional Analysis
(Between Companies)
Return on Sales
Return on Investment: Performance measure used to evaluate the efficiency of investment. It is
one of most commonly used approaches for evaluating the financial consequences of business
investments, decisions, or actions
Balance Sheet Ratios:
Liquidity: Ability to meet short term obligations
Solvency:Ability to meet Long term obligations
Performance Ratios
Calculation
What It Measures
Cash flow to revenue
CFO / Net revenue
Cash generated per dollar of revenue
Cash return on assets
CFO / Average total assets
Cash generated from all resources
Cash return on equity
CFO / Average shareholders’ equity
Cash generated from owner resources
Cash to income
CFO / Operating income
Cash-generating ability of operations
Cash flow per share
(CFO –Preferred dividends) / Number of common shares outstanding
Operating cash flow on a per-share basis.
2. Rationale of Financial Statement
Analysis
Financial statement – summary of
figures as of any given date
To identify relevant information
Draw meaningful interpretations
3. Process of Analysis
Identification of significant
information
Highlight significant relationships
Interpretation
4. Tools of Financial Analysis
Fund flow Statement
Cash Flow Statement
Ratio Analysis
Common size statements
5. Balance Sheet Overview-
ASSETS
Assets
Gross Block 3978.55
Net Block 2790.57
Capital WIP 66.72
Investments 454.33
Inventory 610.81
Receivables 1546.81
Other Current Assets 3673.67
Balance Sheet Total 9142.92
7. Ratio Analysis
Most widely used and significant tool
Provides a basis for comparison
Useful when benchmark ratios are
known
Relationships between variables in
the financial statement
8. Types of ratios
Liquidity ratios
Capital Structure ratios
Profitability Ratios
Activity/Efficiency ratios
Integrated Analysis of ratios
Growth ratios
9. Overview of Balance Sheet
LIABILITIES
Equity
Capital/Owners’
Funds
Long Term
Borrowings
Current Liabilities
ASSETS
Fixed Assets
Current Assets
10. Liquidity Ratios
Measure the ability of firm to meet
short term obligations
Reflect short term financial strength
Why short term??- of interest to
creditors..
Ratios- Current ratio, Liquid ratio,
Turnover ratios, cash flow from
operation ratio
11. Liquidity ratios
Current Ratio= Current Assets/
Current Liabilities
Liquid ratio= Liquid Assets/Current
Liabilities
12. NEED FOR LIQUIDITY
Assume stocks are bought on credit
Converted to inventory
Sales=0
Current Ratio??
Liquid Ratio??
Implications on liquidity-serious
13. ACTIVITY 1
Calculate Current Ratio, Liquid ratio,
Debtors Turnover and Creditors turnover
from the following information
Average Debtors=1,00,000
Average Creditors=75,000
Cash= 5,000
Inventory=75,000
Credit Purchases=6,00,000
Credit Sales=12,00,000
14. Capital Structure ratios
Helps to measure long term financial
strength
Solvency of the firm
Ability to service interest on loans
Ability to service the principal
15. Capital Structure Ratios
Debt Equity ratio= Long Term
Debt/Shareholders Equity
Debt to total Capital= Total
Debt/Total Assets
Interest Coverage Ratio= Earnings
Before Interest and Tax/Interest
16. ACTIVITY 2
What happens when a firm is purely
funded by equity?
What happens when a firm is purely
funded by debt?
Which is riskier when profits are less?
When equity is high and profits are
high, what happens to ROI?
17. Profitability ratios
Related to Sales
Ability of the firm to mark up on sales
Ability of firm to convert margins to
profit
Proportion of expense to income
Analysis of income and expenses
18. Profitability ratios
Gross Profit Margin= Gross
profit/Sales*100
Operating Profit ratio= Earnings
Before Interest and taxes/Net Sales
Net Profit Ratio= Earnings after
interest and taxes/Net Sales
Expenses ratio- Cost of Goods sold,
Operating Ratio, Financial Expenses
19. Ratios on Investments
Related to investment
Ability to generate return on
investment
Ultimate measure of profitability
Ability of firm to generate wealth
20. Profitability on Investment
Return on Assets= Profit after
Taxes/Average total assets*100
Return on Capital Employed=
EBIT/Average Total Capital
Employed*100
Return on Shareholders Equity=
Net profit after taxes/Average
shareholders’ equity*100
21. ACTIVITY 3
Earnings Before Interest and Tax=
Rs.5,00,000
Interest payment =Rs.75,000
Tax rate = 50%
Calculate Earnings after Interest and
tax
22. Profitability on investment
Earnings per share=Net Profit
available to Equity
Shareholders/Number of ordinary
shares outstanding
Price earning ratio= Market price of
share/EPS
23. ACTIVITY 4
Calculate Gross Profit Margin and Net
profit Margin
Sales 2,00,000
Cost of Goods Sold 1,00,000
Other operating expenses 50,000
24. ACTIVITY 5
Calculate Return on Assets
Current Assets 4,00,000
Fixed Assets 6,00,000
Net Profit before taxes 2,50,000
Tax rate 50%
25. Activity Ratios
Concerned with measuring the
efficiency
Also the asset utilisation
Rate at which assets are converted
into sales
Test of relationship of sales to various
assets of the firm
27. Activity ratios
Turnover refers to the number of
times the asset turned over
Does faster turnover mean efficiency?
What does a slow turnover of
inventory mean?
Should inventory turnover be
homogenous across industries?
28. ACTIVITY 6
In which industries inventory
turnover is irrelevant?
Which industries have seasonal
turnover of inventory?
Which are the industries where
turnover is not rapid?
When will the Debtor Turnover be
irrelevant?
29. Integrated Analysis of ratios
To understand the interrelationship of
ratios
Operating efficiency-combination of
various factors
Tests the earning power of the firm
31. Growth ratios
Growth that can be sustained without
external funding
Earnings that are retained and
reinvested within the firm
The two common measures used are
Internal Growth rate-without raising
funds
Sustainable growth rate- Without
altering Debt Equity ratio
32. ACTIVITY 7
Which ratios will you look for when
you want to invest in a firm
Which are the ratios a banker will
look for?
Which ratios are relevant from the
point of view of revenue?
Which ratios are relevant if a supplier
is contemplating to give credit to a
firm?
33. What you must remember while
calculating ratios
Nature of Industry-Service, Seasonal,
Heavy Engineering, Infrastructure..
Age of the firm
Industry benchmark
Peculiarities in the business
Risk Factors
35. Limitations of ratio Analysis
Individual accounting variations
Impact of inflation
Conceptual diversity
Only quantifiable inputs can be
evaluated