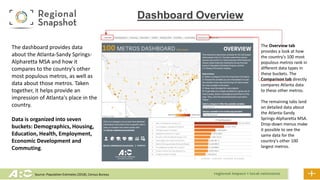
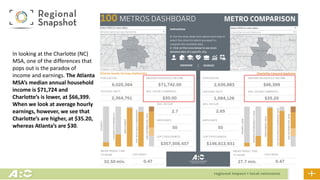
The document is a summary and analysis of data from the 2021 Regional Snapshot report by the Atlanta Regional Commission comparing socioeconomic metrics of the Atlanta metro area to the other largest 100 metro areas in the US. Some key points:
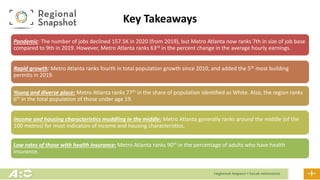
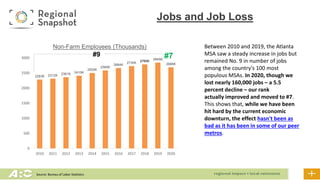
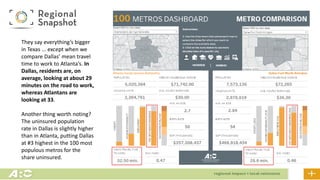
- Atlanta ranked 7th in total jobs in 2020 despite losing 157.5K jobs due to the pandemic, down from 9th in 2019.
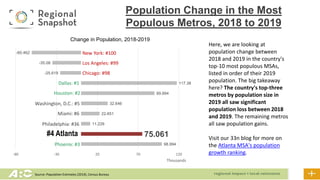
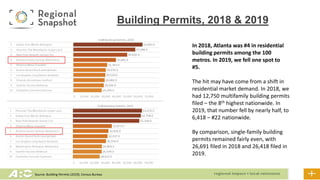
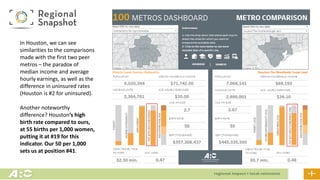
- Atlanta ranked 4th in population growth since 2010 and 5th in building permits issued in 2019.
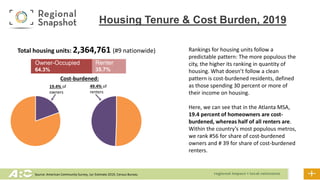
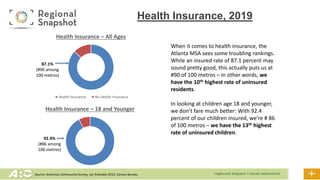
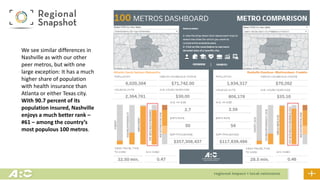
- The metro area ranks more middle of the pack for metrics like income, housing costs, and health insurance rates.
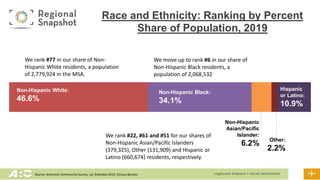
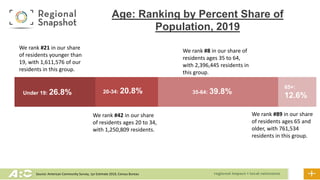
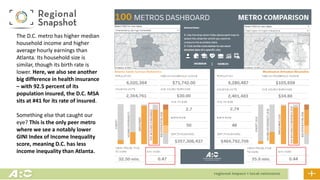
- Atlanta ranks 77th for percentage of white population and 6th for population under age 19, indicating a