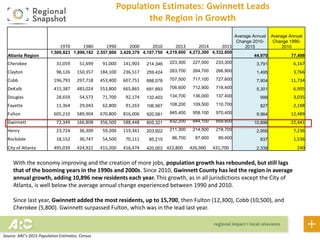
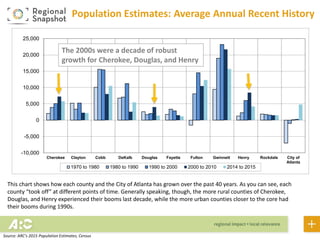
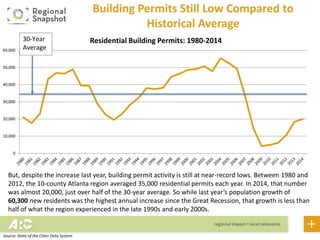
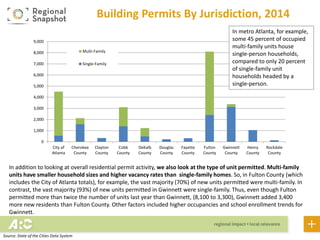
Atlanta Regional Commission
For more information, contact:
mcarnathan@atlantaregional.com
Population Estimates for the Atlanta Region:
Another Steady Year of Growth
• The 10-county Atlanta region is now home to 4,332,600 in 2015, up from 4,272,300
in 2014. From April 1, 2014 to April 1, 2015 the region added 60,300 new
residents.
• From 2014 to 2015, Gwinnett added 15,700 new residents, the largest single-year
growth in the region. Next were Fulton with 12,300 new residents, Cobb with
10,500 new residents, and Cherokee with 5,800 new residents.
• Overall, the more rural counties of Cherokee, Douglas, and Henry experienced their
population booms last decade, whereas the urban counties grew the most during
the 1990s.
• In 2014, there were almost 20,000 new residential building permits in the 10-
county region, which was 1,600 higher than the number permitted in 2013. Still,
building permit activity for the 10-county region is still muted when compared to
pre-recession population growth levels.
The Highlights
Population Estimates
1970 1980 1990 2000 2010 2013 2014 2015
Average Annual
Change 2010-
2015
Average Annual
Change 1990-
2010
Atlanta Region
1,500,823 1,896,182 2,557,800 3,429,379 4,107,750 4,219,600 4,272,300 4,332,600
44,970 77,498
Cherokee 31,059 51,699 91,000 141,903 214,346 223,300 227,500 233,300 3,791 6,167
Clayton 98,126 150,357 184,100 236,517 259,424 263,700 264,700 266,900 1,495 3,766
Cobb 196,793 297,718 453,400 607,751 688,078 707,500 717,100 727,600 7,904 11,734
DeKalb 415,387 483,024 553,800 665,865 691,893 706,600 712,900 718,400 5,301 6,905
Douglas 28,659 54,573 71,700 92,174 132,403 134,700 136,000 137,400 999 3,035
Fayette 11,364 29,043 62,800 91,263 106,567 108,200 109,500 110,700 827 2,188
Fulton 605,210 589,904 670,800 816,006 920,581 945,400 958,100 970,400 9,964 12,489
Gwinnett 72,349 166,808 356,500 588,448 805,321 832,200 844,100 859,800 10,896 22,441
Henry 23,724 36,309 59,200 119,341 203,922 211,300 214,500 218,700 2,956 7,236
Rockdale 18,152 36,747 54,500 70,111 85,215 86,700 87,900 89,400 837 1,536
City of Atlanta 495,039 424,922 415,200 416,474 420,003 422,800 426,900 431,700 2,339 240
The 10-County Atlanta region has averaged almost 45,000 new residents each year since 2010, which is much
lower than the annual growth experienced between 1990 and 2010. This is still an increase compared to last
year, when the region, from 2010-2014, had only averaged around 41,000 residents each year. Over the past
year (April 1, 2014 and April 1, 2015), however, the region added 60,300 new residents, compared to 52,700
between 2013 and 2014.
Note: The City of Atlanta totals are included in both DeKalb’s and Fulton’s population estimates
Source: ARC’s 2015 Population Estimates, Census
Population Estimates: Gwinnett Leads
the Region in Growth
1970 1980 1990 2000 2010 2013 2014 2015
Average Annual
Change 2010-
2015
Average Annual
Change 1990-
2010
Atlanta Region
1,500,823 1,896,182 2,557,800 3,429,379 4,107,750 4,219,600 4,272,300 4,332,600
44,970 77,498
Cherokee 31,059 51,699 91,000 141,903 214,346 223,300 227,500 233,300 3,791 6,167
Clayton 98,126 150,357 184,100 236,517 259,424 263,700 264,700 266,900 1,495 3,766
Cobb 196,793 297,718 453,400 607,751 688,078 707,500 717,100 727,600 7,904 11,734
DeKalb 415,387 483,024 553,800 665,865 691,893 706,600 712,900 718,400 5,301 6,905
Douglas 28,659 54,573 71,700 92,174 132,403 134,700 136,000 137,400 999 3,035
Fayette 11,364 29,043 62,800 91,263 106,567 108,200 109,500 110,700 827 2,188
Fulton 605,210 589,904 670,800 816,006 920,581 945,400 958,100 970,400 9,964 12,489
Gwinnett 72,349 166,808 356,500 588,448 805,321 832,200 844,100 859,800 10,896 22,441
Henry 23,724 36,309 59,200 119,341 203,922 211,300 214,500 218,700 2,956 7,236
Rockdale 18,152 36,747 54,500 70,111 85,215 86,700 87,900 89,400 837 1,536
City of Atlanta 495,039 424,922 415,200 416,474 420,003 422,800 426,900 431,700 2,339 240
With the economy improving and the creation of more jobs, population growth has rebounded, but still lags
that of the booming years in the 1990s and 2000s. Since 2010, Gwinnett County has led the region in average
annual growth, adding 10,896 new residents each year. This growth, as in all jurisdictions except the City of
Atlanta, is well below the average annual change experienced between 1990 and 2010.
Since last year, Gwinnett added the most residents, up to 15,700, then Fulton (12,300), Cobb (10,500), and
Cherokee (5,800). Gwinnett surpassed Fulton, which was in the lead last year.
Source: ARC’s 2015 Population Estimates, Census
Population Estimates: Average Annual Recent History
-10,000
-5,000
0
5,000
10,000
15,000
20,000
25,000
Cherokee Clayton Cobb DeKalb Douglas Fayette Fulton Gwinnett Henry Rockdale City of
Atlanta
1970 to 1980 1980 to 1990 1990 to 2000 2000 to 2010 2014 to 2015
This chart shows how each county and the City of Atlanta has grown over the past 40 years. As you can see, each
county “took off” at different points of time. Generally speaking, though, the more rural counties of Cherokee,
Douglas, and Henry experienced their booms last decade, while the more urban counties closer to the core had
their booms during 1990s.
The 2000s were a decade of robust
growth for Cherokee, Douglas, and Henry
Source: ARC’s 2015 Population Estimates, Census
Population Estimates: Average Annual Recent
History
-10,000
-5,000
0
5,000
10,000
15,000
20,000
25,000
Cherokee Clayton Cobb DeKalb Douglas Fayette Fulton Gwinnett Henry Rockdale City of
Atlanta
1970 to 1980 1980 to 1990 1990 to 2000 2000 to 2010 2014 to 2015
The 1990s were the decade of
the most robust growth for
DeKalb, Fulton, and Gwinnett
Again, chart shows how each county and the City of Atlanta has grown over the past 40 years. As discussed in the
previous slide, the more urban counties of DeKalb, Fulton and Gwinnett experienced their booms during the 1990s.
Source: ARC’s 2015 Population Estimates, Census
Population Growth Through the Decades
0.0%
5.0%
10.0%
15.0%
20.0%
25.0%
30.0%
35.0%
40.0%
%
Change
'30-'40
%
Change
'40-'50
%
Change
'50-'60
%
Change
'60-'70
%
Change
'70-'80
%
Change
'80-'90
%
Change
'90-2000
%
Change
'00-2010
Percent Change by Decade: 10-County ARC
0
100,000
200,000
300,000
400,000
500,000
600,000
700,000
800,000
900,000
1,000,000
#
Change
'30-'40
#
Change
'40-'50
#
Change
'50-'60
#
Change
'60-'70
#
Change
'70-'80
#
Change
'80-'90
#
Change
'90-2000
#
Change
'00-2010
Raw Change by Decade: 10-County ARC
The 1990s were booming, as the 10-county Atlanta region added more than 900,000 new residents during the decade,
by far the largest net gain in population when compared to other decades spanning back to the 1930s. On a
percentage basis, however, the 1950s had the largest gains, with the region growing by some 38 percent between 1950
and 1960.
Source: ARC’s 2015 Population Estimates, Census
Building Permits Still Low Compared
to Historical Average
0
10,000
20,000
30,000
40,000
50,000
60,000
Residential Building Permits: 1980-2014
While ARC looks at several sources of data in developing our annual population estimates, examining building permit
activity is a primary input. The lagging building permit activity of the last few years helps explain why population growth
has been so sluggish. But, in 2014, there were almost 20,000 new building permits in the 10-county region, which was
about 1,600 higher than the number permitted in 2013. As building permit activity ticks back up, so will population
growth. But permitting activity is just now back to 1991 levels.
Source: State of the Cities Data System
Building Permits Still Low Compared to
Historical Average
0
10,000
20,000
30,000
40,000
50,000
60,000
Residential Building Permits: 1980-201430-Year
Average
But, despite the increase last year, building permit activity is still at near-record lows. Between 1980 and
2012, the 10-county Atlanta region averaged 35,000 residential permits each year. In 2014, that number
was almost 20,000, just over half of the 30-year average. So while last year’s population growth of
60,300 new residents was the highest annual increase since the Great Recession, that growth is less than
half of what the region experienced in the late 1990s and early 2000s.
Source: State of the Cities Data System
0
1,000
2,000
3,000
4,000
5,000
6,000
7,000
8,000
9,000
City of
Atlanta
Cherokee
County
Clayton
County
Cobb
County
DeKalb
County
Douglas
County
Fayette
County
Fulton
County
Gwinnett
County
Henry
County
Rockdale
County
Multi-Family
Single-Family
Building Permits By Jurisdiction, 2014
In addition to looking at overall residential permit activity, we also look at the type of unit permitted. Multi-family
units have smaller household sizes and higher vacancy rates than single-family homes. So, in Fulton County (which
includes the City of Atlanta totals), for example, the vast majority (70%) of new units permitted were multi-family. In
contrast, the vast majority (93%) of new units permitted in Gwinnett were single-family. Thus, even though Fulton
permitted more than twice the number of units last year than Gwinnett, (8,100 to 3,300), Gwinnett added 3,400
more new residents than Fulton County. Other factors included higher occupancies and school enrollment trends for
Gwinnett.
In metro Atlanta, for example,
some 45 percent of occupied
multi-family units house
single-person households,
compared to only 20 percent
of single-family unit
households headed by a
single-person.
Source: State of the Cities Data System
The map on the right shows population change per square mile between 2010-2015. Dark blue indicates the largest
population increase while light blue and white represent the lowest. The dark blue on the left map indicates high density
single-family permits and red dots represent new apartment complex permits. These two maps show why tracking
building permits is important to understanding population changes, because, in general, the areas with the highest
concentrations of building permits (left) correspond to the areas with the highest growth (right).
Population Change per Square Mile, 2010-20152014 New Apartment Complex Permits /Density of Single Family Permits
Where Growth is Going
Source: HB Weekly (permits) and ESRI (small-area population estimates).

Population Estimates, August 2015 Snapshot

  • 1.
    Atlanta Regional Commission Formore information, contact: mcarnathan@atlantaregional.com Population Estimates for the Atlanta Region: Another Steady Year of Growth
  • 2.
    • The 10-countyAtlanta region is now home to 4,332,600 in 2015, up from 4,272,300 in 2014. From April 1, 2014 to April 1, 2015 the region added 60,300 new residents. • From 2014 to 2015, Gwinnett added 15,700 new residents, the largest single-year growth in the region. Next were Fulton with 12,300 new residents, Cobb with 10,500 new residents, and Cherokee with 5,800 new residents. • Overall, the more rural counties of Cherokee, Douglas, and Henry experienced their population booms last decade, whereas the urban counties grew the most during the 1990s. • In 2014, there were almost 20,000 new residential building permits in the 10- county region, which was 1,600 higher than the number permitted in 2013. Still, building permit activity for the 10-county region is still muted when compared to pre-recession population growth levels. The Highlights
  • 3.
    Population Estimates 1970 19801990 2000 2010 2013 2014 2015 Average Annual Change 2010- 2015 Average Annual Change 1990- 2010 Atlanta Region 1,500,823 1,896,182 2,557,800 3,429,379 4,107,750 4,219,600 4,272,300 4,332,600 44,970 77,498 Cherokee 31,059 51,699 91,000 141,903 214,346 223,300 227,500 233,300 3,791 6,167 Clayton 98,126 150,357 184,100 236,517 259,424 263,700 264,700 266,900 1,495 3,766 Cobb 196,793 297,718 453,400 607,751 688,078 707,500 717,100 727,600 7,904 11,734 DeKalb 415,387 483,024 553,800 665,865 691,893 706,600 712,900 718,400 5,301 6,905 Douglas 28,659 54,573 71,700 92,174 132,403 134,700 136,000 137,400 999 3,035 Fayette 11,364 29,043 62,800 91,263 106,567 108,200 109,500 110,700 827 2,188 Fulton 605,210 589,904 670,800 816,006 920,581 945,400 958,100 970,400 9,964 12,489 Gwinnett 72,349 166,808 356,500 588,448 805,321 832,200 844,100 859,800 10,896 22,441 Henry 23,724 36,309 59,200 119,341 203,922 211,300 214,500 218,700 2,956 7,236 Rockdale 18,152 36,747 54,500 70,111 85,215 86,700 87,900 89,400 837 1,536 City of Atlanta 495,039 424,922 415,200 416,474 420,003 422,800 426,900 431,700 2,339 240 The 10-County Atlanta region has averaged almost 45,000 new residents each year since 2010, which is much lower than the annual growth experienced between 1990 and 2010. This is still an increase compared to last year, when the region, from 2010-2014, had only averaged around 41,000 residents each year. Over the past year (April 1, 2014 and April 1, 2015), however, the region added 60,300 new residents, compared to 52,700 between 2013 and 2014. Note: The City of Atlanta totals are included in both DeKalb’s and Fulton’s population estimates Source: ARC’s 2015 Population Estimates, Census
  • 4.
    Population Estimates: GwinnettLeads the Region in Growth 1970 1980 1990 2000 2010 2013 2014 2015 Average Annual Change 2010- 2015 Average Annual Change 1990- 2010 Atlanta Region 1,500,823 1,896,182 2,557,800 3,429,379 4,107,750 4,219,600 4,272,300 4,332,600 44,970 77,498 Cherokee 31,059 51,699 91,000 141,903 214,346 223,300 227,500 233,300 3,791 6,167 Clayton 98,126 150,357 184,100 236,517 259,424 263,700 264,700 266,900 1,495 3,766 Cobb 196,793 297,718 453,400 607,751 688,078 707,500 717,100 727,600 7,904 11,734 DeKalb 415,387 483,024 553,800 665,865 691,893 706,600 712,900 718,400 5,301 6,905 Douglas 28,659 54,573 71,700 92,174 132,403 134,700 136,000 137,400 999 3,035 Fayette 11,364 29,043 62,800 91,263 106,567 108,200 109,500 110,700 827 2,188 Fulton 605,210 589,904 670,800 816,006 920,581 945,400 958,100 970,400 9,964 12,489 Gwinnett 72,349 166,808 356,500 588,448 805,321 832,200 844,100 859,800 10,896 22,441 Henry 23,724 36,309 59,200 119,341 203,922 211,300 214,500 218,700 2,956 7,236 Rockdale 18,152 36,747 54,500 70,111 85,215 86,700 87,900 89,400 837 1,536 City of Atlanta 495,039 424,922 415,200 416,474 420,003 422,800 426,900 431,700 2,339 240 With the economy improving and the creation of more jobs, population growth has rebounded, but still lags that of the booming years in the 1990s and 2000s. Since 2010, Gwinnett County has led the region in average annual growth, adding 10,896 new residents each year. This growth, as in all jurisdictions except the City of Atlanta, is well below the average annual change experienced between 1990 and 2010. Since last year, Gwinnett added the most residents, up to 15,700, then Fulton (12,300), Cobb (10,500), and Cherokee (5,800). Gwinnett surpassed Fulton, which was in the lead last year. Source: ARC’s 2015 Population Estimates, Census
  • 5.
    Population Estimates: AverageAnnual Recent History -10,000 -5,000 0 5,000 10,000 15,000 20,000 25,000 Cherokee Clayton Cobb DeKalb Douglas Fayette Fulton Gwinnett Henry Rockdale City of Atlanta 1970 to 1980 1980 to 1990 1990 to 2000 2000 to 2010 2014 to 2015 This chart shows how each county and the City of Atlanta has grown over the past 40 years. As you can see, each county “took off” at different points of time. Generally speaking, though, the more rural counties of Cherokee, Douglas, and Henry experienced their booms last decade, while the more urban counties closer to the core had their booms during 1990s. The 2000s were a decade of robust growth for Cherokee, Douglas, and Henry Source: ARC’s 2015 Population Estimates, Census
  • 6.
    Population Estimates: AverageAnnual Recent History -10,000 -5,000 0 5,000 10,000 15,000 20,000 25,000 Cherokee Clayton Cobb DeKalb Douglas Fayette Fulton Gwinnett Henry Rockdale City of Atlanta 1970 to 1980 1980 to 1990 1990 to 2000 2000 to 2010 2014 to 2015 The 1990s were the decade of the most robust growth for DeKalb, Fulton, and Gwinnett Again, chart shows how each county and the City of Atlanta has grown over the past 40 years. As discussed in the previous slide, the more urban counties of DeKalb, Fulton and Gwinnett experienced their booms during the 1990s. Source: ARC’s 2015 Population Estimates, Census
  • 7.
    Population Growth Throughthe Decades 0.0% 5.0% 10.0% 15.0% 20.0% 25.0% 30.0% 35.0% 40.0% % Change '30-'40 % Change '40-'50 % Change '50-'60 % Change '60-'70 % Change '70-'80 % Change '80-'90 % Change '90-2000 % Change '00-2010 Percent Change by Decade: 10-County ARC 0 100,000 200,000 300,000 400,000 500,000 600,000 700,000 800,000 900,000 1,000,000 # Change '30-'40 # Change '40-'50 # Change '50-'60 # Change '60-'70 # Change '70-'80 # Change '80-'90 # Change '90-2000 # Change '00-2010 Raw Change by Decade: 10-County ARC The 1990s were booming, as the 10-county Atlanta region added more than 900,000 new residents during the decade, by far the largest net gain in population when compared to other decades spanning back to the 1930s. On a percentage basis, however, the 1950s had the largest gains, with the region growing by some 38 percent between 1950 and 1960. Source: ARC’s 2015 Population Estimates, Census
  • 8.
    Building Permits StillLow Compared to Historical Average 0 10,000 20,000 30,000 40,000 50,000 60,000 Residential Building Permits: 1980-2014 While ARC looks at several sources of data in developing our annual population estimates, examining building permit activity is a primary input. The lagging building permit activity of the last few years helps explain why population growth has been so sluggish. But, in 2014, there were almost 20,000 new building permits in the 10-county region, which was about 1,600 higher than the number permitted in 2013. As building permit activity ticks back up, so will population growth. But permitting activity is just now back to 1991 levels. Source: State of the Cities Data System
  • 9.
    Building Permits StillLow Compared to Historical Average 0 10,000 20,000 30,000 40,000 50,000 60,000 Residential Building Permits: 1980-201430-Year Average But, despite the increase last year, building permit activity is still at near-record lows. Between 1980 and 2012, the 10-county Atlanta region averaged 35,000 residential permits each year. In 2014, that number was almost 20,000, just over half of the 30-year average. So while last year’s population growth of 60,300 new residents was the highest annual increase since the Great Recession, that growth is less than half of what the region experienced in the late 1990s and early 2000s. Source: State of the Cities Data System
  • 10.
    0 1,000 2,000 3,000 4,000 5,000 6,000 7,000 8,000 9,000 City of Atlanta Cherokee County Clayton County Cobb County DeKalb County Douglas County Fayette County Fulton County Gwinnett County Henry County Rockdale County Multi-Family Single-Family Building PermitsBy Jurisdiction, 2014 In addition to looking at overall residential permit activity, we also look at the type of unit permitted. Multi-family units have smaller household sizes and higher vacancy rates than single-family homes. So, in Fulton County (which includes the City of Atlanta totals), for example, the vast majority (70%) of new units permitted were multi-family. In contrast, the vast majority (93%) of new units permitted in Gwinnett were single-family. Thus, even though Fulton permitted more than twice the number of units last year than Gwinnett, (8,100 to 3,300), Gwinnett added 3,400 more new residents than Fulton County. Other factors included higher occupancies and school enrollment trends for Gwinnett. In metro Atlanta, for example, some 45 percent of occupied multi-family units house single-person households, compared to only 20 percent of single-family unit households headed by a single-person. Source: State of the Cities Data System
  • 11.
    The map onthe right shows population change per square mile between 2010-2015. Dark blue indicates the largest population increase while light blue and white represent the lowest. The dark blue on the left map indicates high density single-family permits and red dots represent new apartment complex permits. These two maps show why tracking building permits is important to understanding population changes, because, in general, the areas with the highest concentrations of building permits (left) correspond to the areas with the highest growth (right). Population Change per Square Mile, 2010-20152014 New Apartment Complex Permits /Density of Single Family Permits Where Growth is Going Source: HB Weekly (permits) and ESRI (small-area population estimates).