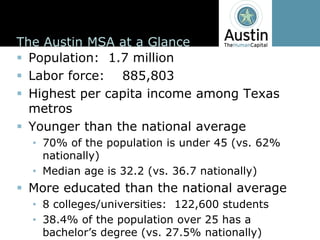
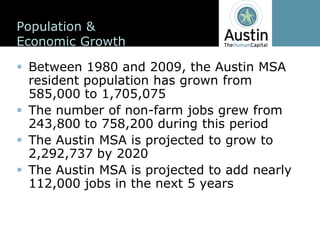
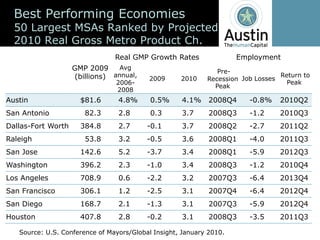
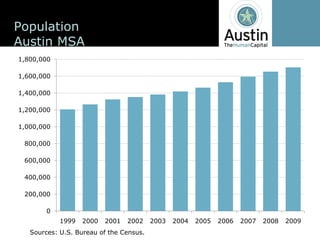
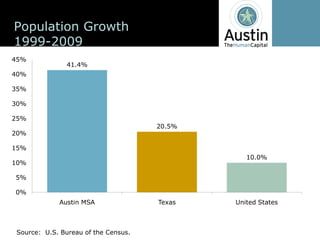
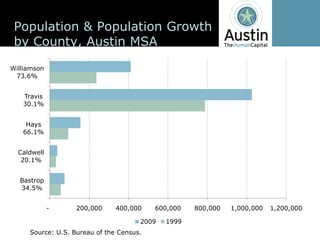
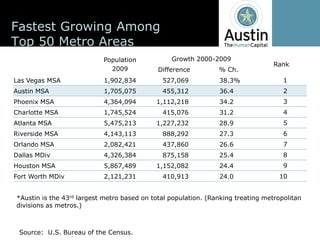
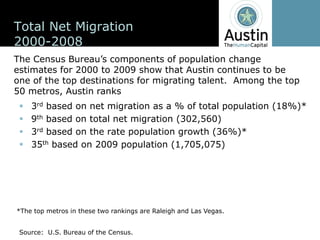
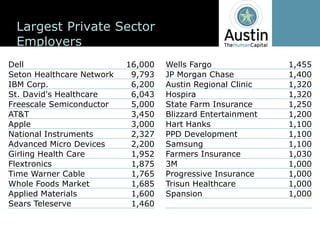
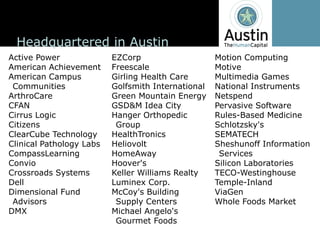
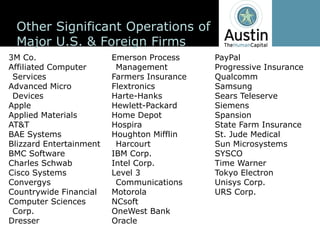
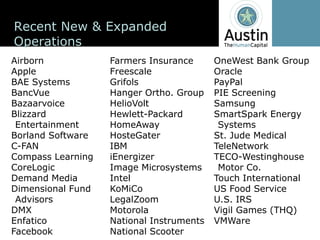
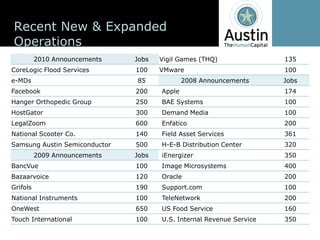
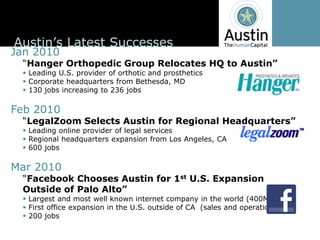
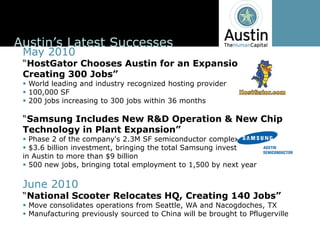
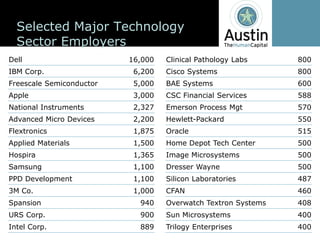
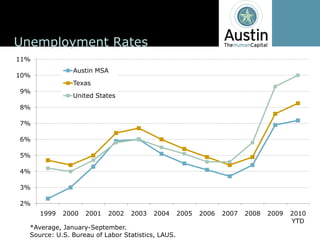
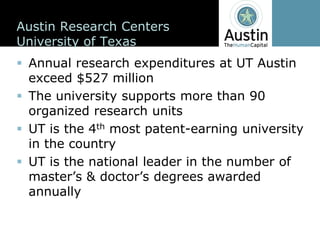
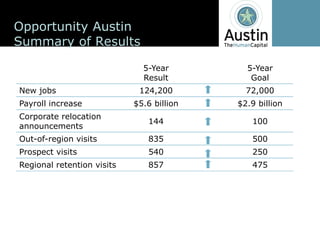
SlideShare a Scribd company logo
1 of 78
Download to read offline
PREPARED  ESPECIALLY  FOR

      KELLER  WILLIAMS


 Greater  Austin  Chamber  of  Commerce
-­County  Region
The  Austin  MSA  at  a  Glance
  Population:    1.7  million
  Labor  force:        885,803      
  Highest  per  capita  income  among  Texas  
  metros
  Younger  than  the  national  average
    70%  of  the  population  is  under  45  (vs.  62%  
    nationally)
    Median  age  is  32.2  (vs.  36.7  nationally)
  More  educated  than  the  national  average
    8  colleges/universities:    122,600  students
    38.4%  of  the  population  over  25  has  a  
Population  &  
Economic  Growth

 Between  1980  and  2009,  the  Austin  MSA  
 resident  population  has  grown  from  
 585,000  to  1,705,075
 The  number  of  non-­farm  jobs  grew  from  
 243,800  to  758,200  during  this  period
 The  Austin  MSA  is  projected  to  grow  to  
 2,292,737  by  2020
 The  Austin  MSA  is  projected  to  add  nearly  
 112,000  jobs  in  the  next  5  years
Economic  Growth  Projections
                                                                       Compound  Annual  
                                      Austin  MSA
                                                                         Growth  Rate
                                  2009             2014           Austin        Texas           U.S.
Real  Gross  Product             $77.49           $98.50
                                                                   4.92%         4.71%          3.37%
(2000  Dollars)                  billion          billion

Population                     1,680,000        1,930,000          2.72          1.75           0.93

Employment                        818,490          922,260         2.42          2.18           1.39

Real  Personal                   $51.14           $65.62
                                                                   5.11          5.09           3.54
Income  (2000  Dollars)          billion          billion
Retail  Sales                    $40.00           $60.85
                                                                   8.75          8.82            NA
(Current  Dollars)               billion          billion
Note:    Perryman  predicts    a  return  to  positive  employment  growth  for  Austin  in  2010.    
While  employment  increased  3%  in  2008,  it  dropped  by  1%  in  2009;;  an  increase  of  2%  
(20,900)  is  expected  for  2010.
Source:  The  Perryman  Group,  January  2010.
Economic  Growth  Projections
Austin  MSA


                                        2009     2010     2011
                                      44,400     51,800   58,600
Population  increase
                                       2.6%       3.0%     3.3%
                                       -­2,600   9,200    17,100
Job  creation
                                       -­0.3%    1.2%      2.2%

Retail  sales                          -­8.5%    2.4%     4.6%


Source:  Angelou  Economics,  January  2010.
Best  Performing  Economies
  50  Largest  MSAs  Ranked  by  Projected  
  2010  Real  Gross  Metro  Product  Ch.
                                   Real  GMP  Growth  Rates                  Employment
                      GMP  2009   Avg                                 Pre-­
                      (billions) annual,       2009       2010     Recession   Job  Losses  
                                                                                             Return  to  
                                    2006-­                                                     Peak
                                                                     Peak  
                                    2008
Austin                  $81.6       4.8%       0.5%       4.1%     2008Q4         -­0.8%     2010Q2
San  Antonio             82.3       2.8        0.3        3.7      2008Q3         -­1.2      2010Q3
Dallas-­Fort  Worth     384.8       2.7       -­0.1       3.7      2008Q2         -­2.7      2011Q2
Raleigh                  53.8       3.2       -­0.5       3.6      2008Q1         -­4.0      2011Q3
San  Jose               142.6       5.2       -­3.7       3.4      2008Q1         -­5.9      2012Q3
Washington              396.2       2.3       -­1.0       3.4      2008Q3         -­1.2      2010Q4
Los  Angeles            708.9       0.6       -­2.2       3.2      2007Q3         -­6.4      2013Q4
San  Francisco          306.1       1.2       -­2.5       3.1      2007Q4         -­6.4      2012Q4
San  Diego              168.7       2.1       -­1.3       3.1      2007Q3         -­5.9      2012Q4
Houston                 407.8       2.8       -­0.2       3.1      2008Q3         -­3.5      2011Q3

   Source:  U.S.  Conference  of  Mayors/Global  Insight,  January  2010.
POPULATION
Population
Austin  MSA
1,800,000

1,600,000

1,400,000

1,200,000

1,000,000

 800,000

 600,000

 400,000

 200,000

        0
             1999    2000    2001   2002      2003   2004   2005   2006   2007   2008   2009
   Sources:  U.S.  Bureau  of  the  Census.
Population  Growth
1999-­2009
45%
                  41.4%
40%

35%

30%

25%
                                            20.5%
20%

15%
                                                       10.0%
10%

5%

0%
               Austin  MSA                  Texas   United  States


Source:    U.S.  Bureau  of  the  Census.
Population  &  Population  Growth  
 by  County,  Austin  MSA

Williamson
 73.6%


   Travis
   30.1%


    Hays
   66.1%


  Caldwell
   20.1%


  Bastrop
  34.5%


             -­      200,000      400,000      600,000     800,000     1,000,000   1,200,000  

                                           2009   1999
     Source:  U.S.  Bureau  of  the  Census.
Fastest  Growing  Among
Top  50  Metro  Areas
                               Population               Growth  2000-­2009
                                                                                             Rank
                                 2009              Difference            %  Ch.
Las  Vegas  MSA                1,902,834            527,069              38.3%                  1
Austin  MSA                    1,705,075            455,312              36.4                   2
Phoenix  MSA                   4,364,094          1,112,218              34.2                   3
Charlotte  MSA                 1,745,524            415,076              31.2                   4
Atlanta  MSA                   5,475,213          1,227,232              28.9                   5
Riverside  MSA                 4,143,113            888,292              27.3                   6
Orlando  MSA                   2,082,421            437,860              26.6                   7
Dallas  MDiv                   4,326,384            875,158              25.4                   8
Houston  MSA                   5,867,489          1,152,082              24.4                   9
Fort  Worth  MDiv              2,121,231            410,913              24.0                  10


*Austin  is  the  43rd largest  metro  based  on  total  population.  (Ranking  treating  metropolitan  
divisions  as  metros.)  


 Source:    U.S.  Bureau  of  the  Census.
Total  Net  Migration
2000-­2008

estimates  for  2000  to  2009  show  that  Austin  continues  to  be  
one  of  the  top  destinations  for  migrating  talent.    Among  the  top  
50  metros,  Austin  ranks
     3rd based  on  net  migration  as  a  %  of  total  population  (18%)*
     9th based  on  total  net  migration  (302,560)
     3rd based  on  the  rate  population  growth  (36%)*
     35th based  on  2009  population  (1,705,075)


*The  top  metros  in  these  two  rankings  are  Raleigh  and  Las  Vegas.


 Source:    U.S.  Bureau  of  the  Census.
EMPLOYERS
Largest  Private  Sector
  Employers
Dell                         16,000     Wells  Fargo                 1,455  
Seton  Healthcare  Network    9,793     JP  Morgan  Chase            1,400  
IBM  Corp.                    6,200     Austin  Regional  Clinic     1,320  
St.  David's  Healthcare      6,043     Hospira                      1,320  
Freescale Semiconductor       5,000     State  Farm  Insurance       1,250  
AT&T                          3,450     Blizzard  Entertainment      1,200  
Apple                         3,000     Hart  Hanks                  1,100  
National  Instruments         2,327     PPD  Development             1,100  
Advanced  Micro  Devices      2,200     Samsung                      1,100  
Girling Health  Care          1,952     Farmers  Insurance           1,030  
Flextronics                   1,875     3M                           1,000  
Time  Warner  Cable           1,765     Progressive  Insurance       1,000  
Whole  Foods  Market          1,685     Trisun Healthcare            1,000  
Applied  Materials            1,600     Spansion                     1,000  
Sears  Teleserve              1,460  
Headquartered  in  Austin
Active  Power               EZCorp                      Motion  Computing
American  Achievement       Freescale                   Motive
American  Campus            Girling Health  Care        Multimedia  Games
 Communities                Golfsmith  International    National  Instruments
ArthroCare                  Green  Mountain  Energy     Netspend
CFAN                        GSD&M  Idea  City           Pervasive  Software
Cirrus  Logic               Hanger  Orthopedic          Rules-­Based  Medicine
Citizens                     Group                      Schlotzsky's
ClearCube Technology        HealthTronics               SEMATECH
Clinical  Pathology  Labs   Heliovolt                   Sheshunoff Information  
CompassLearning             HomeAway                     Services
Convio                      Hoover's                    Silicon  Laboratories
Crossroads  Systems         Keller  Williams  Realty    TECO-­Westinghouse
Dell                        Luminex Corp.               Temple-­Inland
Dimensional  Fund           McCoy's  Building           ViaGen
 Advisors                    Supply  Centers            Whole  Foods  Market
DMX                         Michael  Angelo's  
                             Gourmet  Foods
Other  Significant  Operations  of  
  Major  U.S.  &  Foreign  Firms
3M  Co.                   Emerson  Process      PayPal
Affiliated  Computer       Management           Progressive  Insurance
 Services                 Farmers  Insurance    Qualcomm
Advanced  Micro           Flextronics           Samsung
 Devices                  Harte-­Hanks          Sears  Teleserve
Apple                     Hewlett-­Packard      Siemens
Applied  Materials        Home  Depot           Spansion
AT&T                      Hospira               State  Farm  Insurance  
BAE  Systems              Houghton  Mifflin     St.  Jude  Medical
Blizzard  Entertainment    Harcourt             Sun  Microsystems
BMC  Software             IBM  Corp.            SYSCO
Charles  Schwab           Intel  Corp.          Time  Warner
Cisco  Systems            Level  3              Tokyo  Electron
Convergys                  Communications       Unisys  Corp.
Countrywide  Financial    Motorola              URS  Corp.
Computer  Sciences        NCsoft
 Corp.                    OneWest Bank
Dresser                   Oracle
Recent  New  &  Expanded  
Operations
Airborn               Farmers  Insurance      OneWest Bank  Group
Apple                 Freescale               Oracle
BAE  Systems          Grifols                 PayPal
BancVue               Hanger  Ortho.  Group   PIE  Screening
Bazaarvoice           HelioVolt               Samsung
Blizzard              Hewlett-­Packard        SmartSpark Energy  
 Entertainment        HomeAway                 Systems
Borland  Software     HosteGater              St.  Jude  Medical
C-­FAN                IBM                     TeleNetwork
Compass  Learning     iEnergizer              TECO-­Westinghouse  
CoreLogic             Image  Microsystems      Motor  Co.
Demand  Media         Intel                   Touch  International
Dimensional  Fund     KoMiCo                  US  Food  Service
 Advisors             LegalZoom               U.S.  IRS
DMX                   Motorola                Vigil  Games  (THQ)
Enfatico              National  Instruments   VMWare
Facebook              National  Scooter
Recent  New  &  Expanded  
Operations
          2010  Announcements    Jobs   Vigil  Games  (THQ)               135
CoreLogic Flood  Services        100    VMware                            100
e-­MDs                           85             2008  Announcements       Jobs
Facebook                         200    Apple                             174
Hanger  Orthopedic Group         250    BAE  Systems                      100
HostGator                        300    Demand  Media                     100
LegalZoom                        600    Enfatico                          200
National  Scooter  Co.           140    Field  Asset  Services            361
Samsung  Austin  Semiconductor   500    H-­E-­B  Distribution  Center     320
          2009  Announcements    Jobs   iEnergizer                        350
BancVue                          100    Image  Microsystems               400
Bazaarvoice                      120    Oracle                            200
Grifols                          190    Support.com                       100
National  Instruments            100    TeleNetwork                       200
OneWest                          650    US  Food  Service                 160
Touch  International             100    U.S.  Internal Revenue  Service   350
Jan  2010
   Leading  U.S.  provider  of  orthotic  and  prosthetics
   Corporate  headquarters  from  Bethesda,  MD
   130  jobs  increasing  to  236  jobs

Feb  2010
   LegalZoom Selects  Austin  for  Regional  
   Leading  online  provider  of  legal  services
   Regional  headquarters  expansion  from  Los  Angeles,  CA
   600  jobs

Mar  2010  
   Facebook Chooses  Austin  for  1st U.S.  Expansion  

   Largest  and  most  well  known  internet  company  in  the  world  (400M  users)
   First  office  expansion  in  the  U.S.  outside  of  CA    (sales  and  operations)
   200  jobs  
May  2010
 HostGator Chooses  Austin  for  an  Expansion  

 World  leading  and  industry  recognized  hosting  provider
 100,000  SF
 200  jobs  increasing  to  300  jobs  within  36  months

 Samsung  Includes  New  R&D  Operation  &  New  Chip  

  Phase  2  of  the  company's  2.3M  SF  semiconductor  complex
  $3.6  billion  investment,  bringing  the  total  Samsung  investment  
in  Austin  to  more  than  $9  billion
  500  new  jobs,  bringing  total  employment  to  1,500  by  next  year

June  2010
 Move  consolidates  operations  from  Seattle,  WA  and  Nacogdoches,  TX
 Manufacturing  previously  sourced  to  China  will  be  brought  to  Pflugerville
Selected  Major  Technology  
  Sector  Employers
Dell                       16,000   Clinical  Pathology  Labs    800
IBM  Corp.                  6,200   Cisco  Systems               800
Freescale Semiconductor     5,000   BAE  Systems                 600
Apple                       3,000   CSC  Financial  Services     588
National  Instruments       2,327   Emerson  Process  Mgt        570
Advanced  Micro  Devices    2,200   Hewlett-­Packard             550
Flextronics                 1,875   Oracle                       515
Applied  Materials          1,500   Home  Depot  Tech  Center    500
Hospira                     1,365   Image  Microsystems          500
Samsung                     1,100   Dresser  Wayne               500
PPD  Development            1,100   Silicon  Laboratories        487
3M  Co.                     1,000   CFAN                         460
Spansion                     940    Overwatch Textron  Systems   408
URS  Corp.                   900    Sun  Microsystems            400
Intel  Corp.                 889    Trilogy  Enterprises         400
WORKFORCE
Unemployment  Rates
11%
                 Austin  MSA
10%
                 Texas
9%
                 United  States
8%

7%

6%

5%

4%

3%

2%
      1999   2000    2001    2002     2003    2004       2005   2006   2007   2008   2009   2010  
                                                                                            YTD
  *Average,  January-­September.
  Source:  U.S.  Bureau  of  Labor  Statistics,  LAUS.
Lowest  Unemployment  Rates
Top  50  Metro  Areas
                                      Unemployment  Rate
                                                                           Difference       Rank


Washington  MDiv                     5.6%                6.0%                 0.4             1

Minneapolis  MSA                     7.9                 6.4                 -­1.5            2

Nassau  MDiv                         6.7                 6.6                 -­0.1            3

Austin  MSA                          6.6                 6.9                  0.3             4

San  Antonio  MSA                    6.3                 7.1                  0.8             5

Virginia  Beach  MSA                 6.7                 7.3                  0.6             6

Baltimore  MSA                       7.3                 7.4                  0.1             7

Richmond  MSA                        7.6                 7.6                  0.1             8

Denver  MSA                          8.2                 7.7                 -­0.5            9

Seattle  MDiv                        7.6                 7.9                  0.2            10

 Austin  is  the  39th largest  metro  based  on  total  civilian  labor  force  in  May.

 Source:    U.S.  Bureau  of  Labor  Statistics,  LAUS.
Best  Performing  Among
Top  50  Metro  Areas
                                Non-­farm                               -­
                               payroll  jobs                                                  Rank
                                                    Difference               %  Ch.
Austin  MSA                        767,700            4,000                   0.5%              1
Washington  MDiv                2,412,700            10,800                   0.4               2
Dallas  MDiv                    2,024,700             5,600                   0.3               3
Nassau  MDiv                    1,241,800             2,700                   0.2               4
Boston  MDiv                    1,664,700                -­700               -­0.0              5
Louisville  MSA                    599,600               -­300               -­0.1              6
Baltimore  MSA                  1,282,300                -­900               -­0.1              7
Fort  Worth  MDiv                  853,300           -­2,200                 -­0.3              8
New  York  MDiv                 5,116,800           -­14,300                 -­0.3              9
Pittsburgh  MSA                 1,128,100            -­4,300                 -­0.4             10


 Austin  is  the  42nd largest  metro  based  on  total  non-­farm  payroll  jobs  in  May.

 Source:    U.S.  Bureau  of  Labor  Statistics,  CES.
Employment  by  Industry
  Austin  MSA,  May  2010
            Construction          38,800  

           Manufacturing             46,700  

         Wholesale  trade        36,900  

              Retail  trade                          81,300  

 Transp,  wrhsing,  &  util      12,600  

             Information           18,900  

      Financial  activities         44,500  

Prof  &  business  services                                     105,300  

      Ed  &  hlth  services                            86,100  

    Leisure  &  hospitality                              91,600  

          Other  services       34,000  

             Government                                                     171,000  

    Source:    Texas  Workforce  Commission,  CES.
Employment  by  Industry
Austin  MSA
                     Government                                                             166,400  

                   Other  services               33,200  

            Leisure  &  hospitality                                83,300  

    Education  &  health  services                                 83,300  

       Prof.  &  business  services                                      106,500  

               Financial  activities                   43,700  

                      Information            19,800  

 Transp,  warehousing,  &  utilties         12,800  

                      Retail  trade                                82,000  

                 Wholesale  trade                  38,000  

                                                        48,300                             2009
                   Manufacturing
                                                                                           1999
         Construction  &  nat'l  res               40,800  


                                       -­     40,000        80,000     120,000       160,000     200,000  
   Sources:  Texas  Workforce  Commission,  CES.
EDUCATION
Austin  Metro  Colleges  &  
Universities
Fall  2008  Enrollments
  Four-­Year  Institutions
   The  University  of  Texas,  Austin                                                   49,984
   Texas  State  University,  San  Marcos                                                29,105
                                                                                          5,348
   Southwestern  University,  Georgetown                                                  1,270
   Concordia  University,  Austin                                                         2,260
   Huston-­Tillotson College,  Austin                                                       785
   University  of  Phoenix                                                                  464
   DeVry University                                                                         254
  Community  Colleges
   Austin  Community  College,  Austin                                                  35,798
   Temple  College-­Tayor Center,  Taylor                                                  671
    GRAND  TOTAL*                                                                      129,634
  TOTAL  ENROLLMENTS  WITHIN  100  MILES                                               367,800
*Metro  total  includes  enrollments  for  some  2-­year  proprietary  schools  not  listed  
separately.
Source:    U.S.  National  Center  for  Education  Statistics.
Austin  Research  Centers
University  of  Texas
 Annual  research  expenditures  at  UT  Austin  
 exceed  $527  million
 The  university  supports  more  than  90  
 organized  research  units
 UT  is  the  4th most  patent-­earning  university  
 in  the  country
 UT  is  the  national  leader  in  the  number  of  

 annually  
Additional  Major  Universities  
within  200  Miles  of  Austin
                                                                     Enrollment  
                     School                               Location
                                                                      Fall
Texas  A  &  M  University                    College  Station         48,039  
University  of  Houston                       Houstion                 56,045  
University  of  North  Texas                  Denton                   34,830  
University  of  Texas  at  San  Antonio       San  Antonio             28,413  
University  of  Texas  at  Arlington          Arlington                25,084  
Sam  Houston  State  University               Huntsville               16,662  
University  of  Texas  at  Dallas             Richardson               14,913  
Baylor  University                            Waco                     14,541  
Texas  Woman's  University                    Denton                   12,465  
Stephen  F.  Austin  State  University        Nacogdoches              12,000  
Southern  Methodist  University               Dallas                   10,965  
Tarleton  State  University                   Stephenville              9,633  
Texas  Southern  University                   Houston                   9,102  
Texas  A  &  M  University-­Corpus  Christi   Corpus  Christi           9,007  
Texas  Christian  University                  Fort  Worth               8,696  
Prairie  View  A  &  M  University            Prairie  View             8,203  
OFFICE  &  INDUSTRIAL
    REAL  ESTATE
Real  Estate
 Occupancy  Rates
 Austin  MSA
100%

                                                      Office     Industrial

95%


90%


85%


80%


75%
        1997 1998 1999 2000 2001 2002 2003 2004 2005 2006 2007 2008 2009 2010  
                                                                          Q1
       Source:    Oxford  Commercial.
HOUSING  MARKET
Housing  Units


                                                                    1,000
                                                                             1,500
                                                                                     2,000
                                                                                             2,500
                                                                                                     3,000
                                                                                                                         3,500
                                                                                                                                            4,000


                                                          0
                                                              500
                                             2005  Jan
                                            2005  Mar
                                            2005  May
                                              2005  Jul
                                            2005  Sep
                                                                                                                              Multifamily

                                            2005  Nov
                                                                                                             Single  Family

                                             2006  Jan
                                            2006  Mar
                                            2006  May
                                                                                                                                                    Building  Permits


                                              2006  Jul
                                            2006  Sep


Source:    U.S.  Bureau  of  the  Census.
                                            2006  Nov
                                             2007  Jan
                                            2007  Mar
                                            2007  May
                                              2007  Jul
                                            2007  Sep
                                            2007  Nov
                                                                                                                                                    Housing  Units  Authorized  by  


                                             2008  Jan
                                            2008  Mar
                                            2008  May
                                              2008  Jul
                                            2008  Sep
                                            2008  Nov
                                             2009  Jan
                                            2009  Mar
                                            2009  May
                                              2009  Jul
                                            2009  Sep
                                            2009  Nov
                                             2010  Jan
                                            2010  Mar
                                            2010  May
Growth  Rates:  Housing  Units  
Authorized  by  Building  Permits
30%                                                  28.5%
              Austin  MSA
20%                                          16.5%
              United  States

10%
                                                              3.0%
 0%

                                  -­4.0%
-­10%
                                                                                -­9.4%

-­20%
                                                                     -­19.2%

-­30%     -­25.7%


-­40%              -­35.6%
             2008-­2009           YTD  2009-­2010        -­                -­

 Source:    U.S.  Bureau  of  the  Census.
Valuation  of  New  Housing  Units
           Authorized  by  Building  Permits
           Austin  MSA
           $550

           $500        Monthly  average:  
                       2005         $234M
           $450        2006         $262M  
                       2007         $237M  
           $400        2008         $154M
                       2009         $104M
           $350        2010 YTD     $118M
Millions


           $300

           $250

           $200

           $150

           $100

            $50

             $0
                2004   2004   2005   2005   2006   2006   2007   2007   2008   2008   2009   2009   2010  
                 Jan    Jul    Jan    Jul    Jan    Jul    Jan    Jul    Jan    Jul    Jan    Jul    Jan

           Source:    U.S.  Bureau  of  the  Census.
Growth  Rates:
Valuation  of  Housing  Units  Authorized  
by  Building  Permits
80%

                                                         61.3%
60%


40%
                                             25.2%
                                  19.3%
20%
                                                                      10.1%

 0%

                                                                              -­6.8% -­7.3%
-­20%


-­40%     -­32.1%-­32.6%
             2008-­2009           YTD  2009-­2010                -­                -­
                                    Austin  MSA      United  States

 Source:    U.S.  Bureau  of  the  Census.
Home  Sales
              Austin  MSA  &  U.S.
              35,000                                                                                            8


              30,000                                                                                            7

                                                                                                                6


                                                                                                                    United  States  (Millions)
              25,000
                                                                                                                5
Austin  MSA


              20,000
                                                                                                                4
              15,000
                                                                                                                3
              10,000
                                                                                                                2

               5,000                                                                                            1

                   0                                                                                            0
                       1997 1998 1998 1999 2000 2001 2002 2003 2004 2005 2006 2007 2008 2009

                                                Austin  MSA        United  States
                 Source:    Real  Estate  Center  at  Texas  A+M  University  &  National  Association  of  Realtors.
Home  Sales
Austin  MSA
            2007-­2008:  Austin  down  20%  &  national  down  13%
            2008-­2009:  Austin  down  7%  &  national  down  5%
                   -­
3,500

3,000

2,500

2,000

1,500

1,000

  500

    0


Source:    Real  Estate  Center  at  Texas  A&M  University.
Year-­Over-­Year  %  Ch.  in  
 Home  Sales
60%


40%


20%


 0%


-­20%


-­40%


                            Austin  MSA           Texas          United  States

   Source:    Real  Estate  Center  at  Texas  A&M  University  &  National  Association  of  Realtors.
Months  Inventory  of  Homes  on  
the  Market
12
11
10
 9
 8
 7
 6
 5
 4
 3
 2
 1
 0


                              Austin  MSA         Texas         United  States
     Source:  Real  Estate  Center  at  Texas  A&M  University  &  National  Association  of  Realtors.
Median  Home  Prices
Existing  Homes
$200,000

$195,000
                                                                                               $189,300
$190,000

$185,000
                                                                                               $179,600
$180,000

$175,000

$170,000

$165,000

$160,000


                                   Austin  MSA                         United  States

  Source:    Real  Estate  Center  at  Texas  A&M  University  &  National  Association  of  Realtors.
Growth  Rates:
Median  Home  Price
  6%
                                                                                              4.2%
  4%
                                                             2.7%              2.3%
  2%

  0%

 -­2%         -­1.2%
                                              -­2.1%
 -­4%

 -­6%

 -­8%                                                        2009  Median  Home  Prices:
                                                              Austin  MSA        $186,000
-­10%                                                         United  States     $172,500

-­12%

-­14%                     -­12.9%
                  2008-­2009                            -­                               -­
                                Austin  MSA                          United  States

Source:    Real  Estate  Center  at  Texas  A&M  University  &  National  Association  of  Realtors.
Home  Sales  &  Prices
        Austin  MSA
        35,000                                                                            $250,000


        30,000
                                                                                          $200,000
        25,000

                                                                                          $150,000
        20,000
Sales


                                                                                                     Price
        15,000
                                                                                          $100,000

        10,000
                                                                                          $50,000
         5,000


             0                                                                            $0
                 1997 1998 1999 2000 2001 2002 2003 2004 2005 2006 2007 2008 2009

                                Home  Sales         Average  Price        Median  Price
           Source:    Real  Estate  Center  at  Texas  A+M  University.
Home  Sales  &  Prices
        Austin  MSA
        32,000                                                                            $250,000

        28,000
                                                                                          $200,000
        24,000

        20,000
                                                                                          $150,000
Sales


                                                                                                     Price
        16,000

                                                                                          $100,000
        12,000

         8,000
                                                                                          $50,000
         4,000

             0                                                                            $0


                                Home  Sales         Average  Price        Median  Price
           Source:    Real  Estate  Center  at  Texas  A+M  University.
Median  Home  Prices
New  &  Existing  Homes
$250,000
                      Austin  MSA
$230,000
                      United  States
$210,000

$190,000

$170,000

$150,000

$130,000

$110,000

 $90,000


  Source:    National  Association  of  Home  Builders.
Average  Home  Prices  2009

                  $0           $250,000           $500,000           $750,000         $1,000,000         $1,250,000


        Atlanta
                                                      The  subject  home  is  a  single-­family  
         Austin                                       dwelling,  2,200  sq.  ft.,  4  bedrooms,  2  1/2  
                                                      baths,  family  room,  &  2-­car  garage  in  
                                                      neighborhoods  within  a  market  that  is  
     Chicago*                                         typical  for  corporate  middle-­management  
                                                      transferees.

      Denver*


 Los  Angeles*


    New  York*


San  Francisco*


 United  States

    Source:    Coldwell  Banker.                        *Unweighted average  of  multiple  reported  submarkets.  
Average  Apartment  Rents
2010  Q1
                                             1  bedroom   2  bedrooms   3  bedrooms
Austin  MSA                                        $688          $886        $1,169
Travis  County                                      696           911         1,233
  Downtown                                        1,445         2,320         3,929
  Central  Austin                                   920         1,262         1,944
  North                                             553           688           878
  Northwest  Hills                                  708           953         1,326
  Far  Northwest                                    693           904         1,213
  Northeast                                         618           780         1,023
  Far  Northeast                                    668           876         1,095
  South                                             683           854         1,055
  Southeast                                         579           740         1,036
  Southwest                                         787         1,028         1,262
Cedar  Park/Leander  (Williamson  County)           670           843         1,078
Round  Rock  (Williamson  County)                   650           826         1,036
Northwest  (Williamson  &  Travis  Cos.)            655           851         1,081
Balance  of  Williamson  County                     672           828         1,048
Bastrop  County                                     639           714           977
San  Marcos  (Hays  County)                         675           777         1,047
 Source:    Austin  Investor  Interests.  
Average  Apartment  Rents
   2-­bedroom  Units,  2010  Q1
                                    $-­          $500       $1,000        $1,500     $2,000     $2,500  

                     Austin  MSA                               $886  
                   Travis  County                               $911  
     Central  Business  District                                                                $2,320  
                  Central  Austin                                        $1,262  
                            North                         $688  
                 Northwest  Hills                                $953  
                  Far  Northwest                                $904  
                        Northeast                           $780  
                   Far  Northeast                              $876  
                            South                             $854  
                       Southeast                           $740  
                      Southwest                                    $1,028  
          Cedar  Park/Leander                                $843  
                     Round  Rock                             $826  
                       Northwest                              $851  
Balance  of  Williamson  County                              $828  
                Bastrop  County                           $714  
                     San  Marcos                            $777  

     Source:    Austin  Investor  Interests.  
Downtown  Condominiums
                                                                           Sales  
                      Active                    Average       Median                    Sold  to  
                                     Sales                               price  per  
                     listings                  sales  price sales  price              list  price
                                                                             SF
Jan.-­Apr. 2009         188           20       $351,670        $281,850          $296            92%
Jan.-­Apr.  2010        175           47       $361,106        $290,000          $299            94%


Note:  The  Downtown  submarket  is  MLK  Blvd.  to  I-­35  to  the  Colorado  River  to  Lamar  Blvd.  to  
MLK  Blvd.  This  residential  submarket  is  almost  exclusively  condo.    Market-­wide  the  average  
price  of  a  condo  is  $172,585  and  the  median  price  is  $152,650.  
Source:    Austin  Board  of  Realtors.  
COST  OF  LIVING
Cost  of  Living  Index  2009
                       0    25      50       75     100        125   150   175   200   225


       Atlanta  MSA


        Austin  MSA


      Chicago  MDiv


       Denver  MSA


 Los  Angeles  MDiv


   NY  (Manhattan)


San  Francisco  MDiv


      United  States


  Source:    Council  for  Community  &  Economic  Research.
RETAIL  SALES
Sales  &  Use  Tax  Comparison:  20  Largest  Cities
                      2010  May        %  Ch  from  last  yr       2010  YTD   %  Ch  from  last  yr
Austin               13,610,355               12.2%             58,652,568               5.6%
El  Paso              6,593,737                 9.8             29,267,088               4.7
Mesquite              3,621,338               11.0              14,688,088               4.4
Round  Rock           5,610,817                 9.0             26,020,736               4.1
Frisco                4,017,244               16.6              16,850,224               4.1
Arlington             8,566,495               11.5              34,775,228               3.7
Plano                 6,170,554               12.3              25,337,490               2.8
McAllen               5,256,876                 7.9             24,789,569               1.0
San  Antonio         21,004,722                 6.3             87,625,660             -­0.1
Lubbock               5,078,118                 6.6             21,184,555             -­0.4
Grand  Prairie        3,571,180               -­0.3             14,797,957             -­2.2
Amarillo              5,777,874                 7.7             23,966,017             -­2.3
Fort  Worth           9,951,915                 0.2             41,638,585             -­2.7
Dallas               21,053,620                 4.2             87,218,074             -­4.8
Irving                4,868,669                 4.7             18,877,341             -­5.4
Sugar  Land           3,510,812               -­6.2             16,353,779             -­5.9
Tyler                 3,223,569               -­2.2             14,491,859             -­6.0
Corpus  Christi       5,390,957                 1.1             23,725,667             -­8.6
Houston              47,419,146                 3.8            200,202,049             -­9.3
Midland               3,423,685                 7.2             14,452,141           -­10.1
All  Texas  Cities                              4.6                                    -­4.4

                                  Source:    Texas  Comptroller.
Sales  Tax  Allocations
                                                                  ons
           $400
                     City  of  San  Marcos
           $350      City  of  Round  Rock
                     Austin  MTA
           $300      City  of  Austin


           $250
Millions


           $200


           $150


           $100


           $50


            $0
                  1999    2000    2001       2002   2003   2004   2005   2006   2007   2008   2009
             Source:  Texas  Comptroller.
Sales  Tax  Allocations
     City  of  Austin
           $150


           $125


           $100
Millions


           $75


           $50


           $25


            $0
                  1999    2000    2001      2002   2003   2004   2005   2006   2007   2008   2009
             Source:  Texas  Comptroller.
RATINGS  &  RANKINGS
Austin  in  the  News  
Business  Rankings
  Austin  in  Top  10  of  Forbes
  Careers.  (Forbes,  4/14/10)
  Texas  No.  1  among  States  that  are  Very  Friendly  to  Small  
  Businesses.  (Open  Forum,  4/6/10)
  Austin  metro  rated  Best  Place  for  Creation  &  Development  of  Small  
  Businesses.  (Portfolio.com,  1/18/10)
  Austin  is  home  to  the  No.  3  Cleantech University.    (The  Cleantech
  Group,  1/4/10)
  Austin  No.  2  Strongest  Metro  Economy.  (Business  Week,  10/26/09)
  Austin  named  one  of  79  metros  Where  the  Recession  has  Ended.
  (Moody's  Economy.com  &  msnbc.com.,  10/15/09)
  Austin  a  Top  10  Start-­Up  City.  (Entrepreneur, 8/09)
  Austin  is  the  3rd  Strongest  Metro  Economy  in  the  Country.
  (Brookings  Institution,  6/16/09)
  Texas  Ranked  No.  1  For  Business.
  (Directorship,  6/1/09)
  Austin  in  the  Top  20  High  Tech  Metropolitan  Areas.  (Milken  Institute,  
  6/2/09)
  Austin  is  a  City  of  the  Future.  (fDi Magazine
  Texas  voted  Best  for  Business.  (Chief  Executive,  3/25/09)
Austin  in  the  News  
Quality  of  Life  Rankings
  Austin  is  the  No.  1  Place  for  Young  Adults.  (portfolio.com/bizjournals,  
  3/15/10)
  Austin  is  the  Healthiest  Housing  Market  for  2010.  (Builder,  2/25/10)
  Austin  named  the  Top  City  for  Your  Career.  (Sales  HQ,  8/25/09)
  Austin  No.  2  Best  City  for  Working  Moms.  (Forbes,  8/4/09)
  Austin  is  2nd most  affordable  city  in  Forbes
  (Forbes,  6/29/09)
  Austin  one  of  U.S.  News                                 (USNews.com,  6/8/09)
  Austin  ranks  9th on  American  Fitness  Index.  (American  College  Sports  
  Medicine,  5/26/09)
  Austin  the  Best  City  for  a  Fresh  Start.  (Relocation.com,  5/21/09)
  Austin  ranked  11th Best  City  for  the  Outdoors.  (Forbes,  5/12/09)
  Austin  Best  Bargain  City  in  the  U.S.  (Forbes,  5/09)
  Austin  one  of  the  10  Best  Cities  of  2009.  (Kiplinger.com,  5/09)
  Austin  no.  1  Big  City  for  Jobs.  (Forbes,  4/12/09)
  Austin  comes  in  2nd in  the  top  10  Cities  Where  Americans  are  
  Relocating.  (Forbes,  3/30/09)
  Austin  one  of  15  Coolest  North  American  Cities.  (MSN  Travel,  1/22/09)
OPPORTUNITY  AUSTIN
Peer  Metros
                              Unemployment                     Nonfarm  Payroll  Jobs
                                  Rate                                           -­
                                May  2010          May  2010
                                                                    Difference          Percent

United  States                      9.3%                                                 -­0.4%

Texas                               8.0                                                   0.2

Austin  MSA                         6.9             767,700            4,000              0.5

Denver  MSA                         7.7            1,181,300         -­24,900            -­2.1%

Nashville  MSA                      9.0             720,800           -­5,500            -­0.8%

Phoenix  MSA                        8.7            1,721,400         -­12,000            -­0.7%

Raleigh  MSA                        8.2             500,600           -­2,900            -­0.6%


 Not  seasonally  adjusted.
 Source:    U.S.  Bureau  of  Labor  Statistics.
Opportunity  Austin
Summary  of  Results

                                5-­Year        5-­Year
                                Result          Goal
New  jobs                      124,200         72,000
Payroll  increase             $5.6 billion   $2.9  billion
Corporate  relocation  
                                 144             100
announcements
Out-­of-­region  visits          835             500
Prospect  visits                 540             250
Regional  retention  visits      857             475
Regional  Issues
       2007  Issues                                                2008  YTD  Issues


       Prop-­                                                             Non-­
        erty        Traffic,                                              stop       Traffic,  
       Taxes,         61,                                                Flights         67,  
         55,         25%                                                    40         29%
        23%                                                               18%
                                                                 Public  
  Public                                                        Transit,  
 Transit,                                                          54,  
    46,                             Tech-­                        24%            Talent,  
                  Talent,  
   19%              78,             nical           Talent,                        65,  
                   33%              Coll-­            19,                         29%
                                    eges,            29%
                                     21,  
                                    31%
                                               Public  
                                              Transit,  
                                                 27,  
                                                40%


                                 2008  YTD  Regional  
                                   Partner  Issues
Opportunity  Austin
5-­Year  Plan

  Program  Goals:
    72,000  net  new  jobs
    $2.9  billion  net  increase  in  payroll
    $14  billion  in  GRP
Opportunity  Austin
Relocations  by  Target  Industry  Sector
2004-­June  2010

        Clean  energy                         9
        Data  center                          6
        Digital  media                       24
        Headquarters/regional office         35
        Life  sciences                       19
        Semiconductor                        14
        Software                             21
        Wireless                              8
        Other  IT                            12
        Other                                30
        TOTAL                               178
Origin  of  Corporate  Relocations
to  the  Austin  Area  Since  2004


                                 Through  December  2009
Opportunity  Austin  2.0
2009-­2013

           MAJOR  GOALS
In  the  next  5  years:
1. Create  a  net  gain  of  more  
   than  117,000  jobs
2.
     total  payroll  by  $10.8  billion
Opportunity  Austin  2.0
Five-­Year  Approved  Budget
$426,878        $100,000  
 2.0%            0.5%          $1,000,000              $21  Million
                                 4.8%
      $483,897                                         Economic  diversification
       2.3%
   $1,362,349                                          Business  retention  &  
     6.5%                                              expansion
   $732,743                                            Education
    3.5%

                                        $8,509,907     Talent  attraction
                                          40.5%
                                                       Improve  transportation  
                                                       system
                $6,272,472  
                  29.9%                                Keeping  Greater  Austin  
                                                       Great
                                                       Investor  relations

                                                       Fundraising  campaign
                                       $2,111,754  
                                         10.1%
Opportunity  Austin  2.0
Comparison  Cities
           $60
                 $60.0

           $50


           $40


           $30
Millions


                         $25.0
           $20                   $22.5   $22.5   $22.0   $21.0
                                                                 $17.0   $17.0
           $10


           $0
Opportunity  Austin  2.0
Economic  Diversification


       Convergence  technologies
       Creative  media


       Green  industries
       Corporate/professional  headquarters  
       &  offices
       Health  care  &  life  sciences
Opportunity  Austin  2.0
Economic  Diversification

  Target  industries
  Convergence  technologies
       Wireless
       Software
       Nanotechnology
       Semiconductors
Opportunity  Austin  2.0
Economic  Diversification

  Target  industries
  Creative  media
       Media  development
       Production
       Distribution
       The  marketing  of:
         Music
         Film
         Television
         Video  game  industries
Opportunity  Austin  2.0
Economic  Diversification

  Target  industries
  Green  industries
       Solar  panels
       Fuel  cells
       Wind  turbines
       Electric  cars
       Clean  energy
       Green  products
Opportunity  Austin  2.0
Economic  Diversification

  Target  industries
  Health  care  &  life  sciences
       Medical  devices
       Bio-­tech
       Bioinformatics
       Bioscience
       Nanoscience
Austin,  Texas
A  Beautiful  Place  to  Live

More Related Content

What's hot

Nz Marine Cluster May 12 Ppt
Nz Marine Cluster May 12 PptNz Marine Cluster May 12 Ppt
Nz Marine Cluster May 12 PptBen Mayson
 
Governor's economic summit 2013 final
Governor's economic summit 2013 finalGovernor's economic summit 2013 final
Governor's economic summit 2013 finalSalt Lake Chamber
 
Dfw Outlook 4 09
Dfw Outlook 4 09Dfw Outlook 4 09
Dfw Outlook 4 09DD Flynn
 
Housing And Labor Market Trends:Nevada
Housing And Labor Market Trends:NevadaHousing And Labor Market Trends:Nevada
Housing And Labor Market Trends:NevadaTodd A. Yankov
 
It's More Fun Investing in the Philippines
It's More Fun Investing in the PhilippinesIt's More Fun Investing in the Philippines
It's More Fun Investing in the PhilippinesAldrin Bibon
 
Opportunities & Challenges for Minorities and Immigrants in the United States...
Opportunities & Challenges for Minorities and Immigrants in the United States...Opportunities & Challenges for Minorities and Immigrants in the United States...
Opportunities & Challenges for Minorities and Immigrants in the United States...Instituto Diáspora Brasil (IDB)
 

What's hot (20)

Dominica - Trade Profile UWI's Shridath Ramphal Centre
Dominica - Trade Profile UWI's Shridath Ramphal CentreDominica - Trade Profile UWI's Shridath Ramphal Centre
Dominica - Trade Profile UWI's Shridath Ramphal Centre
 
Belize - Trade Profile UWI's Shridath Ramphal Centre
Belize -  Trade Profile UWI's Shridath Ramphal CentreBelize -  Trade Profile UWI's Shridath Ramphal Centre
Belize - Trade Profile UWI's Shridath Ramphal Centre
 
Mohr and White - Minimizing unemployment costs
Mohr and White - Minimizing unemployment costs Mohr and White - Minimizing unemployment costs
Mohr and White - Minimizing unemployment costs
 
Dominican Republic -Trade Profile UWI's Shridath Ramphal Centre
Dominican Republic -Trade Profile UWI's Shridath Ramphal CentreDominican Republic -Trade Profile UWI's Shridath Ramphal Centre
Dominican Republic -Trade Profile UWI's Shridath Ramphal Centre
 
Haiti - Trade Profile [UWI's Shridath Ramphal Centre]
Haiti  - Trade Profile [UWI's Shridath Ramphal Centre]Haiti  - Trade Profile [UWI's Shridath Ramphal Centre]
Haiti - Trade Profile [UWI's Shridath Ramphal Centre]
 
Nz Marine Cluster May 12 Ppt
Nz Marine Cluster May 12 PptNz Marine Cluster May 12 Ppt
Nz Marine Cluster May 12 Ppt
 
St. Lucia - Trade Profile [UWI's Shridath Ramphal Centre]
St. Lucia - Trade Profile [UWI's Shridath Ramphal Centre]St. Lucia - Trade Profile [UWI's Shridath Ramphal Centre]
St. Lucia - Trade Profile [UWI's Shridath Ramphal Centre]
 
Anitgua & Barbuda - Trade Profile [UWI's Shridath Ramphal Centre]
Anitgua & Barbuda  - Trade Profile [UWI's Shridath Ramphal Centre]Anitgua & Barbuda  - Trade Profile [UWI's Shridath Ramphal Centre]
Anitgua & Barbuda - Trade Profile [UWI's Shridath Ramphal Centre]
 
Governor's economic summit 2013 final
Governor's economic summit 2013 finalGovernor's economic summit 2013 final
Governor's economic summit 2013 final
 
Dfw Outlook 4 09
Dfw Outlook 4 09Dfw Outlook 4 09
Dfw Outlook 4 09
 
The Bahamas - Trade Profile UWI's Shridath Ramphal Centre
The Bahamas - Trade Profile UWI's Shridath Ramphal CentreThe Bahamas - Trade Profile UWI's Shridath Ramphal Centre
The Bahamas - Trade Profile UWI's Shridath Ramphal Centre
 
Guyana -Trade Profile [UWI's Shridath Ramphal Centre]
Guyana -Trade Profile [UWI's Shridath Ramphal Centre]Guyana -Trade Profile [UWI's Shridath Ramphal Centre]
Guyana -Trade Profile [UWI's Shridath Ramphal Centre]
 
Housing And Labor Market Trends:Nevada
Housing And Labor Market Trends:NevadaHousing And Labor Market Trends:Nevada
Housing And Labor Market Trends:Nevada
 
The Economy: How Are We Really Doing?
The Economy: How Are We Really Doing?The Economy: How Are We Really Doing?
The Economy: How Are We Really Doing?
 
China v2
China v2China v2
China v2
 
SWN Labor Market Analysis 2012
SWN Labor Market Analysis 2012SWN Labor Market Analysis 2012
SWN Labor Market Analysis 2012
 
It's More Fun Investing in the Philippines
It's More Fun Investing in the PhilippinesIt's More Fun Investing in the Philippines
It's More Fun Investing in the Philippines
 
Opportunities & Challenges for Minorities and Immigrants in the United States...
Opportunities & Challenges for Minorities and Immigrants in the United States...Opportunities & Challenges for Minorities and Immigrants in the United States...
Opportunities & Challenges for Minorities and Immigrants in the United States...
 
Bemis mar13brief
Bemis mar13briefBemis mar13brief
Bemis mar13brief
 
St. Kitts & Nevis - Trade Profile [UWI's Shridath Ramphal Centre]
St. Kitts & Nevis -  Trade Profile [UWI's Shridath Ramphal Centre]St. Kitts & Nevis -  Trade Profile [UWI's Shridath Ramphal Centre]
St. Kitts & Nevis - Trade Profile [UWI's Shridath Ramphal Centre]
 

Viewers also liked

10 Insightful Quotes On Designing A Better Customer Experience
10 Insightful Quotes On Designing A Better Customer Experience10 Insightful Quotes On Designing A Better Customer Experience
10 Insightful Quotes On Designing A Better Customer ExperienceYuan Wang
 
Learn BEM: CSS Naming Convention
Learn BEM: CSS Naming ConventionLearn BEM: CSS Naming Convention
Learn BEM: CSS Naming ConventionIn a Rocket
 
How to Build a Dynamic Social Media Plan
How to Build a Dynamic Social Media PlanHow to Build a Dynamic Social Media Plan
How to Build a Dynamic Social Media PlanPost Planner
 
SEO: Getting Personal
SEO: Getting PersonalSEO: Getting Personal
SEO: Getting PersonalKirsty Hulse
 
Lightning Talk #9: How UX and Data Storytelling Can Shape Policy by Mika Aldaba
Lightning Talk #9: How UX and Data Storytelling Can Shape Policy by Mika AldabaLightning Talk #9: How UX and Data Storytelling Can Shape Policy by Mika Aldaba
Lightning Talk #9: How UX and Data Storytelling Can Shape Policy by Mika Aldabaux singapore
 

Viewers also liked (6)

10 Insightful Quotes On Designing A Better Customer Experience
10 Insightful Quotes On Designing A Better Customer Experience10 Insightful Quotes On Designing A Better Customer Experience
10 Insightful Quotes On Designing A Better Customer Experience
 
Learn BEM: CSS Naming Convention
Learn BEM: CSS Naming ConventionLearn BEM: CSS Naming Convention
Learn BEM: CSS Naming Convention
 
How to Build a Dynamic Social Media Plan
How to Build a Dynamic Social Media PlanHow to Build a Dynamic Social Media Plan
How to Build a Dynamic Social Media Plan
 
SEO: Getting Personal
SEO: Getting PersonalSEO: Getting Personal
SEO: Getting Personal
 
Lightning Talk #9: How UX and Data Storytelling Can Shape Policy by Mika Aldaba
Lightning Talk #9: How UX and Data Storytelling Can Shape Policy by Mika AldabaLightning Talk #9: How UX and Data Storytelling Can Shape Policy by Mika Aldaba
Lightning Talk #9: How UX and Data Storytelling Can Shape Policy by Mika Aldaba
 
Succession “Losers”: What Happens to Executives Passed Over for the CEO Job?
Succession “Losers”: What Happens to Executives Passed Over for the CEO Job? Succession “Losers”: What Happens to Executives Passed Over for the CEO Job?
Succession “Losers”: What Happens to Executives Passed Over for the CEO Job?
 

Similar to Austin information

The Changing Demographics of Texas and Their Impact on our Nonprofit Sector
The Changing Demographics of Texas and Their Impact on our Nonprofit SectorThe Changing Demographics of Texas and Their Impact on our Nonprofit Sector
The Changing Demographics of Texas and Their Impact on our Nonprofit SectorGreenlights
 
Austin, TX: An Economic Prospectus
Austin, TX: An Economic ProspectusAustin, TX: An Economic Prospectus
Austin, TX: An Economic ProspectusCivic Analytics LLC
 
Austin, TX: State of the Economy
Austin, TX: State of the EconomyAustin, TX: State of the Economy
Austin, TX: State of the EconomyCivic Analytics LLC
 
Austin, Texas: State of the Economy
Austin, Texas: State of the EconomyAustin, Texas: State of the Economy
Austin, Texas: State of the EconomyCivic Analytics LLC
 
Economic Growth in Central Texas: The Promise and Reality of Prosperity in ou...
Economic Growth in Central Texas: The Promise and Reality of Prosperity in ou...Economic Growth in Central Texas: The Promise and Reality of Prosperity in ou...
Economic Growth in Central Texas: The Promise and Reality of Prosperity in ou...Civic Analytics LLC
 
Austin: Growth, Change & Promise
Austin: Growth, Change & PromiseAustin: Growth, Change & Promise
Austin: Growth, Change & PromiseCivic Analytics LLC
 
2017 Housing Market Forecast - Leslie Appleton Young
2017 Housing Market Forecast - Leslie Appleton Young2017 Housing Market Forecast - Leslie Appleton Young
2017 Housing Market Forecast - Leslie Appleton YoungInman News
 
Joe Salvo Presentation
Joe Salvo PresentationJoe Salvo Presentation
Joe Salvo PresentationAaron Kendall
 
Honors college cuny 01 24-2013
Honors college cuny 01 24-2013Honors college cuny 01 24-2013
Honors college cuny 01 24-2013Joseph Ugoretz
 
Economic Recap Bozeman Chamber of Commerce 2009
Economic Recap Bozeman Chamber of Commerce 2009Economic Recap Bozeman Chamber of Commerce 2009
Economic Recap Bozeman Chamber of Commerce 2009eralandmark
 
Williamson County, Texas: Changing Demographics and Implications of Growth
Williamson County, Texas: Changing Demographics and Implications of GrowthWilliamson County, Texas: Changing Demographics and Implications of Growth
Williamson County, Texas: Changing Demographics and Implications of GrowthCivic Analytics LLC
 
T Mobile Flyer
T Mobile FlyerT Mobile Flyer
T Mobile FlyerJohnluk
 
Panda Express
Panda ExpressPanda Express
Panda ExpressJohnluk
 
July 2012 plsn pdf
July 2012 plsn pdfJuly 2012 plsn pdf
July 2012 plsn pdfPLSN
 

Similar to Austin information (20)

The Changing Demographics of Texas and Their Impact on our Nonprofit Sector
The Changing Demographics of Texas and Their Impact on our Nonprofit SectorThe Changing Demographics of Texas and Their Impact on our Nonprofit Sector
The Changing Demographics of Texas and Their Impact on our Nonprofit Sector
 
Austin, TX: An Economic Prospectus
Austin, TX: An Economic ProspectusAustin, TX: An Economic Prospectus
Austin, TX: An Economic Prospectus
 
Austin, TX: State of the Economy
Austin, TX: State of the EconomyAustin, TX: State of the Economy
Austin, TX: State of the Economy
 
Austin, Texas: State of the Economy
Austin, Texas: State of the EconomyAustin, Texas: State of the Economy
Austin, Texas: State of the Economy
 
Economic Growth in Central Texas: The Promise and Reality of Prosperity in ou...
Economic Growth in Central Texas: The Promise and Reality of Prosperity in ou...Economic Growth in Central Texas: The Promise and Reality of Prosperity in ou...
Economic Growth in Central Texas: The Promise and Reality of Prosperity in ou...
 
Austin: Growth, Change & Promise
Austin: Growth, Change & PromiseAustin: Growth, Change & Promise
Austin: Growth, Change & Promise
 
Outlook 2011
Outlook 2011Outlook 2011
Outlook 2011
 
2017 Housing Market Forecast - Leslie Appleton Young
2017 Housing Market Forecast - Leslie Appleton Young2017 Housing Market Forecast - Leslie Appleton Young
2017 Housing Market Forecast - Leslie Appleton Young
 
Joe Salvo Presentation
Joe Salvo PresentationJoe Salvo Presentation
Joe Salvo Presentation
 
Honors college cuny 01 24-2013
Honors college cuny 01 24-2013Honors college cuny 01 24-2013
Honors college cuny 01 24-2013
 
Economic Recap Bozeman Chamber of Commerce 2009
Economic Recap Bozeman Chamber of Commerce 2009Economic Recap Bozeman Chamber of Commerce 2009
Economic Recap Bozeman Chamber of Commerce 2009
 
Williamson County, Texas: Changing Demographics and Implications of Growth
Williamson County, Texas: Changing Demographics and Implications of GrowthWilliamson County, Texas: Changing Demographics and Implications of Growth
Williamson County, Texas: Changing Demographics and Implications of Growth
 
2011 Benchmark Study
2011 Benchmark Study2011 Benchmark Study
2011 Benchmark Study
 
T Mobile Flyer
T Mobile FlyerT Mobile Flyer
T Mobile Flyer
 
Growing Prosperity in Austin
Growing Prosperity in AustinGrowing Prosperity in Austin
Growing Prosperity in Austin
 
Panda Express
Panda ExpressPanda Express
Panda Express
 
July 2012 plsn pdf
July 2012 plsn pdfJuly 2012 plsn pdf
July 2012 plsn pdf
 
HBA 2016 Housing Forecast
HBA 2016 Housing Forecast HBA 2016 Housing Forecast
HBA 2016 Housing Forecast
 
2013 Economic Forecast
2013 Economic Forecast2013 Economic Forecast
2013 Economic Forecast
 
2010 State of the Community
2010 State of the Community2010 State of the Community
2010 State of the Community
 

Recently uploaded

Rustomjee The Panorama At Pali Hill, Bandra West, Mumbai - Brochure.pdf
Rustomjee The Panorama At Pali Hill, Bandra West, Mumbai - Brochure.pdfRustomjee The Panorama At Pali Hill, Bandra West, Mumbai - Brochure.pdf
Rustomjee The Panorama At Pali Hill, Bandra West, Mumbai - Brochure.pdfmonikasharma630
 
9990771857 Call Girls in Noida Sector 03 Noida (Call Girls) Delhi
9990771857 Call Girls in Noida Sector 03 Noida (Call Girls) Delhi9990771857 Call Girls in Noida Sector 03 Noida (Call Girls) Delhi
9990771857 Call Girls in Noida Sector 03 Noida (Call Girls) Delhidelhimodel235
 
Cashpay_Call Girls In Gaur City Mall Noida ❤️8860477959 Escorts Service In 24...
Cashpay_Call Girls In Gaur City Mall Noida ❤️8860477959 Escorts Service In 24...Cashpay_Call Girls In Gaur City Mall Noida ❤️8860477959 Escorts Service In 24...
Cashpay_Call Girls In Gaur City Mall Noida ❤️8860477959 Escorts Service In 24...lizamodels9
 
Low Rate Call Girls in Tughlakabad Delhi Call 9990771857
Low Rate Call Girls in Tughlakabad Delhi Call 9990771857Low Rate Call Girls in Tughlakabad Delhi Call 9990771857
Low Rate Call Girls in Tughlakabad Delhi Call 9990771857delhimodel235
 
Call Girls in Sarai Kale Khan Delhi 💯Call Us 🔝8264348440🔝
Call Girls in Sarai Kale Khan Delhi 💯Call Us 🔝8264348440🔝Call Girls in Sarai Kale Khan Delhi 💯Call Us 🔝8264348440🔝
Call Girls in Sarai Kale Khan Delhi 💯Call Us 🔝8264348440🔝soniya singh
 
Telibagh & Call Girls Lucknow - 450+ Call Girl Cash Payment 🎂 8923113531 🎪 Ne...
Telibagh & Call Girls Lucknow - 450+ Call Girl Cash Payment 🎂 8923113531 🎪 Ne...Telibagh & Call Girls Lucknow - 450+ Call Girl Cash Payment 🎂 8923113531 🎪 Ne...
Telibagh & Call Girls Lucknow - 450+ Call Girl Cash Payment 🎂 8923113531 🎪 Ne...gurkirankumar98700
 
Call Girls in Pitampura Delhi 💯Call Us 🔝8264348440🔝
Call Girls in Pitampura Delhi 💯Call Us 🔝8264348440🔝Call Girls in Pitampura Delhi 💯Call Us 🔝8264348440🔝
Call Girls in Pitampura Delhi 💯Call Us 🔝8264348440🔝soniya singh
 
83770-87607 ۞Call Girls In Near The Park Hotel (Cp) Delhi
83770-87607 ۞Call Girls In Near The Park Hotel (Cp) Delhi83770-87607 ۞Call Girls In Near The Park Hotel (Cp) Delhi
83770-87607 ۞Call Girls In Near The Park Hotel (Cp) Delhidollysharma2066
 
Call Girls In Mundka Industrial Metro@꧂8447779280 ↬Enjoy ꧂Escort Service in ...
Call Girls In Mundka Industrial Metro@꧂8447779280 ↬Enjoy ꧂Escort Service in  ...Call Girls In Mundka Industrial Metro@꧂8447779280 ↬Enjoy ꧂Escort Service in  ...
Call Girls In Mundka Industrial Metro@꧂8447779280 ↬Enjoy ꧂Escort Service in ...asmaqueen5
 
Call girls in Jeewan Park .Delhi↫8447779280↬ ꧂Escorts Service In Delhi Ncr
Call girls in Jeewan Park .Delhi↫8447779280↬ ꧂Escorts Service In Delhi NcrCall girls in Jeewan Park .Delhi↫8447779280↬ ꧂Escorts Service In Delhi Ncr
Call girls in Jeewan Park .Delhi↫8447779280↬ ꧂Escorts Service In Delhi Ncrasmaqueen5
 
Purva Palm Hills Devanahalli, Bangalore E- Brochure.pdf
Purva Palm Hills Devanahalli, Bangalore E- Brochure.pdfPurva Palm Hills Devanahalli, Bangalore E- Brochure.pdf
Purva Palm Hills Devanahalli, Bangalore E- Brochure.pdffaheemali990101
 
Call Girls In Hari Nagar Dadb Block {8447779280}Hari Nagar {West Delhi Escort...
Call Girls In Hari Nagar Dadb Block {8447779280}Hari Nagar {West Delhi Escort...Call Girls In Hari Nagar Dadb Block {8447779280}Hari Nagar {West Delhi Escort...
Call Girls In Hari Nagar Dadb Block {8447779280}Hari Nagar {West Delhi Escort...asmaqueen5
 
Call Girls in Khan Market 9654467111 ESCORTS SERVICE
Call Girls in Khan Market 9654467111 ESCORTS SERVICECall Girls in Khan Market 9654467111 ESCORTS SERVICE
Call Girls in Khan Market 9654467111 ESCORTS SERVICESapana Sha
 
9711199012 Call {Girls Delhi} Very Low rate Vaishali DownLoad PDF
9711199012 Call {Girls Delhi} Very Low rate Vaishali DownLoad PDF9711199012 Call {Girls Delhi} Very Low rate Vaishali DownLoad PDF
9711199012 Call {Girls Delhi} Very Low rate Vaishali DownLoad PDFMs Riya
 
Call Girls in Noida Sector 11 Noida 💯Call Us 🔝 9582086666 🔝 South Delhi Escor...
Call Girls in Noida Sector 11 Noida 💯Call Us 🔝 9582086666 🔝 South Delhi Escor...Call Girls in Noida Sector 11 Noida 💯Call Us 🔝 9582086666 🔝 South Delhi Escor...
Call Girls in Noida Sector 11 Noida 💯Call Us 🔝 9582086666 🔝 South Delhi Escor...delhimodel235
 
Omaxe Dwarka In Delhi E Brochure Pdf
Omaxe Dwarka In Delhi E Brochure     PdfOmaxe Dwarka In Delhi E Brochure     Pdf
Omaxe Dwarka In Delhi E Brochure Pdfashiyadav24
 
Model Call Girl in Shastri Nagar Delhi reach out to us at 🔝8264348440🔝
Model Call Girl in Shastri Nagar Delhi reach out to us at 🔝8264348440🔝Model Call Girl in Shastri Nagar Delhi reach out to us at 🔝8264348440🔝
Model Call Girl in Shastri Nagar Delhi reach out to us at 🔝8264348440🔝soniya singh
 

Recently uploaded (20)

Rustomjee The Panorama At Pali Hill, Bandra West, Mumbai - Brochure.pdf
Rustomjee The Panorama At Pali Hill, Bandra West, Mumbai - Brochure.pdfRustomjee The Panorama At Pali Hill, Bandra West, Mumbai - Brochure.pdf
Rustomjee The Panorama At Pali Hill, Bandra West, Mumbai - Brochure.pdf
 
Hot call girls in Moti Bagh🔝 9953056974 🔝 escort Service
Hot call girls in Moti Bagh🔝 9953056974 🔝 escort ServiceHot call girls in Moti Bagh🔝 9953056974 🔝 escort Service
Hot call girls in Moti Bagh🔝 9953056974 🔝 escort Service
 
9990771857 Call Girls in Noida Sector 03 Noida (Call Girls) Delhi
9990771857 Call Girls in Noida Sector 03 Noida (Call Girls) Delhi9990771857 Call Girls in Noida Sector 03 Noida (Call Girls) Delhi
9990771857 Call Girls in Noida Sector 03 Noida (Call Girls) Delhi
 
Cashpay_Call Girls In Gaur City Mall Noida ❤️8860477959 Escorts Service In 24...
Cashpay_Call Girls In Gaur City Mall Noida ❤️8860477959 Escorts Service In 24...Cashpay_Call Girls In Gaur City Mall Noida ❤️8860477959 Escorts Service In 24...
Cashpay_Call Girls In Gaur City Mall Noida ❤️8860477959 Escorts Service In 24...
 
Low Rate Call Girls in Tughlakabad Delhi Call 9990771857
Low Rate Call Girls in Tughlakabad Delhi Call 9990771857Low Rate Call Girls in Tughlakabad Delhi Call 9990771857
Low Rate Call Girls in Tughlakabad Delhi Call 9990771857
 
Low Rate Call Girls in Triveni Complex Delhi Call 9873940964
Low Rate Call Girls in Triveni Complex Delhi Call 9873940964Low Rate Call Girls in Triveni Complex Delhi Call 9873940964
Low Rate Call Girls in Triveni Complex Delhi Call 9873940964
 
Call Girls in Sarai Kale Khan Delhi 💯Call Us 🔝8264348440🔝
Call Girls in Sarai Kale Khan Delhi 💯Call Us 🔝8264348440🔝Call Girls in Sarai Kale Khan Delhi 💯Call Us 🔝8264348440🔝
Call Girls in Sarai Kale Khan Delhi 💯Call Us 🔝8264348440🔝
 
Telibagh & Call Girls Lucknow - 450+ Call Girl Cash Payment 🎂 8923113531 🎪 Ne...
Telibagh & Call Girls Lucknow - 450+ Call Girl Cash Payment 🎂 8923113531 🎪 Ne...Telibagh & Call Girls Lucknow - 450+ Call Girl Cash Payment 🎂 8923113531 🎪 Ne...
Telibagh & Call Girls Lucknow - 450+ Call Girl Cash Payment 🎂 8923113531 🎪 Ne...
 
Call Girls in Pitampura Delhi 💯Call Us 🔝8264348440🔝
Call Girls in Pitampura Delhi 💯Call Us 🔝8264348440🔝Call Girls in Pitampura Delhi 💯Call Us 🔝8264348440🔝
Call Girls in Pitampura Delhi 💯Call Us 🔝8264348440🔝
 
Call Girls in Mahavir Nagar whatsaap call US +919953056974
Call Girls in Mahavir Nagar  whatsaap call US  +919953056974Call Girls in Mahavir Nagar  whatsaap call US  +919953056974
Call Girls in Mahavir Nagar whatsaap call US +919953056974
 
83770-87607 ۞Call Girls In Near The Park Hotel (Cp) Delhi
83770-87607 ۞Call Girls In Near The Park Hotel (Cp) Delhi83770-87607 ۞Call Girls In Near The Park Hotel (Cp) Delhi
83770-87607 ۞Call Girls In Near The Park Hotel (Cp) Delhi
 
Call Girls In Mundka Industrial Metro@꧂8447779280 ↬Enjoy ꧂Escort Service in ...
Call Girls In Mundka Industrial Metro@꧂8447779280 ↬Enjoy ꧂Escort Service in  ...Call Girls In Mundka Industrial Metro@꧂8447779280 ↬Enjoy ꧂Escort Service in  ...
Call Girls In Mundka Industrial Metro@꧂8447779280 ↬Enjoy ꧂Escort Service in ...
 
Call girls in Jeewan Park .Delhi↫8447779280↬ ꧂Escorts Service In Delhi Ncr
Call girls in Jeewan Park .Delhi↫8447779280↬ ꧂Escorts Service In Delhi NcrCall girls in Jeewan Park .Delhi↫8447779280↬ ꧂Escorts Service In Delhi Ncr
Call girls in Jeewan Park .Delhi↫8447779280↬ ꧂Escorts Service In Delhi Ncr
 
Purva Palm Hills Devanahalli, Bangalore E- Brochure.pdf
Purva Palm Hills Devanahalli, Bangalore E- Brochure.pdfPurva Palm Hills Devanahalli, Bangalore E- Brochure.pdf
Purva Palm Hills Devanahalli, Bangalore E- Brochure.pdf
 
Call Girls In Hari Nagar Dadb Block {8447779280}Hari Nagar {West Delhi Escort...
Call Girls In Hari Nagar Dadb Block {8447779280}Hari Nagar {West Delhi Escort...Call Girls In Hari Nagar Dadb Block {8447779280}Hari Nagar {West Delhi Escort...
Call Girls In Hari Nagar Dadb Block {8447779280}Hari Nagar {West Delhi Escort...
 
Call Girls in Khan Market 9654467111 ESCORTS SERVICE
Call Girls in Khan Market 9654467111 ESCORTS SERVICECall Girls in Khan Market 9654467111 ESCORTS SERVICE
Call Girls in Khan Market 9654467111 ESCORTS SERVICE
 
9711199012 Call {Girls Delhi} Very Low rate Vaishali DownLoad PDF
9711199012 Call {Girls Delhi} Very Low rate Vaishali DownLoad PDF9711199012 Call {Girls Delhi} Very Low rate Vaishali DownLoad PDF
9711199012 Call {Girls Delhi} Very Low rate Vaishali DownLoad PDF
 
Call Girls in Noida Sector 11 Noida 💯Call Us 🔝 9582086666 🔝 South Delhi Escor...
Call Girls in Noida Sector 11 Noida 💯Call Us 🔝 9582086666 🔝 South Delhi Escor...Call Girls in Noida Sector 11 Noida 💯Call Us 🔝 9582086666 🔝 South Delhi Escor...
Call Girls in Noida Sector 11 Noida 💯Call Us 🔝 9582086666 🔝 South Delhi Escor...
 
Omaxe Dwarka In Delhi E Brochure Pdf
Omaxe Dwarka In Delhi E Brochure     PdfOmaxe Dwarka In Delhi E Brochure     Pdf
Omaxe Dwarka In Delhi E Brochure Pdf
 
Model Call Girl in Shastri Nagar Delhi reach out to us at 🔝8264348440🔝
Model Call Girl in Shastri Nagar Delhi reach out to us at 🔝8264348440🔝Model Call Girl in Shastri Nagar Delhi reach out to us at 🔝8264348440🔝
Model Call Girl in Shastri Nagar Delhi reach out to us at 🔝8264348440🔝
 

Austin information

  • 1.
  • 2. PREPARED  ESPECIALLY  FOR KELLER  WILLIAMS Greater  Austin  Chamber  of  Commerce
  • 4. The  Austin  MSA  at  a  Glance Population:    1.7  million Labor  force:        885,803       Highest  per  capita  income  among  Texas   metros Younger  than  the  national  average 70%  of  the  population  is  under  45  (vs.  62%   nationally) Median  age  is  32.2  (vs.  36.7  nationally) More  educated  than  the  national  average 8  colleges/universities:    122,600  students 38.4%  of  the  population  over  25  has  a  
  • 5. Population  &   Economic  Growth Between  1980  and  2009,  the  Austin  MSA   resident  population  has  grown  from   585,000  to  1,705,075 The  number  of  non-­farm  jobs  grew  from   243,800  to  758,200  during  this  period The  Austin  MSA  is  projected  to  grow  to   2,292,737  by  2020 The  Austin  MSA  is  projected  to  add  nearly   112,000  jobs  in  the  next  5  years
  • 6. Economic  Growth  Projections Compound  Annual   Austin  MSA Growth  Rate 2009 2014 Austin Texas U.S. Real  Gross  Product $77.49 $98.50 4.92% 4.71% 3.37% (2000  Dollars) billion billion Population 1,680,000 1,930,000 2.72 1.75 0.93 Employment 818,490 922,260 2.42 2.18 1.39 Real  Personal   $51.14 $65.62 5.11 5.09 3.54 Income  (2000  Dollars) billion billion Retail  Sales $40.00 $60.85 8.75 8.82 NA (Current  Dollars) billion billion Note:    Perryman  predicts    a  return  to  positive  employment  growth  for  Austin  in  2010.     While  employment  increased  3%  in  2008,  it  dropped  by  1%  in  2009;;  an  increase  of  2%   (20,900)  is  expected  for  2010. Source:  The  Perryman  Group,  January  2010.
  • 7. Economic  Growth  Projections Austin  MSA 2009 2010 2011 44,400 51,800 58,600 Population  increase 2.6% 3.0% 3.3% -­2,600 9,200 17,100 Job  creation -­0.3% 1.2% 2.2% Retail  sales -­8.5% 2.4% 4.6% Source:  Angelou  Economics,  January  2010.
  • 8. Best  Performing  Economies 50  Largest  MSAs  Ranked  by  Projected   2010  Real  Gross  Metro  Product  Ch. Real  GMP  Growth  Rates   Employment GMP  2009   Avg Pre-­ (billions) annual,   2009 2010 Recession   Job  Losses   Return  to   2006-­ Peak Peak   2008 Austin $81.6 4.8% 0.5% 4.1% 2008Q4 -­0.8% 2010Q2 San  Antonio 82.3 2.8 0.3 3.7 2008Q3 -­1.2 2010Q3 Dallas-­Fort  Worth 384.8 2.7 -­0.1 3.7 2008Q2 -­2.7 2011Q2 Raleigh 53.8 3.2 -­0.5 3.6 2008Q1 -­4.0 2011Q3 San  Jose 142.6 5.2 -­3.7 3.4 2008Q1 -­5.9 2012Q3 Washington 396.2 2.3 -­1.0 3.4 2008Q3 -­1.2 2010Q4 Los  Angeles 708.9 0.6 -­2.2 3.2 2007Q3 -­6.4 2013Q4 San  Francisco 306.1 1.2 -­2.5 3.1 2007Q4 -­6.4 2012Q4 San  Diego 168.7 2.1 -­1.3 3.1 2007Q3 -­5.9 2012Q4 Houston 407.8 2.8 -­0.2 3.1 2008Q3 -­3.5 2011Q3 Source:  U.S.  Conference  of  Mayors/Global  Insight,  January  2010.
  • 10. Population Austin  MSA 1,800,000 1,600,000 1,400,000 1,200,000 1,000,000 800,000 600,000 400,000 200,000 0 1999 2000 2001 2002 2003 2004 2005 2006 2007 2008 2009 Sources:  U.S.  Bureau  of  the  Census.
  • 11. Population  Growth 1999-­2009 45% 41.4% 40% 35% 30% 25% 20.5% 20% 15% 10.0% 10% 5% 0% Austin  MSA Texas United  States Source:    U.S.  Bureau  of  the  Census.
  • 12. Population  &  Population  Growth   by  County,  Austin  MSA Williamson 73.6% Travis 30.1% Hays 66.1% Caldwell 20.1% Bastrop 34.5% -­ 200,000   400,000   600,000   800,000   1,000,000   1,200,000   2009 1999 Source:  U.S.  Bureau  of  the  Census.
  • 13. Fastest  Growing  Among Top  50  Metro  Areas Population Growth  2000-­2009 Rank 2009 Difference %  Ch. Las  Vegas  MSA 1,902,834 527,069 38.3% 1 Austin  MSA 1,705,075 455,312 36.4 2 Phoenix  MSA 4,364,094 1,112,218 34.2 3 Charlotte  MSA 1,745,524 415,076 31.2 4 Atlanta  MSA 5,475,213 1,227,232 28.9 5 Riverside  MSA 4,143,113 888,292 27.3 6 Orlando  MSA 2,082,421 437,860 26.6 7 Dallas  MDiv 4,326,384 875,158 25.4 8 Houston  MSA 5,867,489 1,152,082 24.4 9 Fort  Worth  MDiv 2,121,231 410,913 24.0 10 *Austin  is  the  43rd largest  metro  based  on  total  population.  (Ranking  treating  metropolitan   divisions  as  metros.)   Source:    U.S.  Bureau  of  the  Census.
  • 14. Total  Net  Migration 2000-­2008 estimates  for  2000  to  2009  show  that  Austin  continues  to  be   one  of  the  top  destinations  for  migrating  talent.    Among  the  top   50  metros,  Austin  ranks 3rd based  on  net  migration  as  a  %  of  total  population  (18%)* 9th based  on  total  net  migration  (302,560) 3rd based  on  the  rate  population  growth  (36%)* 35th based  on  2009  population  (1,705,075) *The  top  metros  in  these  two  rankings  are  Raleigh  and  Las  Vegas. Source:    U.S.  Bureau  of  the  Census.
  • 16. Largest  Private  Sector Employers Dell 16,000   Wells  Fargo   1,455   Seton  Healthcare  Network 9,793   JP  Morgan  Chase   1,400   IBM  Corp. 6,200   Austin  Regional  Clinic   1,320   St.  David's  Healthcare   6,043   Hospira   1,320   Freescale Semiconductor 5,000   State  Farm  Insurance   1,250   AT&T 3,450   Blizzard  Entertainment   1,200   Apple 3,000   Hart  Hanks   1,100   National  Instruments 2,327   PPD  Development   1,100   Advanced  Micro  Devices 2,200   Samsung   1,100   Girling Health  Care 1,952   Farmers  Insurance   1,030   Flextronics   1,875   3M   1,000   Time  Warner  Cable   1,765   Progressive  Insurance   1,000   Whole  Foods  Market 1,685   Trisun Healthcare   1,000   Applied  Materials 1,600   Spansion 1,000   Sears  Teleserve   1,460  
  • 17. Headquartered  in  Austin Active  Power EZCorp Motion  Computing American  Achievement Freescale Motive American  Campus   Girling Health  Care Multimedia  Games Communities Golfsmith  International National  Instruments ArthroCare Green  Mountain  Energy   Netspend CFAN GSD&M  Idea  City Pervasive  Software Cirrus  Logic Hanger  Orthopedic   Rules-­Based  Medicine Citizens Group Schlotzsky's ClearCube Technology HealthTronics SEMATECH Clinical  Pathology  Labs Heliovolt Sheshunoff Information   CompassLearning HomeAway Services Convio Hoover's Silicon  Laboratories Crossroads  Systems Keller  Williams  Realty TECO-­Westinghouse Dell Luminex Corp. Temple-­Inland Dimensional  Fund   McCoy's  Building   ViaGen Advisors Supply  Centers Whole  Foods  Market DMX Michael  Angelo's   Gourmet  Foods
  • 18. Other  Significant  Operations  of   Major  U.S.  &  Foreign  Firms 3M  Co. Emerson  Process   PayPal Affiliated  Computer   Management Progressive  Insurance Services Farmers  Insurance Qualcomm Advanced  Micro   Flextronics Samsung Devices Harte-­Hanks Sears  Teleserve Apple Hewlett-­Packard Siemens Applied  Materials Home  Depot Spansion AT&T Hospira State  Farm  Insurance   BAE  Systems Houghton  Mifflin   St.  Jude  Medical Blizzard  Entertainment Harcourt Sun  Microsystems BMC  Software IBM  Corp. SYSCO Charles  Schwab Intel  Corp. Time  Warner Cisco  Systems Level  3   Tokyo  Electron Convergys Communications Unisys  Corp. Countrywide  Financial Motorola URS  Corp. Computer  Sciences   NCsoft Corp. OneWest Bank Dresser   Oracle
  • 19. Recent  New  &  Expanded   Operations Airborn Farmers  Insurance OneWest Bank  Group Apple Freescale Oracle BAE  Systems Grifols PayPal BancVue Hanger  Ortho.  Group PIE  Screening Bazaarvoice HelioVolt Samsung Blizzard   Hewlett-­Packard SmartSpark Energy   Entertainment HomeAway Systems Borland  Software HosteGater St.  Jude  Medical C-­FAN IBM TeleNetwork Compass  Learning iEnergizer TECO-­Westinghouse   CoreLogic Image  Microsystems Motor  Co. Demand  Media Intel Touch  International Dimensional  Fund   KoMiCo US  Food  Service Advisors LegalZoom U.S.  IRS DMX Motorola Vigil  Games  (THQ) Enfatico National  Instruments VMWare Facebook National  Scooter
  • 20. Recent  New  &  Expanded   Operations 2010  Announcements Jobs Vigil  Games  (THQ) 135 CoreLogic Flood  Services 100 VMware   100 e-­MDs 85 2008  Announcements Jobs Facebook 200 Apple 174 Hanger  Orthopedic Group 250 BAE  Systems 100 HostGator 300 Demand  Media 100 LegalZoom 600 Enfatico 200 National  Scooter  Co. 140 Field  Asset  Services 361 Samsung  Austin  Semiconductor 500 H-­E-­B  Distribution  Center 320 2009  Announcements Jobs iEnergizer 350 BancVue 100 Image  Microsystems 400 Bazaarvoice 120 Oracle 200 Grifols 190 Support.com 100 National  Instruments 100 TeleNetwork 200 OneWest 650 US  Food  Service 160 Touch  International 100 U.S.  Internal Revenue  Service 350
  • 21. Jan  2010 Leading  U.S.  provider  of  orthotic  and  prosthetics Corporate  headquarters  from  Bethesda,  MD 130  jobs  increasing  to  236  jobs Feb  2010 LegalZoom Selects  Austin  for  Regional   Leading  online  provider  of  legal  services Regional  headquarters  expansion  from  Los  Angeles,  CA 600  jobs Mar  2010   Facebook Chooses  Austin  for  1st U.S.  Expansion   Largest  and  most  well  known  internet  company  in  the  world  (400M  users) First  office  expansion  in  the  U.S.  outside  of  CA    (sales  and  operations) 200  jobs  
  • 22. May  2010 HostGator Chooses  Austin  for  an  Expansion   World  leading  and  industry  recognized  hosting  provider 100,000  SF 200  jobs  increasing  to  300  jobs  within  36  months Samsung  Includes  New  R&D  Operation  &  New  Chip   Phase  2  of  the  company's  2.3M  SF  semiconductor  complex $3.6  billion  investment,  bringing  the  total  Samsung  investment   in  Austin  to  more  than  $9  billion 500  new  jobs,  bringing  total  employment  to  1,500  by  next  year June  2010 Move  consolidates  operations  from  Seattle,  WA  and  Nacogdoches,  TX Manufacturing  previously  sourced  to  China  will  be  brought  to  Pflugerville
  • 23. Selected  Major  Technology   Sector  Employers Dell 16,000 Clinical  Pathology  Labs 800 IBM  Corp. 6,200 Cisco  Systems 800 Freescale Semiconductor 5,000 BAE  Systems 600 Apple 3,000 CSC  Financial  Services 588 National  Instruments 2,327 Emerson  Process  Mgt 570 Advanced  Micro  Devices 2,200 Hewlett-­Packard 550 Flextronics 1,875 Oracle 515 Applied  Materials 1,500 Home  Depot  Tech  Center 500 Hospira 1,365 Image  Microsystems 500 Samsung 1,100 Dresser  Wayne 500 PPD  Development 1,100 Silicon  Laboratories 487 3M  Co. 1,000 CFAN 460 Spansion 940 Overwatch Textron  Systems 408 URS  Corp. 900 Sun  Microsystems 400 Intel  Corp. 889 Trilogy  Enterprises 400
  • 25. Unemployment  Rates 11% Austin  MSA 10% Texas 9% United  States 8% 7% 6% 5% 4% 3% 2% 1999 2000 2001 2002 2003 2004 2005 2006 2007 2008 2009 2010   YTD *Average,  January-­September. Source:  U.S.  Bureau  of  Labor  Statistics,  LAUS.
  • 26. Lowest  Unemployment  Rates Top  50  Metro  Areas Unemployment  Rate Difference Rank Washington  MDiv 5.6% 6.0% 0.4 1 Minneapolis  MSA 7.9 6.4 -­1.5 2 Nassau  MDiv 6.7 6.6 -­0.1 3 Austin  MSA 6.6 6.9 0.3 4 San  Antonio  MSA 6.3 7.1 0.8 5 Virginia  Beach  MSA 6.7 7.3 0.6 6 Baltimore  MSA 7.3 7.4 0.1 7 Richmond  MSA 7.6 7.6 0.1 8 Denver  MSA 8.2 7.7 -­0.5 9 Seattle  MDiv 7.6 7.9 0.2 10 Austin  is  the  39th largest  metro  based  on  total  civilian  labor  force  in  May. Source:    U.S.  Bureau  of  Labor  Statistics,  LAUS.
  • 27. Best  Performing  Among Top  50  Metro  Areas Non-­farm   -­ payroll  jobs Rank Difference %  Ch. Austin  MSA 767,700 4,000 0.5% 1 Washington  MDiv 2,412,700 10,800 0.4 2 Dallas  MDiv 2,024,700 5,600 0.3 3 Nassau  MDiv 1,241,800 2,700 0.2 4 Boston  MDiv 1,664,700 -­700 -­0.0 5 Louisville  MSA 599,600 -­300 -­0.1 6 Baltimore  MSA 1,282,300 -­900 -­0.1 7 Fort  Worth  MDiv 853,300 -­2,200 -­0.3 8 New  York  MDiv 5,116,800 -­14,300 -­0.3 9 Pittsburgh  MSA 1,128,100 -­4,300 -­0.4 10 Austin  is  the  42nd largest  metro  based  on  total  non-­farm  payroll  jobs  in  May. Source:    U.S.  Bureau  of  Labor  Statistics,  CES.
  • 28. Employment  by  Industry Austin  MSA,  May  2010 Construction 38,800   Manufacturing 46,700   Wholesale  trade 36,900   Retail  trade 81,300   Transp,  wrhsing,  &  util 12,600   Information 18,900   Financial  activities 44,500   Prof  &  business  services 105,300   Ed  &  hlth  services 86,100   Leisure  &  hospitality 91,600   Other  services 34,000   Government 171,000   Source:    Texas  Workforce  Commission,  CES.
  • 29. Employment  by  Industry Austin  MSA Government 166,400   Other  services 33,200   Leisure  &  hospitality 83,300   Education  &  health  services 83,300   Prof.  &  business  services 106,500   Financial  activities 43,700   Information 19,800   Transp,  warehousing,  &  utilties 12,800   Retail  trade 82,000   Wholesale  trade 38,000   48,300   2009 Manufacturing 1999 Construction  &  nat'l  res 40,800   -­ 40,000   80,000   120,000   160,000   200,000   Sources:  Texas  Workforce  Commission,  CES.
  • 31. Austin  Metro  Colleges  &   Universities Fall  2008  Enrollments Four-­Year  Institutions The  University  of  Texas,  Austin 49,984 Texas  State  University,  San  Marcos 29,105 5,348 Southwestern  University,  Georgetown 1,270 Concordia  University,  Austin 2,260 Huston-­Tillotson College,  Austin 785 University  of  Phoenix 464 DeVry University 254 Community  Colleges Austin  Community  College,  Austin 35,798 Temple  College-­Tayor Center,  Taylor 671 GRAND  TOTAL* 129,634 TOTAL  ENROLLMENTS  WITHIN  100  MILES 367,800 *Metro  total  includes  enrollments  for  some  2-­year  proprietary  schools  not  listed   separately. Source:    U.S.  National  Center  for  Education  Statistics.
  • 32. Austin  Research  Centers University  of  Texas Annual  research  expenditures  at  UT  Austin   exceed  $527  million The  university  supports  more  than  90   organized  research  units UT  is  the  4th most  patent-­earning  university   in  the  country UT  is  the  national  leader  in  the  number  of   annually  
  • 33. Additional  Major  Universities   within  200  Miles  of  Austin Enrollment   School Location Fall Texas  A  &  M  University College  Station 48,039   University  of  Houston Houstion 56,045   University  of  North  Texas Denton 34,830   University  of  Texas  at  San  Antonio San  Antonio 28,413   University  of  Texas  at  Arlington Arlington 25,084   Sam  Houston  State  University Huntsville 16,662   University  of  Texas  at  Dallas Richardson 14,913   Baylor  University Waco 14,541   Texas  Woman's  University Denton 12,465   Stephen  F.  Austin  State  University Nacogdoches 12,000   Southern  Methodist  University Dallas 10,965   Tarleton  State  University Stephenville 9,633   Texas  Southern  University Houston 9,102   Texas  A  &  M  University-­Corpus  Christi Corpus  Christi 9,007   Texas  Christian  University Fort  Worth 8,696   Prairie  View  A  &  M  University Prairie  View 8,203  
  • 34. OFFICE  &  INDUSTRIAL REAL  ESTATE
  • 35. Real  Estate Occupancy  Rates Austin  MSA 100% Office Industrial 95% 90% 85% 80% 75% 1997 1998 1999 2000 2001 2002 2003 2004 2005 2006 2007 2008 2009 2010   Q1 Source:    Oxford  Commercial.
  • 37. Housing  Units 1,000 1,500 2,000 2,500 3,000 3,500 4,000 0 500 2005  Jan 2005  Mar 2005  May 2005  Jul 2005  Sep Multifamily 2005  Nov Single  Family 2006  Jan 2006  Mar 2006  May Building  Permits 2006  Jul 2006  Sep Source:    U.S.  Bureau  of  the  Census. 2006  Nov 2007  Jan 2007  Mar 2007  May 2007  Jul 2007  Sep 2007  Nov Housing  Units  Authorized  by   2008  Jan 2008  Mar 2008  May 2008  Jul 2008  Sep 2008  Nov 2009  Jan 2009  Mar 2009  May 2009  Jul 2009  Sep 2009  Nov 2010  Jan 2010  Mar 2010  May
  • 38. Growth  Rates:  Housing  Units   Authorized  by  Building  Permits 30% 28.5% Austin  MSA 20% 16.5% United  States 10% 3.0% 0% -­4.0% -­10% -­9.4% -­20% -­19.2% -­30% -­25.7% -­40% -­35.6% 2008-­2009 YTD  2009-­2010 -­ -­ Source:    U.S.  Bureau  of  the  Census.
  • 39. Valuation  of  New  Housing  Units Authorized  by  Building  Permits Austin  MSA $550 $500 Monthly  average:   2005     $234M $450 2006     $262M   2007 $237M   $400 2008 $154M 2009 $104M $350 2010 YTD $118M Millions $300 $250 $200 $150 $100 $50 $0 2004   2004   2005   2005   2006   2006   2007   2007   2008   2008   2009   2009   2010   Jan Jul Jan Jul Jan Jul Jan Jul Jan Jul Jan Jul Jan Source:    U.S.  Bureau  of  the  Census.
  • 40. Growth  Rates: Valuation  of  Housing  Units  Authorized   by  Building  Permits 80% 61.3% 60% 40% 25.2% 19.3% 20% 10.1% 0% -­6.8% -­7.3% -­20% -­40% -­32.1%-­32.6% 2008-­2009 YTD  2009-­2010 -­ -­ Austin  MSA United  States Source:    U.S.  Bureau  of  the  Census.
  • 41. Home  Sales Austin  MSA  &  U.S. 35,000 8 30,000 7 6 United  States  (Millions) 25,000 5 Austin  MSA 20,000 4 15,000 3 10,000 2 5,000 1 0 0 1997 1998 1998 1999 2000 2001 2002 2003 2004 2005 2006 2007 2008 2009 Austin  MSA United  States Source:    Real  Estate  Center  at  Texas  A+M  University  &  National  Association  of  Realtors.
  • 42. Home  Sales Austin  MSA 2007-­2008:  Austin  down  20%  &  national  down  13% 2008-­2009:  Austin  down  7%  &  national  down  5% -­ 3,500 3,000 2,500 2,000 1,500 1,000 500 0 Source:    Real  Estate  Center  at  Texas  A&M  University.
  • 43. Year-­Over-­Year  %  Ch.  in   Home  Sales 60% 40% 20% 0% -­20% -­40% Austin  MSA Texas United  States Source:    Real  Estate  Center  at  Texas  A&M  University  &  National  Association  of  Realtors.
  • 44. Months  Inventory  of  Homes  on   the  Market 12 11 10 9 8 7 6 5 4 3 2 1 0 Austin  MSA Texas United  States Source:  Real  Estate  Center  at  Texas  A&M  University  &  National  Association  of  Realtors.
  • 45. Median  Home  Prices Existing  Homes $200,000 $195,000 $189,300 $190,000 $185,000 $179,600 $180,000 $175,000 $170,000 $165,000 $160,000 Austin  MSA United  States Source:    Real  Estate  Center  at  Texas  A&M  University  &  National  Association  of  Realtors.
  • 46. Growth  Rates: Median  Home  Price 6% 4.2% 4% 2.7% 2.3% 2% 0% -­2% -­1.2% -­2.1% -­4% -­6% -­8% 2009  Median  Home  Prices: Austin  MSA   $186,000 -­10% United  States   $172,500 -­12% -­14% -­12.9% 2008-­2009 -­ -­ Austin  MSA United  States Source:    Real  Estate  Center  at  Texas  A&M  University  &  National  Association  of  Realtors.
  • 47. Home  Sales  &  Prices Austin  MSA 35,000 $250,000 30,000 $200,000 25,000 $150,000 20,000 Sales Price 15,000 $100,000 10,000 $50,000 5,000 0 $0 1997 1998 1999 2000 2001 2002 2003 2004 2005 2006 2007 2008 2009 Home  Sales Average  Price Median  Price Source:    Real  Estate  Center  at  Texas  A+M  University.
  • 48. Home  Sales  &  Prices Austin  MSA 32,000 $250,000 28,000 $200,000 24,000 20,000 $150,000 Sales Price 16,000 $100,000 12,000 8,000 $50,000 4,000 0 $0 Home  Sales Average  Price Median  Price Source:    Real  Estate  Center  at  Texas  A+M  University.
  • 49. Median  Home  Prices New  &  Existing  Homes $250,000 Austin  MSA $230,000 United  States $210,000 $190,000 $170,000 $150,000 $130,000 $110,000 $90,000 Source:    National  Association  of  Home  Builders.
  • 50. Average  Home  Prices  2009 $0 $250,000 $500,000 $750,000 $1,000,000 $1,250,000 Atlanta The  subject  home  is  a  single-­family   Austin dwelling,  2,200  sq.  ft.,  4  bedrooms,  2  1/2   baths,  family  room,  &  2-­car  garage  in   neighborhoods  within  a  market  that  is   Chicago* typical  for  corporate  middle-­management   transferees. Denver* Los  Angeles* New  York* San  Francisco* United  States Source:    Coldwell  Banker.                        *Unweighted average  of  multiple  reported  submarkets.  
  • 51. Average  Apartment  Rents 2010  Q1 1  bedroom 2  bedrooms 3  bedrooms Austin  MSA $688 $886 $1,169 Travis  County 696 911 1,233 Downtown 1,445 2,320 3,929 Central  Austin 920 1,262 1,944 North 553 688 878 Northwest  Hills 708 953 1,326 Far  Northwest 693 904 1,213 Northeast 618 780 1,023 Far  Northeast 668 876 1,095 South 683 854 1,055 Southeast 579 740 1,036 Southwest 787 1,028 1,262 Cedar  Park/Leander  (Williamson  County) 670 843 1,078 Round  Rock  (Williamson  County) 650 826 1,036 Northwest  (Williamson  &  Travis  Cos.) 655 851 1,081 Balance  of  Williamson  County 672 828 1,048 Bastrop  County 639 714 977 San  Marcos  (Hays  County) 675 777 1,047 Source:    Austin  Investor  Interests.  
  • 52. Average  Apartment  Rents 2-­bedroom  Units,  2010  Q1 $-­ $500   $1,000   $1,500   $2,000   $2,500   Austin  MSA $886   Travis  County $911   Central  Business  District $2,320   Central  Austin $1,262   North $688   Northwest  Hills $953   Far  Northwest $904   Northeast $780   Far  Northeast $876   South $854   Southeast $740   Southwest $1,028   Cedar  Park/Leander $843   Round  Rock $826   Northwest $851   Balance  of  Williamson  County $828   Bastrop  County $714   San  Marcos $777   Source:    Austin  Investor  Interests.  
  • 53. Downtown  Condominiums Sales   Active   Average   Median   Sold  to   Sales price  per   listings sales  price sales  price list  price SF Jan.-­Apr. 2009 188 20 $351,670 $281,850 $296 92% Jan.-­Apr.  2010 175 47 $361,106 $290,000 $299 94% Note:  The  Downtown  submarket  is  MLK  Blvd.  to  I-­35  to  the  Colorado  River  to  Lamar  Blvd.  to   MLK  Blvd.  This  residential  submarket  is  almost  exclusively  condo.    Market-­wide  the  average   price  of  a  condo  is  $172,585  and  the  median  price  is  $152,650.   Source:    Austin  Board  of  Realtors.  
  • 55. Cost  of  Living  Index  2009 0 25 50 75 100 125 150 175 200 225 Atlanta  MSA Austin  MSA Chicago  MDiv Denver  MSA Los  Angeles  MDiv NY  (Manhattan) San  Francisco  MDiv United  States Source:    Council  for  Community  &  Economic  Research.
  • 57. Sales  &  Use  Tax  Comparison:  20  Largest  Cities 2010  May %  Ch  from  last  yr 2010  YTD %  Ch  from  last  yr Austin 13,610,355 12.2% 58,652,568 5.6% El  Paso 6,593,737 9.8 29,267,088 4.7 Mesquite 3,621,338 11.0 14,688,088 4.4 Round  Rock 5,610,817 9.0 26,020,736 4.1 Frisco 4,017,244 16.6 16,850,224 4.1 Arlington 8,566,495 11.5 34,775,228 3.7 Plano 6,170,554 12.3 25,337,490 2.8 McAllen 5,256,876 7.9 24,789,569 1.0 San  Antonio 21,004,722 6.3 87,625,660 -­0.1 Lubbock 5,078,118 6.6 21,184,555 -­0.4 Grand  Prairie 3,571,180 -­0.3 14,797,957 -­2.2 Amarillo 5,777,874 7.7 23,966,017 -­2.3 Fort  Worth 9,951,915 0.2 41,638,585 -­2.7 Dallas 21,053,620 4.2 87,218,074 -­4.8 Irving 4,868,669 4.7 18,877,341 -­5.4 Sugar  Land 3,510,812 -­6.2 16,353,779 -­5.9 Tyler 3,223,569 -­2.2 14,491,859 -­6.0 Corpus  Christi 5,390,957 1.1 23,725,667 -­8.6 Houston 47,419,146 3.8 200,202,049 -­9.3 Midland 3,423,685 7.2 14,452,141 -­10.1 All  Texas  Cities 4.6 -­4.4 Source:    Texas  Comptroller.
  • 58. Sales  Tax  Allocations ons $400 City  of  San  Marcos $350 City  of  Round  Rock Austin  MTA $300 City  of  Austin $250 Millions $200 $150 $100 $50 $0 1999 2000 2001 2002 2003 2004 2005 2006 2007 2008 2009 Source:  Texas  Comptroller.
  • 59. Sales  Tax  Allocations City  of  Austin $150 $125 $100 Millions $75 $50 $25 $0 1999 2000 2001 2002 2003 2004 2005 2006 2007 2008 2009 Source:  Texas  Comptroller.
  • 61. Austin  in  the  News   Business  Rankings Austin  in  Top  10  of  Forbes Careers.  (Forbes,  4/14/10) Texas  No.  1  among  States  that  are  Very  Friendly  to  Small   Businesses.  (Open  Forum,  4/6/10) Austin  metro  rated  Best  Place  for  Creation  &  Development  of  Small   Businesses.  (Portfolio.com,  1/18/10) Austin  is  home  to  the  No.  3  Cleantech University.    (The  Cleantech Group,  1/4/10) Austin  No.  2  Strongest  Metro  Economy.  (Business  Week,  10/26/09) Austin  named  one  of  79  metros  Where  the  Recession  has  Ended. (Moody's  Economy.com  &  msnbc.com.,  10/15/09) Austin  a  Top  10  Start-­Up  City.  (Entrepreneur, 8/09) Austin  is  the  3rd  Strongest  Metro  Economy  in  the  Country. (Brookings  Institution,  6/16/09) Texas  Ranked  No.  1  For  Business. (Directorship,  6/1/09) Austin  in  the  Top  20  High  Tech  Metropolitan  Areas.  (Milken  Institute,   6/2/09) Austin  is  a  City  of  the  Future.  (fDi Magazine Texas  voted  Best  for  Business.  (Chief  Executive,  3/25/09)
  • 62. Austin  in  the  News   Quality  of  Life  Rankings Austin  is  the  No.  1  Place  for  Young  Adults.  (portfolio.com/bizjournals,   3/15/10) Austin  is  the  Healthiest  Housing  Market  for  2010.  (Builder,  2/25/10) Austin  named  the  Top  City  for  Your  Career.  (Sales  HQ,  8/25/09) Austin  No.  2  Best  City  for  Working  Moms.  (Forbes,  8/4/09) Austin  is  2nd most  affordable  city  in  Forbes (Forbes,  6/29/09) Austin  one  of  U.S.  News (USNews.com,  6/8/09) Austin  ranks  9th on  American  Fitness  Index.  (American  College  Sports   Medicine,  5/26/09) Austin  the  Best  City  for  a  Fresh  Start.  (Relocation.com,  5/21/09) Austin  ranked  11th Best  City  for  the  Outdoors.  (Forbes,  5/12/09) Austin  Best  Bargain  City  in  the  U.S.  (Forbes,  5/09) Austin  one  of  the  10  Best  Cities  of  2009.  (Kiplinger.com,  5/09) Austin  no.  1  Big  City  for  Jobs.  (Forbes,  4/12/09) Austin  comes  in  2nd in  the  top  10  Cities  Where  Americans  are   Relocating.  (Forbes,  3/30/09) Austin  one  of  15  Coolest  North  American  Cities.  (MSN  Travel,  1/22/09)
  • 64. Peer  Metros Unemployment   Nonfarm  Payroll  Jobs Rate -­ May  2010 May  2010 Difference Percent United  States 9.3% -­0.4% Texas 8.0 0.2 Austin  MSA 6.9 767,700 4,000 0.5 Denver  MSA 7.7 1,181,300 -­24,900 -­2.1% Nashville  MSA 9.0 720,800 -­5,500 -­0.8% Phoenix  MSA 8.7 1,721,400 -­12,000 -­0.7% Raleigh  MSA 8.2 500,600 -­2,900 -­0.6% Not  seasonally  adjusted. Source:    U.S.  Bureau  of  Labor  Statistics.
  • 65. Opportunity  Austin Summary  of  Results 5-­Year 5-­Year Result Goal New  jobs 124,200 72,000 Payroll  increase $5.6 billion $2.9  billion Corporate  relocation   144 100 announcements Out-­of-­region  visits 835 500 Prospect  visits 540 250 Regional  retention  visits 857 475
  • 66. Regional  Issues 2007  Issues 2008  YTD  Issues Prop-­ Non-­ erty   Traffic,   stop   Traffic,   Taxes,   61,   Flights 67,   55,   25% 40 29% 23% 18% Public   Public   Transit,   Transit,   54,   46,   Tech-­ 24% Talent,   Talent,   19% 78,   nical   Talent,   65,   33% Coll-­ 19,   29% eges,   29% 21,   31% Public   Transit,   27,   40% 2008  YTD  Regional   Partner  Issues
  • 67. Opportunity  Austin 5-­Year  Plan Program  Goals: 72,000  net  new  jobs $2.9  billion  net  increase  in  payroll $14  billion  in  GRP
  • 68. Opportunity  Austin Relocations  by  Target  Industry  Sector 2004-­June  2010 Clean  energy 9 Data  center 6 Digital  media 24 Headquarters/regional office 35 Life  sciences 19 Semiconductor 14 Software 21 Wireless 8 Other  IT 12 Other 30 TOTAL 178
  • 69. Origin  of  Corporate  Relocations to  the  Austin  Area  Since  2004 Through  December  2009
  • 70. Opportunity  Austin  2.0 2009-­2013 MAJOR  GOALS In  the  next  5  years: 1. Create  a  net  gain  of  more   than  117,000  jobs 2. total  payroll  by  $10.8  billion
  • 71. Opportunity  Austin  2.0 Five-­Year  Approved  Budget $426,878   $100,000   2.0% 0.5% $1,000,000   $21  Million 4.8% $483,897   Economic  diversification 2.3% $1,362,349   Business  retention  &   6.5% expansion $732,743   Education 3.5% $8,509,907   Talent  attraction 40.5% Improve  transportation   system $6,272,472   29.9% Keeping  Greater  Austin   Great Investor  relations Fundraising  campaign $2,111,754   10.1%
  • 72. Opportunity  Austin  2.0 Comparison  Cities $60 $60.0 $50 $40 $30 Millions $25.0 $20 $22.5 $22.5 $22.0 $21.0 $17.0 $17.0 $10 $0
  • 73. Opportunity  Austin  2.0 Economic  Diversification Convergence  technologies Creative  media Green  industries Corporate/professional  headquarters   &  offices Health  care  &  life  sciences
  • 74. Opportunity  Austin  2.0 Economic  Diversification Target  industries Convergence  technologies Wireless Software Nanotechnology Semiconductors
  • 75. Opportunity  Austin  2.0 Economic  Diversification Target  industries Creative  media Media  development Production Distribution The  marketing  of: Music Film Television Video  game  industries
  • 76. Opportunity  Austin  2.0 Economic  Diversification Target  industries Green  industries Solar  panels Fuel  cells Wind  turbines Electric  cars Clean  energy Green  products
  • 77. Opportunity  Austin  2.0 Economic  Diversification Target  industries Health  care  &  life  sciences Medical  devices Bio-­tech Bioinformatics Bioscience Nanoscience
  • 78. Austin,  Texas A  Beautiful  Place  to  Live