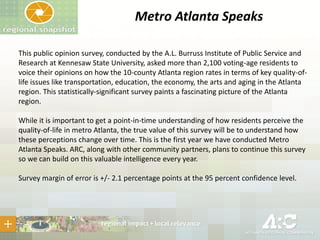
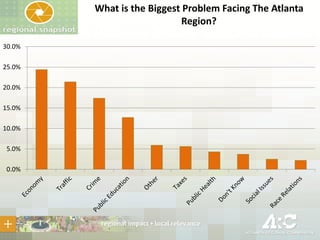
Taking the Pulse of Metro Residents
Atlanta Regional Commission
For more information contact:
mcarnathan@atlantaregional.com
Metro Atlanta Speaks
This public opinion survey, conducted by the A.L. Burruss Institute of Public Service and
Research at Kennesaw State University, asked more than 2,100 voting-age residents to
voice their opinions on how the 10-county Atlanta region rates in terms of key quality-oflife issues like transportation, education, the economy, the arts and aging in the Atlanta
region. This statistically-significant survey paints a fascinating picture of the Atlanta
region.
While it is important to get a point-in-time understanding of how residents perceive the
quality-of-life in metro Atlanta, the true value of this survey will be to understand how
these perceptions change over time. This is the first year we have conducted Metro
Atlanta Speaks. ARC, along with other community partners, plans to continue this survey
so we can build on this valuable intelligence every year.
Survey margin of error is +/- 2.1 percentage points at the 95 percent confidence level.
What is the Biggest Problem Facing The Atlanta
Region?
30.0%
25.0%
20.0%

15.0%
10.0%
5.0%
0.0%
Rate The Availability of Job Opportunities in Metro
Atlanta...
Don't Know, 7.7%

Excellent, 6.7%

Poor, 20.3%
Good, 29.0%

Fair, 36.3%
Compared to Other Metropolitan Areas, Rate the
Economy of Metro Atlanta...
40.0%
35.0%

38.0%

36.6%

30.0%
25.0%
20.0%
17.3%

15.0%
10.0%
5.0%
0.0%
Much or Slightly Better

Much or Slightly Worse

About the Same
Rate Metro Atlanta As A Place To Live...
Poor, 4.6%

Don't Know, 0.8%

Excellent, 14.5%
Excellent
Fair, 27.5%

Good
Fair
Poor
Don't Know
Good, 52.5%
Will Living Conditions Be Better or Worse in Metro
Atlanta in 3-4 years?

Better in 3-4 years,
27.8%
Better in 3-4 years

About the same,
39.1%

Worse in 3-4 years

About the same
Worse in 3-4 years,
30.5%
Has Traffic in Metro Atlanta Gotten Better or Worse
in Last 3-4 Years?
Gotten Better
7.0%

About the Same,
33.8%

Gotten Worse, 56.8%

Don't Know
2.4%

0%

10%

20%

30%

40%

50%

60%

70%

80%

90%

100%
Best Long-Term Solution to Traffic Problems in Metro
Area?
Don't Know, 4.5%
Do Nothing, 2.7%

Develop
Communities in
Which People Live
Close to Where They
Work, 21.9%

Improvements to
Public
Transportation,
40.9%

Better Roads &
Highways, 30.0%
How Important is Improved Public Transportation For
Metro Atlanta's Future?

Not Important At All
8.8%
Somewhat
Important
17.1%

Very Important
71.3%

0%

20%

40%

60%

80%

Don't Know
2.7%

100%
Best Way for Metro Atlanta to Accommodate
Growth?
Other, 0.9%

Don't Know, 5.0%

Build New Suburbs,
18.3%

Redevelop Older
Areas, 75.8%
If You Could Live Anywhere in Metro Area, What
Type of Neighborhood Would You Prefer?
Don't Know, 2.9%

Single Family Residential Area
Mixed Development,
39.2%

Single Family
Residential Area,
57.9%

Mixed Development
Don't Know
Rate Public Education In...
40.0%
35.0%
30.0%
25.0%
20.0%
15.0%
10.0%
5.0%
0.0%
Your District Metro-Wide Your District Metro-Wide Your District Metro-Wide Your District Metro-Wide
Excellent

Good

Fair

Poor
How Would You Rate Your Neighborhood As A Place
To Live?
Poor, 4.7%

Don't Know, 0.2%

Fair, 15.0%
Excellent
Excellent, 33.2%

Good
Fair
Poor
Don't Know

Good, 47.0%
How Long Does It Take You to Get to Work From
Your Home?
35.0
30.0

32.5

25.0

25.0

20.0
15.0
10.0

5.0
0.0
Average Commute Time

Median Commute Time
Rate Availability of Cultural Events and Venues in
Metro Area
Don't Know
3.6%

Excellent, 23.7%

0%

10%

20%

Good, 44.6%

30%

40%

50%

Fair, 22.6%

60%

70%

80%

Poor
5.6%

90%

100%
Biggest Problem Associated With Growing Old in
Metro Atlanta?
30.0%
25.0%
20.0%
15.0%
10.0%
5.0%
0.0%
Staying in
Own Home

Financial
Issues

Affordable
Housing

Locating
Other
Services

Transportation

Don't Know

Other
Primary Source of Information on Current Events?

Word of Mouth,
5.3%

Other, 1.6%

Don't Know, 0.6%

Television
Radio
Television, 38.7%
Internet, 34.0%

Newspapers

Internet
Word of Mouth
Other
Don't Know
Radio, 11.1%

Newspapers, 8.7%

Metro Atlanta Speaks: Taking the Pulse of Metro Residents

  • 1.
    Taking the Pulseof Metro Residents Atlanta Regional Commission For more information contact: mcarnathan@atlantaregional.com
  • 2.
    Metro Atlanta Speaks Thispublic opinion survey, conducted by the A.L. Burruss Institute of Public Service and Research at Kennesaw State University, asked more than 2,100 voting-age residents to voice their opinions on how the 10-county Atlanta region rates in terms of key quality-oflife issues like transportation, education, the economy, the arts and aging in the Atlanta region. This statistically-significant survey paints a fascinating picture of the Atlanta region. While it is important to get a point-in-time understanding of how residents perceive the quality-of-life in metro Atlanta, the true value of this survey will be to understand how these perceptions change over time. This is the first year we have conducted Metro Atlanta Speaks. ARC, along with other community partners, plans to continue this survey so we can build on this valuable intelligence every year. Survey margin of error is +/- 2.1 percentage points at the 95 percent confidence level.
  • 3.
    What is theBiggest Problem Facing The Atlanta Region? 30.0% 25.0% 20.0% 15.0% 10.0% 5.0% 0.0%
  • 4.
    Rate The Availabilityof Job Opportunities in Metro Atlanta... Don't Know, 7.7% Excellent, 6.7% Poor, 20.3% Good, 29.0% Fair, 36.3%
  • 5.
    Compared to OtherMetropolitan Areas, Rate the Economy of Metro Atlanta... 40.0% 35.0% 38.0% 36.6% 30.0% 25.0% 20.0% 17.3% 15.0% 10.0% 5.0% 0.0% Much or Slightly Better Much or Slightly Worse About the Same
  • 6.
    Rate Metro AtlantaAs A Place To Live... Poor, 4.6% Don't Know, 0.8% Excellent, 14.5% Excellent Fair, 27.5% Good Fair Poor Don't Know Good, 52.5%
  • 7.
    Will Living ConditionsBe Better or Worse in Metro Atlanta in 3-4 years? Better in 3-4 years, 27.8% Better in 3-4 years About the same, 39.1% Worse in 3-4 years About the same Worse in 3-4 years, 30.5%
  • 8.
    Has Traffic inMetro Atlanta Gotten Better or Worse in Last 3-4 Years? Gotten Better 7.0% About the Same, 33.8% Gotten Worse, 56.8% Don't Know 2.4% 0% 10% 20% 30% 40% 50% 60% 70% 80% 90% 100%
  • 9.
    Best Long-Term Solutionto Traffic Problems in Metro Area? Don't Know, 4.5% Do Nothing, 2.7% Develop Communities in Which People Live Close to Where They Work, 21.9% Improvements to Public Transportation, 40.9% Better Roads & Highways, 30.0%
  • 10.
    How Important isImproved Public Transportation For Metro Atlanta's Future? Not Important At All 8.8% Somewhat Important 17.1% Very Important 71.3% 0% 20% 40% 60% 80% Don't Know 2.7% 100%
  • 11.
    Best Way forMetro Atlanta to Accommodate Growth? Other, 0.9% Don't Know, 5.0% Build New Suburbs, 18.3% Redevelop Older Areas, 75.8%
  • 12.
    If You CouldLive Anywhere in Metro Area, What Type of Neighborhood Would You Prefer? Don't Know, 2.9% Single Family Residential Area Mixed Development, 39.2% Single Family Residential Area, 57.9% Mixed Development Don't Know
  • 13.
    Rate Public EducationIn... 40.0% 35.0% 30.0% 25.0% 20.0% 15.0% 10.0% 5.0% 0.0% Your District Metro-Wide Your District Metro-Wide Your District Metro-Wide Your District Metro-Wide Excellent Good Fair Poor
  • 14.
    How Would YouRate Your Neighborhood As A Place To Live? Poor, 4.7% Don't Know, 0.2% Fair, 15.0% Excellent Excellent, 33.2% Good Fair Poor Don't Know Good, 47.0%
  • 15.
    How Long DoesIt Take You to Get to Work From Your Home? 35.0 30.0 32.5 25.0 25.0 20.0 15.0 10.0 5.0 0.0 Average Commute Time Median Commute Time
  • 16.
    Rate Availability ofCultural Events and Venues in Metro Area Don't Know 3.6% Excellent, 23.7% 0% 10% 20% Good, 44.6% 30% 40% 50% Fair, 22.6% 60% 70% 80% Poor 5.6% 90% 100%
  • 17.
    Biggest Problem AssociatedWith Growing Old in Metro Atlanta? 30.0% 25.0% 20.0% 15.0% 10.0% 5.0% 0.0% Staying in Own Home Financial Issues Affordable Housing Locating Other Services Transportation Don't Know Other
  • 18.
    Primary Source ofInformation on Current Events? Word of Mouth, 5.3% Other, 1.6% Don't Know, 0.6% Television Radio Television, 38.7% Internet, 34.0% Newspapers Internet Word of Mouth Other Don't Know Radio, 11.1% Newspapers, 8.7%