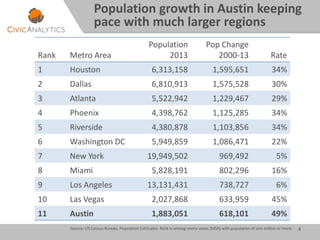
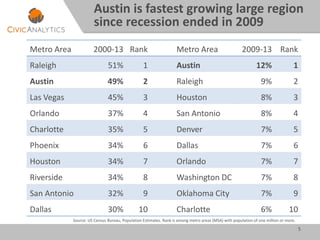
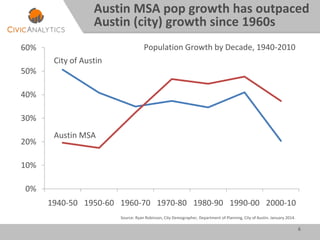
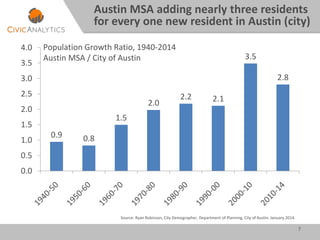
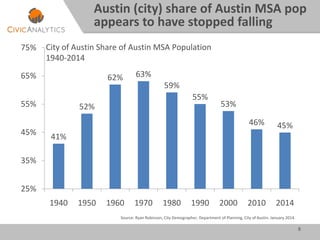
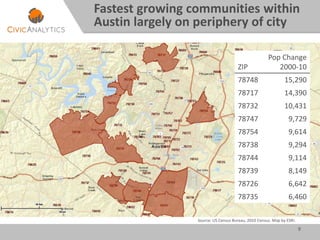
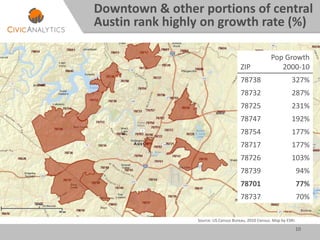
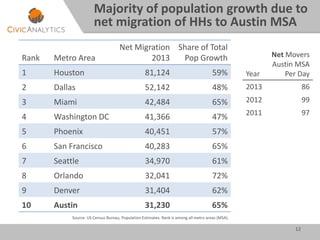
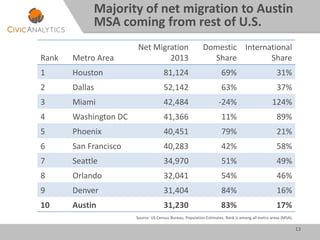
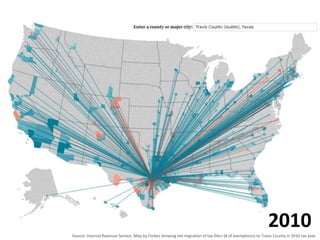
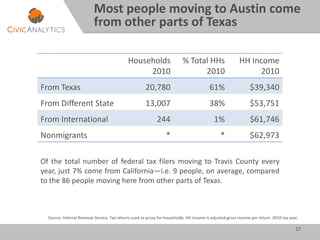
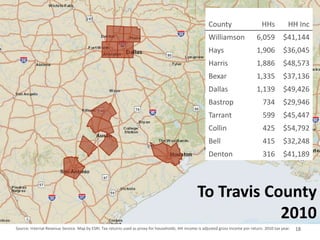
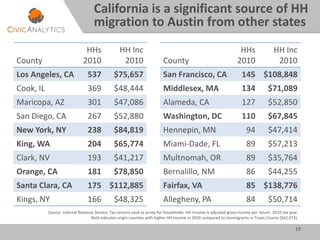
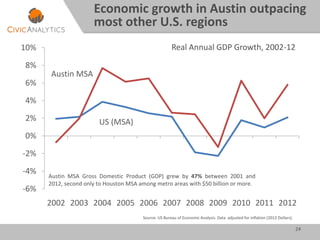
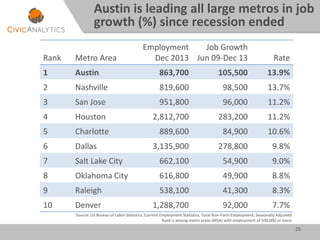
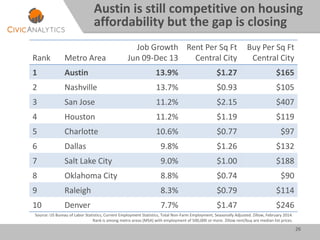
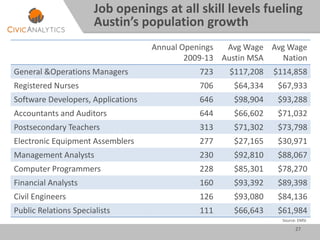
Austin: Growth, Change & Promise
April 2014
1. How fast is Austin growing?
2. Where are people coming from?
3. Why is Austin so attractive?
4. Is everybody benefiting?
5. What can I do?
2
Presentation Overview
How fast is Austin growing?
3
4
Rank Metro Area
Population
2013
Pop Change
2000-13 Rate
1 Houston 6,313,158 1,595,651 34%
2 Dallas 6,810,913 1,575,528 30%
3 Atlanta 5,522,942 1,229,467 29%
4 Phoenix 4,398,762 1,125,285 34%
5 Riverside 4,380,878 1,103,856 34%
6 Washington DC 5,949,859 1,086,471 22%
7 New York 19,949,502 969,492 5%
8 Miami 5,828,191 802,296 16%
9 Los Angeles 13,131,431 738,727 6%
10 Las Vegas 2,027,868 633,959 45%
11 Austin 1,883,051 618,101 49%
Population growth in Austin keeping
pace with much larger regions
Source: US Census Bureau, Population Estimates. Rank is among metro areas (MSA) with population of one million or more.
5
Metro Area 2000-13 Rank Metro Area 2009-13 Rank
Raleigh 51% 1 Austin 12% 1
Austin 49% 2 Raleigh 9% 2
Las Vegas 45% 3 Houston 8% 3
Orlando 37% 4 San Antonio 8% 4
Charlotte 35% 5 Denver 7% 5
Phoenix 34% 6 Dallas 7% 6
Houston 34% 7 Orlando 7% 7
Riverside 34% 8 Washington DC 7% 8
San Antonio 32% 9 Oklahoma City 7% 9
Dallas 30% 10 Charlotte 6% 10
Austin is fastest growing large region
since recession ended in 2009
Source: US Census Bureau, Population Estimates. Rank is among metro areas (MSA) with population of one million or more.
6
0%
10%
20%
30%
40%
50%
60%
1940-50 1950-60 1960-70 1970-80 1980-90 1990-00 2000-10
City of Austin
Austin MSA
Population Growth by Decade, 1940-2010
Source: Ryan Robinson, City Demographer, Department of Planning, City of Austin. January 2014.
Austin MSA pop growth has outpaced
Austin (city) growth since 1960s
7
0.9 0.8
1.5
2.0
2.2 2.1
3.5
2.8
0.0
0.5
1.0
1.5
2.0
2.5
3.0
3.5
4.0 Population Growth Ratio, 1940-2014
Austin MSA / City of Austin
Austin MSA adding nearly three residents
for every one new resident in Austin (city)
Source: Ryan Robinson, City Demographer, Department of Planning, City of Austin. January 2014.
8
41%
52%
62% 63%
59%
55%
53%
46% 45%
25%
35%
45%
55%
65%
75%
1940 1950 1960 1970 1980 1990 2000 2010 2014
City of Austin Share of Austin MSA Population
1940-2014
Austin (city) share of Austin MSA pop
appears to have stopped falling
Source: Ryan Robinson, City Demographer, Department of Planning, City of Austin. January 2014.
9
ZIP
Pop Change
2000-10
78748 15,290
78717 14,390
78732 10,431
78747 9,729
78754 9,614
78738 9,294
78744 9,114
78739 8,149
78726 6,642
78735 6,460
Fastest growing communities within
Austin largely on periphery of city
Source: US Census Bureau, 2010 Census. Map by ESRI.
10
ZIP
Pop Growth
2000-10
78738 327%
78732 287%
78725 231%
78747 192%
78754 177%
78717 177%
78726 103%
78739 94%
78701 77%
78737 70%
Downtown & other portions of central
Austin rank highly on growth rate (%)
Source: US Census Bureau, 2010 Census. Map by ESRI.
Where are people coming from?
11
12
Majority of population growth due to
net migration of HHs to Austin MSA
Source: US Census Bureau, Population Estimates. Rank is among all metro areas (MSA).
Rank Metro Area
Net Migration
2013
Share of Total
Pop Growth
1 Houston 81,124 59%
2 Dallas 52,142 48%
3 Miami 42,484 65%
4 Washington DC 41,366 47%
5 Phoenix 40,451 57%
6 San Francisco 40,283 65%
7 Seattle 34,970 61%
8 Orlando 32,041 72%
9 Denver 31,404 62%
10 Austin 31,230 65%
Year
Net Movers
Austin MSA
Per Day
2013 86
2012 99
2011 97
13
Majority of net migration to Austin
MSA coming from rest of U.S.
Source: US Census Bureau, Population Estimates. Rank is among all metro areas (MSA).
Rank Metro Area
Net Migration
2013
Domestic
Share
International
Share
1 Houston 81,124 69% 31%
2 Dallas 52,142 63% 37%
3 Miami 42,484 -24% 124%
4 Washington DC 41,366 11% 89%
5 Phoenix 40,451 79% 21%
6 San Francisco 40,283 42% 58%
7 Seattle 34,970 51% 49%
8 Orlando 32,041 54% 46%
9 Denver 31,404 84% 16%
10 Austin 31,230 83% 17%
Source: Internal Revenue Service. Map by Forbes showing net migration of tax filers (# of exemptions) to Travis County in 2010 tax year.
2010
Source: Internal Revenue Service. Map by Forbes showing net migration of tax filers (# of exemptions) to Wayne County in 2010 tax year.
2010
Source: Internal Revenue Service. Map by Forbes showing net migration of tax filers (# of exemptions) to Orleans Parish in 2006 tax year.
2006
17
Households
2010
% Total HHs
2010
HH Income
2010
From Texas 20,780 61% $39,340
From Different State 13,007 38% $53,751
From International 244 1% $61,746
Nonmigrants * * $62,973
Most people moving to Austin come
from other parts of Texas
Of the total number of federal tax filers moving to Travis County every
year, just 7% come from California—i.e. 9 people, on average, compared
to the 86 people moving here from other parts of Texas.
Source: Internal Revenue Service. Tax returns used as proxy for households. HH income is adjusted gross income per return. 2010 tax year.
18
To Travis County
2010
County HHs HH Inc
Williamson 6,059 $41,144
Hays 1,906 $36,045
Harris 1,886 $48,573
Bexar 1,335 $37,136
Dallas 1,139 $49,426
Bastrop 734 $29,946
Tarrant 599 $45,447
Collin 425 $54,792
Bell 415 $32,248
Denton 316 $41,189
Source: Internal Revenue Service. Map by ESRI. Tax returns used as proxy for households. HH income is adjusted gross income per return. 2010 tax year.
19
California is a significant source of HH
migration to Austin from other states
Source: Internal Revenue Service. Tax returns used as proxy for households. HH income is adjusted gross income per return. 2010 tax year.
Bold indicates origin counties with higher HH income in 2010 compared to nonmigrants in Travis County ($62,973).
County
HHs
2010
HH Inc
2010
Los Angeles, CA 537 $75,657
Cook, IL 369 $48,444
Maricopa, AZ 301 $47,086
San Diego, CA 267 $52,880
New York, NY 238 $84,819
King, WA 204 $65,774
Clark, NV 193 $41,217
Orange, CA 181 $78,850
Santa Clara, CA 175 $112,885
Kings, NY 166 $48,325
County
HHs
2010
HH Inc
2010
San Francisco, CA 145 $108,848
Middlesex, MA 134 $71,089
Alameda, CA 127 $52,850
Washington, DC 110 $67,845
Hennepin, MN 94 $47,414
Miami-Dade, FL 89 $57,213
Multnomah, OR 89 $35,764
Bernalillo, NM 86 $44,255
Fairfax, VA 85 $138,776
Allegheny, PA 84 $50,714
20
Steiner Ranch is among most popular
neighborhoods for out-of-state HHs
1. Steiner Ranch
2. Milwood/Arrowwood
3. North Burnet/Domain
4. Blackhawk/Hidden Lake
5. Canyon Creek
6. Hyde Park
7. North Loop
8. Onion Creek
9. Barton Creek/Hills
10. Old West Austin
11. Northwest Hills
12. Preston Oaks
Source: US Census Bureau, American Community Survey 2007-2011, Five-Year Estimates.
• Most people moving to Austin come
from other parts of Texas.
• Most people moving to Austin from
other states have lower HH income
compared to existing residents.
• Austin usually gains (net) residents
from other large Texas counties &
usually loses residents to nearby
counties in the MSA (esp WilCo).
21
Migration myths stand in way of better
understanding real drivers of growth
Note: Austin here is shorthand for Travis County. Migration data from the IRS is not available for cities.
• Generally, people moving from Austin to
Williamson & Hays have higher income
than movers from Williamson & Hays to
Austin, but lower inc than existing HHs.
• HHs moving to Austin report slightly
fewer dependents than HHs moving
away from Austin.
• More data on age, education, income,
race/ethnicity available from Census
http://flowsmapper.geo.census.gov
22
Migration myths stand in way of better
understanding real drivers of growth
Note: Austin here is shorthand for Travis County. Migration data from the IRS is not available for cities.
Why is Austin so attractive?
23
24
-6%
-4%
-2%
0%
2%
4%
6%
8%
10%
2002 2003 2004 2005 2006 2007 2008 2009 2010 2011 2012
US (MSA)
Austin MSA
Real Annual GDP Growth, 2002-12
Austin MSA Gross Domestic Product (GDP) grew by 47% between 2001 and
2012, second only to Houston MSA among metro areas with $50 billion or more.
Source: US Bureau of Economic Analysis. Data adjusted for inflation (2013 Dollars).
Economic growth in Austin outpacing
most other U.S. regions
25
Austin is leading all large metros in job
growth (%) since recession ended
Source: US Bureau of Labor Statistics, Current Employment Statistics, Total Non-Farm Employment, Seasonally Adjusted.
Rank is among metro areas (MSA) with employment of 500,000 or more.
Rank Metro Area
Employment
Dec 2013
Job Growth
Jun 09-Dec 13 Rate
1 Austin 863,700 105,500 13.9%
2 Nashville 819,600 98,500 13.7%
3 San Jose 951,800 96,000 11.2%
4 Houston 2,812,700 283,200 11.2%
5 Charlotte 889,600 84,900 10.6%
6 Dallas 3,135,900 278,800 9.8%
7 Salt Lake City 662,100 54,900 9.0%
8 Oklahoma City 616,800 49,900 8.8%
9 Raleigh 538,100 41,300 8.3%
10 Denver 1,288,700 92,000 7.7%
26
Austin is still competitive on housing
affordability but the gap is closing
Source: US Bureau of Labor Statistics, Current Employment Statistics, Total Non-Farm Employment, Seasonally Adjusted. Zillow, February 2014.
Rank is among metro areas (MSA) with employment of 500,000 or more. Zillow rent/buy are median list prices.
Rank Metro Area
Job Growth
Jun 09-Dec 13
Rent Per Sq Ft
Central City
Buy Per Sq Ft
Central City
1 Austin 13.9% $1.27 $165
2 Nashville 13.7% $0.93 $105
3 San Jose 11.2% $2.15 $407
4 Houston 11.2% $1.19 $119
5 Charlotte 10.6% $0.77 $97
6 Dallas 9.8% $1.26 $132
7 Salt Lake City 9.0% $1.00 $188
8 Oklahoma City 8.8% $0.74 $90
9 Raleigh 8.3% $0.79 $114
10 Denver 7.7% $1.47 $246
27
Annual Openings
2009-13
Avg Wage
Austin MSA
Avg Wage
Nation
General &Operations Managers 723 $117,208 $114,858
Registered Nurses 706 $64,334 $67,933
Software Developers, Applications 646 $98,904 $93,288
Accountants and Auditors 644 $66,602 $71,032
Postsecondary Teachers 313 $71,302 $73,798
Electronic Equipment Assemblers 277 $27,165 $30,971
Management Analysts 230 $92,810 $88,067
Computer Programmers 228 $85,301 $78,270
Financial Analysts 160 $93,392 $89,398
Civil Engineers 126 $93,080 $84,136
Public Relations Specialists 111 $66,643 $61,984
Job openings at all skill levels fueling
Austin’s population growth
Source: EMSI
28
http://www.mindmeister.com/24358308/austin-entrepreneurship-scene
Public/private partnerships improving
Austin’s entrepreneurship ecosystem
Number of small businesses in Austin
MSA grew by 26% during 2000-
2010, compared to only 1%
nationally.Source: US Census Bureau, Statistics of US Businesses
Is everybody benefiting?
29
30
50
60
70
80
90
100
110
120
130
Williamson
Hays
Per Capita Income (US=100)
Austin’s growing prosperity is not
showing much ROI for PCI
Travis
Source: US Bureau of Economic Analysis.
31
30%
45%
73%
80%
0% 20% 40% 60% 80% 100%
Asian
White
Black or African American
Hispanic or Latino
Education inequality is a serious threat
to Austin’s economic development
% Pop Age 25+ in Austin MSA with No Completed Postsecondary Degree
Source: US Census Bureau, 2009 ACS 1-Year Estimates.
• 64% of job openings during 2013-
2023 paying a living wage for a
family of one adult and one child
($17 per hour) will require a
postsecondary degree.
• 54% (519,000) of primary working
age pop (25-64) in Austin MSA had
no postsecondary in 2009.
• Must do better job of preparing
Austin residents for new jobs.
32
Source: Living wage from CPPP http://familybudgets.org. Assumes employer-paid health care & no savings.
Workforce competitiveness is
economic, social, and growth management
issue
What can I do?
33
• Education—adopt regional SMART goal
of completed postsecondary degree for
majority of working age population.
• Inclusion—leverage Dell Medical School
opportunity to show how an innovation
driven economic development strategy
can achieve broad-based wealth gains.
• Leadership—end veteran homelessness
and reduce working poverty.
34
Austin must renew its commitment to
being the home of “big ideas”
@civicanalytics
http://civicanalytics.com
512-731-7851
brian@civicanalytics.com
Brian Kelsey, Principal & Founder
7600 Burnet Road, Suite 108
Austin, Texas 78757

Austin: Growth, Change & Promise

  • 1.
    Austin: Growth, Change& Promise April 2014
  • 2.
    1. How fastis Austin growing? 2. Where are people coming from? 3. Why is Austin so attractive? 4. Is everybody benefiting? 5. What can I do? 2 Presentation Overview
  • 3.
    How fast isAustin growing? 3
  • 4.
    4 Rank Metro Area Population 2013 PopChange 2000-13 Rate 1 Houston 6,313,158 1,595,651 34% 2 Dallas 6,810,913 1,575,528 30% 3 Atlanta 5,522,942 1,229,467 29% 4 Phoenix 4,398,762 1,125,285 34% 5 Riverside 4,380,878 1,103,856 34% 6 Washington DC 5,949,859 1,086,471 22% 7 New York 19,949,502 969,492 5% 8 Miami 5,828,191 802,296 16% 9 Los Angeles 13,131,431 738,727 6% 10 Las Vegas 2,027,868 633,959 45% 11 Austin 1,883,051 618,101 49% Population growth in Austin keeping pace with much larger regions Source: US Census Bureau, Population Estimates. Rank is among metro areas (MSA) with population of one million or more.
  • 5.
    5 Metro Area 2000-13Rank Metro Area 2009-13 Rank Raleigh 51% 1 Austin 12% 1 Austin 49% 2 Raleigh 9% 2 Las Vegas 45% 3 Houston 8% 3 Orlando 37% 4 San Antonio 8% 4 Charlotte 35% 5 Denver 7% 5 Phoenix 34% 6 Dallas 7% 6 Houston 34% 7 Orlando 7% 7 Riverside 34% 8 Washington DC 7% 8 San Antonio 32% 9 Oklahoma City 7% 9 Dallas 30% 10 Charlotte 6% 10 Austin is fastest growing large region since recession ended in 2009 Source: US Census Bureau, Population Estimates. Rank is among metro areas (MSA) with population of one million or more.
  • 6.
    6 0% 10% 20% 30% 40% 50% 60% 1940-50 1950-60 1960-701970-80 1980-90 1990-00 2000-10 City of Austin Austin MSA Population Growth by Decade, 1940-2010 Source: Ryan Robinson, City Demographer, Department of Planning, City of Austin. January 2014. Austin MSA pop growth has outpaced Austin (city) growth since 1960s
  • 7.
    7 0.9 0.8 1.5 2.0 2.2 2.1 3.5 2.8 0.0 0.5 1.0 1.5 2.0 2.5 3.0 3.5 4.0Population Growth Ratio, 1940-2014 Austin MSA / City of Austin Austin MSA adding nearly three residents for every one new resident in Austin (city) Source: Ryan Robinson, City Demographer, Department of Planning, City of Austin. January 2014.
  • 8.
    8 41% 52% 62% 63% 59% 55% 53% 46% 45% 25% 35% 45% 55% 65% 75% 19401950 1960 1970 1980 1990 2000 2010 2014 City of Austin Share of Austin MSA Population 1940-2014 Austin (city) share of Austin MSA pop appears to have stopped falling Source: Ryan Robinson, City Demographer, Department of Planning, City of Austin. January 2014.
  • 9.
    9 ZIP Pop Change 2000-10 78748 15,290 7871714,390 78732 10,431 78747 9,729 78754 9,614 78738 9,294 78744 9,114 78739 8,149 78726 6,642 78735 6,460 Fastest growing communities within Austin largely on periphery of city Source: US Census Bureau, 2010 Census. Map by ESRI.
  • 10.
    10 ZIP Pop Growth 2000-10 78738 327% 78732287% 78725 231% 78747 192% 78754 177% 78717 177% 78726 103% 78739 94% 78701 77% 78737 70% Downtown & other portions of central Austin rank highly on growth rate (%) Source: US Census Bureau, 2010 Census. Map by ESRI.
  • 11.
    Where are peoplecoming from? 11
  • 12.
    12 Majority of populationgrowth due to net migration of HHs to Austin MSA Source: US Census Bureau, Population Estimates. Rank is among all metro areas (MSA). Rank Metro Area Net Migration 2013 Share of Total Pop Growth 1 Houston 81,124 59% 2 Dallas 52,142 48% 3 Miami 42,484 65% 4 Washington DC 41,366 47% 5 Phoenix 40,451 57% 6 San Francisco 40,283 65% 7 Seattle 34,970 61% 8 Orlando 32,041 72% 9 Denver 31,404 62% 10 Austin 31,230 65% Year Net Movers Austin MSA Per Day 2013 86 2012 99 2011 97
  • 13.
    13 Majority of netmigration to Austin MSA coming from rest of U.S. Source: US Census Bureau, Population Estimates. Rank is among all metro areas (MSA). Rank Metro Area Net Migration 2013 Domestic Share International Share 1 Houston 81,124 69% 31% 2 Dallas 52,142 63% 37% 3 Miami 42,484 -24% 124% 4 Washington DC 41,366 11% 89% 5 Phoenix 40,451 79% 21% 6 San Francisco 40,283 42% 58% 7 Seattle 34,970 51% 49% 8 Orlando 32,041 54% 46% 9 Denver 31,404 84% 16% 10 Austin 31,230 83% 17%
  • 14.
    Source: Internal RevenueService. Map by Forbes showing net migration of tax filers (# of exemptions) to Travis County in 2010 tax year. 2010
  • 15.
    Source: Internal RevenueService. Map by Forbes showing net migration of tax filers (# of exemptions) to Wayne County in 2010 tax year. 2010
  • 16.
    Source: Internal RevenueService. Map by Forbes showing net migration of tax filers (# of exemptions) to Orleans Parish in 2006 tax year. 2006
  • 17.
    17 Households 2010 % Total HHs 2010 HHIncome 2010 From Texas 20,780 61% $39,340 From Different State 13,007 38% $53,751 From International 244 1% $61,746 Nonmigrants * * $62,973 Most people moving to Austin come from other parts of Texas Of the total number of federal tax filers moving to Travis County every year, just 7% come from California—i.e. 9 people, on average, compared to the 86 people moving here from other parts of Texas. Source: Internal Revenue Service. Tax returns used as proxy for households. HH income is adjusted gross income per return. 2010 tax year.
  • 18.
    18 To Travis County 2010 CountyHHs HH Inc Williamson 6,059 $41,144 Hays 1,906 $36,045 Harris 1,886 $48,573 Bexar 1,335 $37,136 Dallas 1,139 $49,426 Bastrop 734 $29,946 Tarrant 599 $45,447 Collin 425 $54,792 Bell 415 $32,248 Denton 316 $41,189 Source: Internal Revenue Service. Map by ESRI. Tax returns used as proxy for households. HH income is adjusted gross income per return. 2010 tax year.
  • 19.
    19 California is asignificant source of HH migration to Austin from other states Source: Internal Revenue Service. Tax returns used as proxy for households. HH income is adjusted gross income per return. 2010 tax year. Bold indicates origin counties with higher HH income in 2010 compared to nonmigrants in Travis County ($62,973). County HHs 2010 HH Inc 2010 Los Angeles, CA 537 $75,657 Cook, IL 369 $48,444 Maricopa, AZ 301 $47,086 San Diego, CA 267 $52,880 New York, NY 238 $84,819 King, WA 204 $65,774 Clark, NV 193 $41,217 Orange, CA 181 $78,850 Santa Clara, CA 175 $112,885 Kings, NY 166 $48,325 County HHs 2010 HH Inc 2010 San Francisco, CA 145 $108,848 Middlesex, MA 134 $71,089 Alameda, CA 127 $52,850 Washington, DC 110 $67,845 Hennepin, MN 94 $47,414 Miami-Dade, FL 89 $57,213 Multnomah, OR 89 $35,764 Bernalillo, NM 86 $44,255 Fairfax, VA 85 $138,776 Allegheny, PA 84 $50,714
  • 20.
    20 Steiner Ranch isamong most popular neighborhoods for out-of-state HHs 1. Steiner Ranch 2. Milwood/Arrowwood 3. North Burnet/Domain 4. Blackhawk/Hidden Lake 5. Canyon Creek 6. Hyde Park 7. North Loop 8. Onion Creek 9. Barton Creek/Hills 10. Old West Austin 11. Northwest Hills 12. Preston Oaks Source: US Census Bureau, American Community Survey 2007-2011, Five-Year Estimates.
  • 21.
    • Most peoplemoving to Austin come from other parts of Texas. • Most people moving to Austin from other states have lower HH income compared to existing residents. • Austin usually gains (net) residents from other large Texas counties & usually loses residents to nearby counties in the MSA (esp WilCo). 21 Migration myths stand in way of better understanding real drivers of growth Note: Austin here is shorthand for Travis County. Migration data from the IRS is not available for cities.
  • 22.
    • Generally, peoplemoving from Austin to Williamson & Hays have higher income than movers from Williamson & Hays to Austin, but lower inc than existing HHs. • HHs moving to Austin report slightly fewer dependents than HHs moving away from Austin. • More data on age, education, income, race/ethnicity available from Census http://flowsmapper.geo.census.gov 22 Migration myths stand in way of better understanding real drivers of growth Note: Austin here is shorthand for Travis County. Migration data from the IRS is not available for cities.
  • 23.
    Why is Austinso attractive? 23
  • 24.
    24 -6% -4% -2% 0% 2% 4% 6% 8% 10% 2002 2003 20042005 2006 2007 2008 2009 2010 2011 2012 US (MSA) Austin MSA Real Annual GDP Growth, 2002-12 Austin MSA Gross Domestic Product (GDP) grew by 47% between 2001 and 2012, second only to Houston MSA among metro areas with $50 billion or more. Source: US Bureau of Economic Analysis. Data adjusted for inflation (2013 Dollars). Economic growth in Austin outpacing most other U.S. regions
  • 25.
    25 Austin is leadingall large metros in job growth (%) since recession ended Source: US Bureau of Labor Statistics, Current Employment Statistics, Total Non-Farm Employment, Seasonally Adjusted. Rank is among metro areas (MSA) with employment of 500,000 or more. Rank Metro Area Employment Dec 2013 Job Growth Jun 09-Dec 13 Rate 1 Austin 863,700 105,500 13.9% 2 Nashville 819,600 98,500 13.7% 3 San Jose 951,800 96,000 11.2% 4 Houston 2,812,700 283,200 11.2% 5 Charlotte 889,600 84,900 10.6% 6 Dallas 3,135,900 278,800 9.8% 7 Salt Lake City 662,100 54,900 9.0% 8 Oklahoma City 616,800 49,900 8.8% 9 Raleigh 538,100 41,300 8.3% 10 Denver 1,288,700 92,000 7.7%
  • 26.
    26 Austin is stillcompetitive on housing affordability but the gap is closing Source: US Bureau of Labor Statistics, Current Employment Statistics, Total Non-Farm Employment, Seasonally Adjusted. Zillow, February 2014. Rank is among metro areas (MSA) with employment of 500,000 or more. Zillow rent/buy are median list prices. Rank Metro Area Job Growth Jun 09-Dec 13 Rent Per Sq Ft Central City Buy Per Sq Ft Central City 1 Austin 13.9% $1.27 $165 2 Nashville 13.7% $0.93 $105 3 San Jose 11.2% $2.15 $407 4 Houston 11.2% $1.19 $119 5 Charlotte 10.6% $0.77 $97 6 Dallas 9.8% $1.26 $132 7 Salt Lake City 9.0% $1.00 $188 8 Oklahoma City 8.8% $0.74 $90 9 Raleigh 8.3% $0.79 $114 10 Denver 7.7% $1.47 $246
  • 27.
    27 Annual Openings 2009-13 Avg Wage AustinMSA Avg Wage Nation General &Operations Managers 723 $117,208 $114,858 Registered Nurses 706 $64,334 $67,933 Software Developers, Applications 646 $98,904 $93,288 Accountants and Auditors 644 $66,602 $71,032 Postsecondary Teachers 313 $71,302 $73,798 Electronic Equipment Assemblers 277 $27,165 $30,971 Management Analysts 230 $92,810 $88,067 Computer Programmers 228 $85,301 $78,270 Financial Analysts 160 $93,392 $89,398 Civil Engineers 126 $93,080 $84,136 Public Relations Specialists 111 $66,643 $61,984 Job openings at all skill levels fueling Austin’s population growth Source: EMSI
  • 28.
    28 http://www.mindmeister.com/24358308/austin-entrepreneurship-scene Public/private partnerships improving Austin’sentrepreneurship ecosystem Number of small businesses in Austin MSA grew by 26% during 2000- 2010, compared to only 1% nationally.Source: US Census Bureau, Statistics of US Businesses
  • 29.
  • 30.
    30 50 60 70 80 90 100 110 120 130 Williamson Hays Per Capita Income(US=100) Austin’s growing prosperity is not showing much ROI for PCI Travis Source: US Bureau of Economic Analysis.
  • 31.
    31 30% 45% 73% 80% 0% 20% 40%60% 80% 100% Asian White Black or African American Hispanic or Latino Education inequality is a serious threat to Austin’s economic development % Pop Age 25+ in Austin MSA with No Completed Postsecondary Degree Source: US Census Bureau, 2009 ACS 1-Year Estimates.
  • 32.
    • 64% ofjob openings during 2013- 2023 paying a living wage for a family of one adult and one child ($17 per hour) will require a postsecondary degree. • 54% (519,000) of primary working age pop (25-64) in Austin MSA had no postsecondary in 2009. • Must do better job of preparing Austin residents for new jobs. 32 Source: Living wage from CPPP http://familybudgets.org. Assumes employer-paid health care & no savings. Workforce competitiveness is economic, social, and growth management issue
  • 33.
    What can Ido? 33
  • 34.
    • Education—adopt regionalSMART goal of completed postsecondary degree for majority of working age population. • Inclusion—leverage Dell Medical School opportunity to show how an innovation driven economic development strategy can achieve broad-based wealth gains. • Leadership—end veteran homelessness and reduce working poverty. 34 Austin must renew its commitment to being the home of “big ideas”
  • 35.