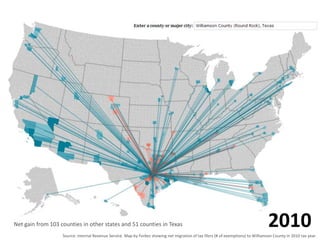
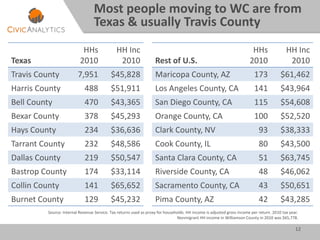
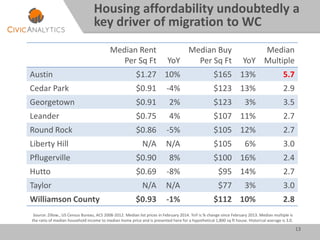
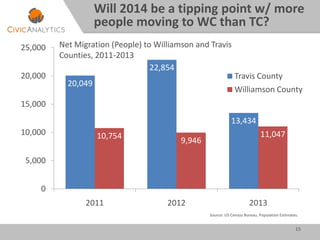
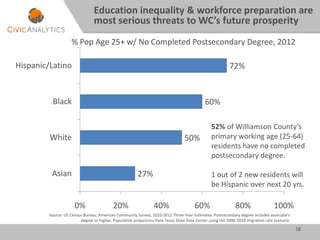
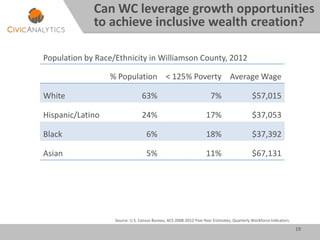
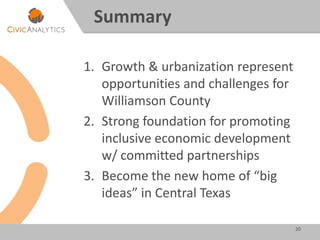
Williamson County, Texas
Changing Demographics and Implications of Growth
April 22, 2014
1. How fast is Williamson growing?
2. Where are people coming from?
3. How is the population changing?
4. What challenges are we facing?
2
Presentation Overview
Growth
3
4
-6%
-4%
-2%
0%
2%
4%
6%
8%
10%
2002 2003 2004 2005 2006 2007 2008 2009 2010 2011 2012
US (MSA)
Austin MSA
Real Annual GDP Growth, 2002-12
Austin MSA Gross Domestic Product (GDP) grew by 47% between 2001 and
2012, second only to Houston MSA among metro areas with $50 billion or more.
Source: US Bureau of Economic Analysis. Data adjusted for inflation (2013 Dollars).
Austin-Round Rock ranks #2 nationally
in total economic growth since 2001
5
Austin-Round Rock ranks #1 nationally
in job growth since 2008-09 recession
Source: US Bureau of Labor Statistics, Current Employment Statistics, Total Non-Farm Employment, Seasonally Adjusted.
Rank is among metro areas (MSA) with employment of 500,000 or more.
Rank Metro Area
Employment
Dec 2013
Job Growth
Jun 09-Dec 13 Rate
1 Austin 863,700 105,500 13.9%
2 Nashville 819,600 98,500 13.7%
3 San Jose 951,800 96,000 11.2%
4 Houston 2,812,700 283,200 11.2%
5 Charlotte 889,600 84,900 10.6%
6 Dallas 3,135,900 278,800 9.8%
7 Salt Lake City 662,100 54,900 9.0%
8 Oklahoma City 616,800 49,900 8.8%
9 Raleigh 538,100 41,300 8.3%
10 Denver 1,288,700 92,000 7.7%
• 3 of top 10 fastest growing cities
with 50K+ pop in Texas since 2010
(%): Cedar Park (#1), Georgetown
(#4), Round Rock (#10)
• Growing by about 16,000 people
per year; 30 net movers per day
• Housing units up 85% since 2000
(34% in Travis County)
6
Williamson County Growth Highlights
Source: Texas State Data Center, U.S. Census Bureau, Population Estimates, 2000 & 2010 Census.
7
Williamson County playing an increasingly
prominent role in regional growth
26%
9%
25%
32%
74%
60%
0%
10%
20%
30%
40%
50%
60%
70%
80%
90%
Travis County
Source: US Census Bureau & Ryan Robinson, City Demographer, Department of Planning, City of Austin. January 2014.
Share of MSA Population, 1900-2010
Williamson County
Migration
8
Source: Internal Revenue Service. Map by Forbes showing net migration of tax filers (# of exemptions) to Williamson County in 2010 tax year.
2010Net gain from 103 counties in other states and 51 counties in Texas
Source: Internal Revenue Service. Map by Forbes showing net migration of tax filers (# of exemptions) to Wayne County in 2010 tax year.
2010
Source: Internal Revenue Service. Map by Forbes showing net migration of tax filers (# of exemptions) to Orleans Parish in 2006 tax year.
2006
12
Most people moving to WC are from
Texas & usually Travis County
Source: Internal Revenue Service. Tax returns used as proxy for households. HH income is adjusted gross income per return. 2010 tax year.
Nonmigrant HH income in Williamson County in 2010 was $65,778.
Texas
HHs
2010
HH Inc
2010
Travis County 7,951 $45,828
Harris County 488 $51,911
Bell County 470 $43,365
Bexar County 378 $45,293
Hays County 234 $36,636
Tarrant County 232 $48,586
Dallas County 219 $50,547
Bastrop County 174 $33,114
Collin County 141 $65,652
Burnet County 129 $45,232
Rest of U.S.
HHs
2010
HH Inc
2010
Maricopa County, AZ 173 $61,462
Los Angeles County, CA 141 $43,964
San Diego County, CA 115 $54,608
Orange County, CA 100 $52,520
Clark County, NV 93 $38,333
Cook County, IL 80 $43,500
Santa Clara County, CA 51 $63,745
Riverside County, CA 48 $46,062
Sacramento County, CA 43 $50,651
Pima County, AZ 42 $43,285
13
Housing affordability undoubtedly a
key driver of migration to WC
Source: Zillow., US Census Bureau, ACS 2008-2012. Median list prices in February 2014. YoY is % change since February 2013. Median multiple is
the ratio of median household income to median home price and is presented here for a hypothetical 1,800 sq ft house. Historical average is 3.0.
Median Rent
Per Sq Ft YoY
Median Buy
Per Sq Ft YoY
Median
Multiple
Austin $1.27 10% $165 13% 5.7
Cedar Park $0.91 -4% $123 13% 2.9
Georgetown $0.91 2% $123 3% 3.5
Leander $0.75 4% $107 11% 2.7
Round Rock $0.86 -5% $105 12% 2.7
Liberty Hill N/A N/A $105 6% 3.0
Pflugerville $0.90 8% $100 16% 2.4
Hutto $0.69 -8% $95 14% 2.7
Taylor N/A N/A $77 3% 3.0
Williamson County $0.93 -1% $112 10% 2.8
14
A tale of two California invasions:
middle-income vs. high-income
Source: Internal Revenue Service. Tax returns used as proxy for households. HH income is adjusted gross income per return. 2010 tax year.
Other State County
To Williamson
HHs
2010
HH Inc
2010
Maricopa, AZ 173 $61,462
Los Angeles, CA 141 $43,964
San Diego, CA 115 $54,608
Orange, CA 100 $52,520
Clark, NV 93 $38,333
Cook, IL 80 $43,500
Santa Clara, CA 51 $63,745
Riverside, CA 48 $46,062
Sacramento, CA 43 $50,651
Pima, AZ 42 $43,285
Other State County
To Travis
HHs
2010
HH Inc
2010
Los Angeles, CA 537 $75,657
Cook, IL 369 $48,444
Maricopa, AZ 301 $47,086
San Diego, CA 267 $52,880
New York, NY 238 $84,819
King, WA 204 $65,774
Clark, NV 193 $41,217
Orange, CA 181 $78,850
Santa Clara, CA 175 $112,885
Kings, NY 166 $48,325
15
20,049
22,854
13,434
10,754
9,946
11,047
0
5,000
10,000
15,000
20,000
25,000
2011 2012 2013
Travis County
Williamson County
Net Migration (People) to Williamson and Travis
Counties, 2011-2013
Source: US Census Bureau, Population Estimates.
Will 2014 be a tipping point w/ more
people moving to WC than TC?
Change/Challenge
16
17
50
60
70
80
90
100
110
120
130
Williamson
Hays
Per Capita Income (US=100)
Living wage job growth will be critical for
incomes to keep pace w/ cost of living
Travis
Source: US Bureau of Economic Analysis.
18
27%
50%
60%
72%
0% 20% 40% 60% 80% 100%
Asian
White
Black
Hispanic/Latino
Education inequality & workforce preparation are
most serious threats to WC’s future prosperity
% Pop Age 25+ w/ No Completed Postsecondary Degree, 2012
Source: US Census Bureau, American Community Survey, 2010-2012 Three-Year Estimates. Postsecondary degree includes associate’s
degree or higher. Population projections from Texas State Data Center using the 2000-2010 migration rate scenario.
52% of Williamson County’s
primary working age (25-64)
residents have no completed
postsecondary degree.
1 out of 2 new residents will
be Hispanic over next 20 yrs.
19
% Population < 125% Poverty Average Wage
White 63% 7% $57,015
Hispanic/Latino 24% 17% $37,053
Black 6% 18% $37,392
Asian 5% 11% $67,131
Can WC leverage growth opportunities
to achieve inclusive wealth creation?
Population by Race/Ethnicity in Williamson County, 2012
Source: U.S. Census Bureau, ACS 2008-2012 Five-Year Estimates, Quarterly Workforce Indicators.
1. Growth & urbanization represent
opportunities and challenges for
Williamson County
2. Strong foundation for promoting
inclusive economic development
w/ committed partnerships
3. Become the new home of “big
ideas” in Central Texas
20
Summary
@civicanalytics
http://civicanalytics.com
512-731-7851
brian@civicanalytics.com
Brian Kelsey, Principal & Founder
7600 Burnet Road, Suite 108
Austin, Texas 78757

Williamson County, Texas: Changing Demographics and Implications of Growth

  • 1.
    Williamson County, Texas ChangingDemographics and Implications of Growth April 22, 2014
  • 2.
    1. How fastis Williamson growing? 2. Where are people coming from? 3. How is the population changing? 4. What challenges are we facing? 2 Presentation Overview
  • 3.
  • 4.
    4 -6% -4% -2% 0% 2% 4% 6% 8% 10% 2002 2003 20042005 2006 2007 2008 2009 2010 2011 2012 US (MSA) Austin MSA Real Annual GDP Growth, 2002-12 Austin MSA Gross Domestic Product (GDP) grew by 47% between 2001 and 2012, second only to Houston MSA among metro areas with $50 billion or more. Source: US Bureau of Economic Analysis. Data adjusted for inflation (2013 Dollars). Austin-Round Rock ranks #2 nationally in total economic growth since 2001
  • 5.
    5 Austin-Round Rock ranks#1 nationally in job growth since 2008-09 recession Source: US Bureau of Labor Statistics, Current Employment Statistics, Total Non-Farm Employment, Seasonally Adjusted. Rank is among metro areas (MSA) with employment of 500,000 or more. Rank Metro Area Employment Dec 2013 Job Growth Jun 09-Dec 13 Rate 1 Austin 863,700 105,500 13.9% 2 Nashville 819,600 98,500 13.7% 3 San Jose 951,800 96,000 11.2% 4 Houston 2,812,700 283,200 11.2% 5 Charlotte 889,600 84,900 10.6% 6 Dallas 3,135,900 278,800 9.8% 7 Salt Lake City 662,100 54,900 9.0% 8 Oklahoma City 616,800 49,900 8.8% 9 Raleigh 538,100 41,300 8.3% 10 Denver 1,288,700 92,000 7.7%
  • 6.
    • 3 oftop 10 fastest growing cities with 50K+ pop in Texas since 2010 (%): Cedar Park (#1), Georgetown (#4), Round Rock (#10) • Growing by about 16,000 people per year; 30 net movers per day • Housing units up 85% since 2000 (34% in Travis County) 6 Williamson County Growth Highlights Source: Texas State Data Center, U.S. Census Bureau, Population Estimates, 2000 & 2010 Census.
  • 7.
    7 Williamson County playingan increasingly prominent role in regional growth 26% 9% 25% 32% 74% 60% 0% 10% 20% 30% 40% 50% 60% 70% 80% 90% Travis County Source: US Census Bureau & Ryan Robinson, City Demographer, Department of Planning, City of Austin. January 2014. Share of MSA Population, 1900-2010 Williamson County
  • 8.
  • 9.
    Source: Internal RevenueService. Map by Forbes showing net migration of tax filers (# of exemptions) to Williamson County in 2010 tax year. 2010Net gain from 103 counties in other states and 51 counties in Texas
  • 10.
    Source: Internal RevenueService. Map by Forbes showing net migration of tax filers (# of exemptions) to Wayne County in 2010 tax year. 2010
  • 11.
    Source: Internal RevenueService. Map by Forbes showing net migration of tax filers (# of exemptions) to Orleans Parish in 2006 tax year. 2006
  • 12.
    12 Most people movingto WC are from Texas & usually Travis County Source: Internal Revenue Service. Tax returns used as proxy for households. HH income is adjusted gross income per return. 2010 tax year. Nonmigrant HH income in Williamson County in 2010 was $65,778. Texas HHs 2010 HH Inc 2010 Travis County 7,951 $45,828 Harris County 488 $51,911 Bell County 470 $43,365 Bexar County 378 $45,293 Hays County 234 $36,636 Tarrant County 232 $48,586 Dallas County 219 $50,547 Bastrop County 174 $33,114 Collin County 141 $65,652 Burnet County 129 $45,232 Rest of U.S. HHs 2010 HH Inc 2010 Maricopa County, AZ 173 $61,462 Los Angeles County, CA 141 $43,964 San Diego County, CA 115 $54,608 Orange County, CA 100 $52,520 Clark County, NV 93 $38,333 Cook County, IL 80 $43,500 Santa Clara County, CA 51 $63,745 Riverside County, CA 48 $46,062 Sacramento County, CA 43 $50,651 Pima County, AZ 42 $43,285
  • 13.
    13 Housing affordability undoubtedlya key driver of migration to WC Source: Zillow., US Census Bureau, ACS 2008-2012. Median list prices in February 2014. YoY is % change since February 2013. Median multiple is the ratio of median household income to median home price and is presented here for a hypothetical 1,800 sq ft house. Historical average is 3.0. Median Rent Per Sq Ft YoY Median Buy Per Sq Ft YoY Median Multiple Austin $1.27 10% $165 13% 5.7 Cedar Park $0.91 -4% $123 13% 2.9 Georgetown $0.91 2% $123 3% 3.5 Leander $0.75 4% $107 11% 2.7 Round Rock $0.86 -5% $105 12% 2.7 Liberty Hill N/A N/A $105 6% 3.0 Pflugerville $0.90 8% $100 16% 2.4 Hutto $0.69 -8% $95 14% 2.7 Taylor N/A N/A $77 3% 3.0 Williamson County $0.93 -1% $112 10% 2.8
  • 14.
    14 A tale oftwo California invasions: middle-income vs. high-income Source: Internal Revenue Service. Tax returns used as proxy for households. HH income is adjusted gross income per return. 2010 tax year. Other State County To Williamson HHs 2010 HH Inc 2010 Maricopa, AZ 173 $61,462 Los Angeles, CA 141 $43,964 San Diego, CA 115 $54,608 Orange, CA 100 $52,520 Clark, NV 93 $38,333 Cook, IL 80 $43,500 Santa Clara, CA 51 $63,745 Riverside, CA 48 $46,062 Sacramento, CA 43 $50,651 Pima, AZ 42 $43,285 Other State County To Travis HHs 2010 HH Inc 2010 Los Angeles, CA 537 $75,657 Cook, IL 369 $48,444 Maricopa, AZ 301 $47,086 San Diego, CA 267 $52,880 New York, NY 238 $84,819 King, WA 204 $65,774 Clark, NV 193 $41,217 Orange, CA 181 $78,850 Santa Clara, CA 175 $112,885 Kings, NY 166 $48,325
  • 15.
    15 20,049 22,854 13,434 10,754 9,946 11,047 0 5,000 10,000 15,000 20,000 25,000 2011 2012 2013 TravisCounty Williamson County Net Migration (People) to Williamson and Travis Counties, 2011-2013 Source: US Census Bureau, Population Estimates. Will 2014 be a tipping point w/ more people moving to WC than TC?
  • 16.
  • 17.
    17 50 60 70 80 90 100 110 120 130 Williamson Hays Per Capita Income(US=100) Living wage job growth will be critical for incomes to keep pace w/ cost of living Travis Source: US Bureau of Economic Analysis.
  • 18.
    18 27% 50% 60% 72% 0% 20% 40%60% 80% 100% Asian White Black Hispanic/Latino Education inequality & workforce preparation are most serious threats to WC’s future prosperity % Pop Age 25+ w/ No Completed Postsecondary Degree, 2012 Source: US Census Bureau, American Community Survey, 2010-2012 Three-Year Estimates. Postsecondary degree includes associate’s degree or higher. Population projections from Texas State Data Center using the 2000-2010 migration rate scenario. 52% of Williamson County’s primary working age (25-64) residents have no completed postsecondary degree. 1 out of 2 new residents will be Hispanic over next 20 yrs.
  • 19.
    19 % Population <125% Poverty Average Wage White 63% 7% $57,015 Hispanic/Latino 24% 17% $37,053 Black 6% 18% $37,392 Asian 5% 11% $67,131 Can WC leverage growth opportunities to achieve inclusive wealth creation? Population by Race/Ethnicity in Williamson County, 2012 Source: U.S. Census Bureau, ACS 2008-2012 Five-Year Estimates, Quarterly Workforce Indicators.
  • 20.
    1. Growth &urbanization represent opportunities and challenges for Williamson County 2. Strong foundation for promoting inclusive economic development w/ committed partnerships 3. Become the new home of “big ideas” in Central Texas 20 Summary
  • 21.