This document summarizes employment and business trends in the Atlanta region. Some key findings include:
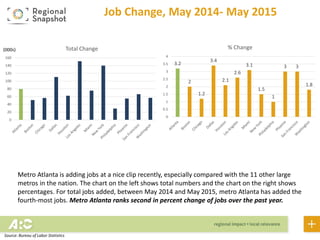
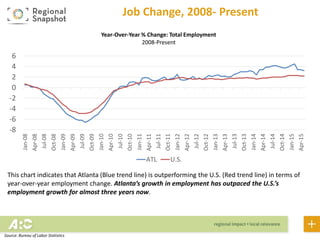
1) Atlanta ranks 2nd among 12 major metros in relative job growth over the past year, adding jobs at a faster rate than the national average.
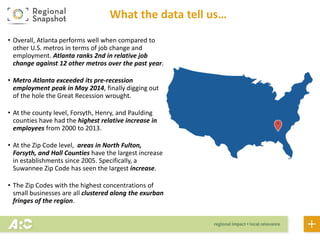
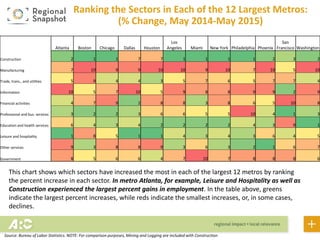
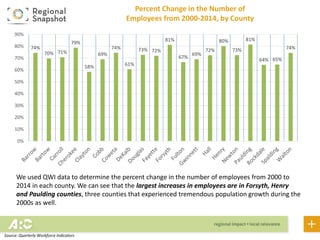
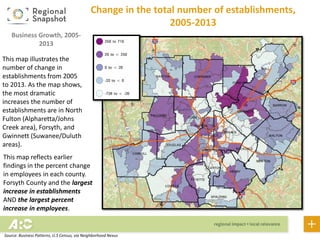
2) Several outer suburban counties like Forsyth, Henry, and Paulding have seen the largest increases in employees and business establishments since 2000, experiencing strong population and economic growth.
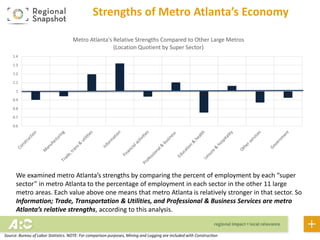
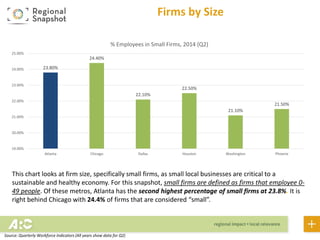
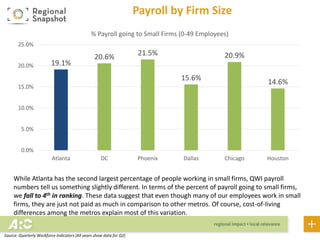
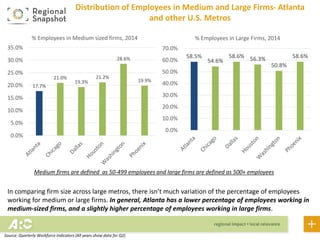
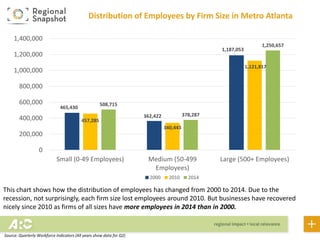
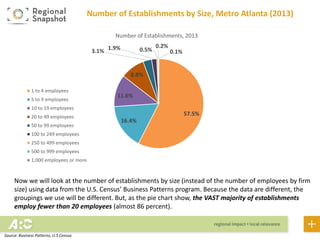
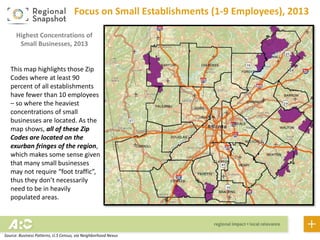
3) Small businesses, defined as having 0-49 employees, make up around 24% of all businesses in Atlanta and are clustered in exurban areas, though they receive a smaller share of total payroll compared to other major cities.
Trends in the Atlanta Region and Buckhead — Demographics and Growth Seminar –...Livable Buckhead / BATMA
Livable Buckhead, in partnership with The Atlanta Regional Commission (ARC), presented comprehensive demographic and growth trends analysis for the Atlanta Region and Buckhead. ARC Research Division Chief, Mike Alexander, provided information on population growth, employment forecasts, job assessments, housing, transportation and more.
Population estimates for the major jurisdictions in the 10-county Atlanta region is one of ARC's signature products. This presents ARC's 2013 population estimates which show the region added 40,100 new residents over the past year.
This month's Regional Snapshot explores ARC’s annual population estimates for 2014 to assess how we are recovering from the slowdown we experienced during the Great Recession.
Regional Snapshot: ARC Employment Centers: Core Locations for Jobs, not for A...ARCResearch
This month’s Regional Snapshot picks up where the July Regional Snapshot on Affordable Housing left off. In the October Regional Snapshot we take a deeper dive into affordable housing data, mapping it onto our region’s employment centers in an effort to visualize the relationship between housing affordability and concentrations of regional employment.
An overview of the economy (including job growth by sectors, consumer spending, inflation, wages, and real estate) on the cusp of 2022, after two years of COVID impacts
RS Working on the Workforce Sept 2019 To PostARCResearch
workforce data for regional plans and grant-funded projects. In this presentation, staff present summary findings from some of the data work done for the Worksource Regional Plan, Metro Atlanta Workforce Exchange (MAX), and National Workforce Fund Economic Mobility Grant (EMG) projects, as well as share plans for further future analysis.
The Graying Job Market in the Atlanta Region & The Economic Impact This PortendsARCResearch
Not only is the population growing older, so is the workforce. This simple fact has vast ramifications for the region as the 65 and older age cohort is increasing its economic strength by staying in the workforce longer and earning more while doing it.
Minneapolis–St. Paul Employment Update | September 2016Carolyn Bates
Minneapolis-St. Paul has the second-lowest unemployment rate in the nation among all large metros, according to the most recent BLS estimates.
Financial services has reached its largest-ever employment count in MSP. The sector has seen steady gains since 2010 and even surpassed pre-Recession highs earlier this year. And once again, MSP achieved record-breaking employment totals for professional and business services, a fundamental component to the metro’s economic growth. Nearly 6,000 jobs have been added in the industry year-over-year.
Nationwide, 151,000 net new jobs were created in August, falling below the 250,000+ monthly additions over the previous two months. Although still at average levels of growth, August demonstrated the continued volatility of the labor market in 2016. Unemployment remained stable at 4.9 percent as growth in the workforce has aligned with employment gains. The Federal Reserve is likely to hold off on the next rate hike due to inconsistent monthly additions and weaker-than-expected wage growth.
Minneapolis–St. Employment Update | March 2016Carolyn Bates
Minneapolis-St. Paul’s unemployment rose to 3.9 percent, according to the most recent estimates available from the BLS. Although still 100 basis points lower than the national rate, this month is the first time since July 2015 that the metro unemployment rate is higher than the state of Minnesota’s.
Industrial sectors were responsible for 26.7 percent of the 12-month total employment growth, outperforming office-using sectors which saw 19.6 percent of total growth. Trade, transportation, and utilities added 3,200 jobs year-over-year and drove the bulk of industrial growth throughout 2015.
Although national year-to-date figures are down compared to 2015, January saw significant upward revisions to 172,000 jobs, improving the year’s initial performance. Despite global tensions and economic shifts, the U.S. economy seems to be holding its own, although certain sectors such as energy and trade could be impacted by fluctuations in domestic and international demand.
U.S. employment update and outlook: December 2014JLL
November gain of 321,000 jobs confirms the strength of the recovery
The U.S. economy saw the growth of an additional 321,000 net new jobs in November. With revisions of earlier months' data, makes November the ninth consecutive month with gains surpassing 200,000 jobs.
Unemployment remained steady from the previous month at 5.8 percent. Total unemployment—which includes detached workers—dropped by 10 basis points to a recovery low of 11.4 percent, as the number of marginally detached workers slowly declines.
See more economic, office and real estate research at http://bit.ly/1s2tk4M
This presentation will provide, for the start of 2020, an overview of some of the most relevant trends in our metro economy- topics will include trends in gross domestic product for peer metros, job growth by sector, changes in wage levels, trends in residential permitting, and current forecasts.
U.S. employment update and outlook: October 2014JLL
Unemployment dips to 5.9 percent in September—its first time below 6.0 percent during the recovery.
The U.S. economy got back on track in September, bouncing back from a sluggish August with 248,000 net new jobs. Growth occurred across sectors and geographies, with office-using industries in particular benefiting from improved corporate confidence leading to permanent hiring.
Total unemployment, which includes discouraged and marginally detached workers, also declined slightly to 11.8 percent, bringing it below the 10-year average.
With numerous other employment metrics all pointing up—including job openings, voluntary quits and CEO confidence—sentiment will only become more optimistic over the coming months.
See more real estate and economic research at: http://bit.ly/1vIGt6m
This month’s Regional Snapshot provides an overview of the most relevant trends in our metro economy- topics include job growth by sector, changes in wage levels, and trends in residential and commercial (by type) permit and construction activity.
MC_forecasts_finals series 17_feb2024.pdfARCResearch
Final summary slide deck for Series 17 population, employment by sector, age group forecasts for MPO region, counties, and smaller areas...February 2024
33N Blog Housing MAS 2023 Slide DeckpdfARCResearch
Results of housing-related questions from the 2023 Metro Atlanta Speaks survey--focus on affordability locally and regionally, as well as on policy perceptions
Memorandum Of Association Constitution of Company.pptseri bangash
www.seribangash.com
A Memorandum of Association (MOA) is a legal document that outlines the fundamental principles and objectives upon which a company operates. It serves as the company's charter or constitution and defines the scope of its activities. Here's a detailed note on the MOA:
Contents of Memorandum of Association:
Name Clause: This clause states the name of the company, which should end with words like "Limited" or "Ltd." for a public limited company and "Private Limited" or "Pvt. Ltd." for a private limited company.
https://seribangash.com/article-of-association-is-legal-doc-of-company/
Registered Office Clause: It specifies the location where the company's registered office is situated. This office is where all official communications and notices are sent.
Objective Clause: This clause delineates the main objectives for which the company is formed. It's important to define these objectives clearly, as the company cannot undertake activities beyond those mentioned in this clause.
www.seribangash.com
Liability Clause: It outlines the extent of liability of the company's members. In the case of companies limited by shares, the liability of members is limited to the amount unpaid on their shares. For companies limited by guarantee, members' liability is limited to the amount they undertake to contribute if the company is wound up.
https://seribangash.com/promotors-is-person-conceived-formation-company/
Capital Clause: This clause specifies the authorized capital of the company, i.e., the maximum amount of share capital the company is authorized to issue. It also mentions the division of this capital into shares and their respective nominal value.
Association Clause: It simply states that the subscribers wish to form a company and agree to become members of it, in accordance with the terms of the MOA.
Importance of Memorandum of Association:
Legal Requirement: The MOA is a legal requirement for the formation of a company. It must be filed with the Registrar of Companies during the incorporation process.
Constitutional Document: It serves as the company's constitutional document, defining its scope, powers, and limitations.
Protection of Members: It protects the interests of the company's members by clearly defining the objectives and limiting their liability.
External Communication: It provides clarity to external parties, such as investors, creditors, and regulatory authorities, regarding the company's objectives and powers.
https://seribangash.com/difference-public-and-private-company-law/
Binding Authority: The company and its members are bound by the provisions of the MOA. Any action taken beyond its scope may be considered ultra vires (beyond the powers) of the company and therefore void.
Amendment of MOA:
While the MOA lays down the company's fundamental principles, it is not entirely immutable. It can be amended, but only under specific circumstances and in compliance with legal procedures. Amendments typically require shareholder
Implicitly or explicitly all competing businesses employ a strategy to select a mix
of marketing resources. Formulating such competitive strategies fundamentally
involves recognizing relationships between elements of the marketing mix (e.g.,
price and product quality), as well as assessing competitive and market conditions
(i.e., industry structure in the language of economics).
Attending a job Interview for B1 and B2 Englsih learnersErika906060
It is a sample of an interview for a business english class for pre-intermediate and intermediate english students with emphasis on the speking ability.
Kseniya Leshchenko: Shared development support service model as the way to ma...Lviv Startup Club
Kseniya Leshchenko: Shared development support service model as the way to make small projects with small budgets profitable for the company (UA)
Kyiv PMDay 2024 Summer
Website – www.pmday.org
Youtube – https://www.youtube.com/startuplviv
FB – https://www.facebook.com/pmdayconference
RMD24 | Retail media: hoe zet je dit in als je geen AH of Unilever bent? Heid...BBPMedia1
Grote partijen zijn al een tijdje onderweg met retail media. Ondertussen worden in dit domein ook de kansen zichtbaar voor andere spelers in de markt. Maar met die kansen ontstaan ook vragen: Zelf retail media worden of erop adverteren? In welke fase van de funnel past het en hoe integreer je het in een mediaplan? Wat is nu precies het verschil met marketplaces en Programmatic ads? In dit half uur beslechten we de dilemma's en krijg je antwoorden op wanneer het voor jou tijd is om de volgende stap te zetten.
Skye Residences | Extended Stay Residences Near Toronto Airportmarketingjdass
Experience unparalleled EXTENDED STAY and comfort at Skye Residences located just minutes from Toronto Airport. Discover sophisticated accommodations tailored for discerning travelers.
Website Link :
https://skyeresidences.com/
https://skyeresidences.com/about-us/
https://skyeresidences.com/gallery/
https://skyeresidences.com/rooms/
https://skyeresidences.com/near-by-attractions/
https://skyeresidences.com/commute/
https://skyeresidences.com/contact/
https://skyeresidences.com/queen-suite-with-sofa-bed/
https://skyeresidences.com/queen-suite-with-sofa-bed-and-balcony/
https://skyeresidences.com/queen-suite-with-sofa-bed-accessible/
https://skyeresidences.com/2-bedroom-deluxe-queen-suite-with-sofa-bed/
https://skyeresidences.com/2-bedroom-deluxe-king-queen-suite-with-sofa-bed/
https://skyeresidences.com/2-bedroom-deluxe-queen-suite-with-sofa-bed-accessible/
#Skye Residences Etobicoke, #Skye Residences Near Toronto Airport, #Skye Residences Toronto, #Skye Hotel Toronto, #Skye Hotel Near Toronto Airport, #Hotel Near Toronto Airport, #Near Toronto Airport Accommodation, #Suites Near Toronto Airport, #Etobicoke Suites Near Airport, #Hotel Near Toronto Pearson International Airport, #Toronto Airport Suite Rentals, #Pearson Airport Hotel Suites
LA HUG - Video Testimonials with Chynna Morgan - June 2024Lital Barkan
Have you ever heard that user-generated content or video testimonials can take your brand to the next level? We will explore how you can effectively use video testimonials to leverage and boost your sales, content strategy, and increase your CRM data.🤯
We will dig deeper into:
1. How to capture video testimonials that convert from your audience 🎥
2. How to leverage your testimonials to boost your sales 💲
3. How you can capture more CRM data to understand your audience better through video testimonials. 📊
[Note: This is a partial preview. To download this presentation, visit:
https://www.oeconsulting.com.sg/training-presentations]
Sustainability has become an increasingly critical topic as the world recognizes the need to protect our planet and its resources for future generations. Sustainability means meeting our current needs without compromising the ability of future generations to meet theirs. It involves long-term planning and consideration of the consequences of our actions. The goal is to create strategies that ensure the long-term viability of People, Planet, and Profit.
Leading companies such as Nike, Toyota, and Siemens are prioritizing sustainable innovation in their business models, setting an example for others to follow. In this Sustainability training presentation, you will learn key concepts, principles, and practices of sustainability applicable across industries. This training aims to create awareness and educate employees, senior executives, consultants, and other key stakeholders, including investors, policymakers, and supply chain partners, on the importance and implementation of sustainability.
LEARNING OBJECTIVES
1. Develop a comprehensive understanding of the fundamental principles and concepts that form the foundation of sustainability within corporate environments.
2. Explore the sustainability implementation model, focusing on effective measures and reporting strategies to track and communicate sustainability efforts.
3. Identify and define best practices and critical success factors essential for achieving sustainability goals within organizations.
CONTENTS
1. Introduction and Key Concepts of Sustainability
2. Principles and Practices of Sustainability
3. Measures and Reporting in Sustainability
4. Sustainability Implementation & Best Practices
To download the complete presentation, visit: https://www.oeconsulting.com.sg/training-presentations
VAT Registration Outlined In UAE: Benefits and Requirementsuae taxgpt
Vat Registration is a legal obligation for businesses meeting the threshold requirement, helping companies avoid fines and ramifications. Contact now!
https://viralsocialtrends.com/vat-registration-outlined-in-uae/
The world of search engine optimization (SEO) is buzzing with discussions after Google confirmed that around 2,500 leaked internal documents related to its Search feature are indeed authentic. The revelation has sparked significant concerns within the SEO community. The leaked documents were initially reported by SEO experts Rand Fishkin and Mike King, igniting widespread analysis and discourse. For More Info:- https://news.arihantwebtech.com/search-disrupted-googles-leaked-documents-rock-the-seo-world/
Affordable Stationery Printing Services in Jaipur | Navpack n PrintNavpack & Print
Looking for professional printing services in Jaipur? Navpack n Print offers high-quality and affordable stationery printing for all your business needs. Stand out with custom stationery designs and fast turnaround times. Contact us today for a quote!
Business Valuation Principles for EntrepreneursBen Wann
This insightful presentation is designed to equip entrepreneurs with the essential knowledge and tools needed to accurately value their businesses. Understanding business valuation is crucial for making informed decisions, whether you're seeking investment, planning to sell, or simply want to gauge your company's worth.
What are the main advantages of using HR recruiter services.pdfHumanResourceDimensi1
HR recruiter services offer top talents to companies according to their specific needs. They handle all recruitment tasks from job posting to onboarding and help companies concentrate on their business growth. With their expertise and years of experience, they streamline the hiring process and save time and resources for the company.
Putting the SPARK into Virtual Training.pptxCynthia Clay
This 60-minute webinar, sponsored by Adobe, was delivered for the Training Mag Network. It explored the five elements of SPARK: Storytelling, Purpose, Action, Relationships, and Kudos. Knowing how to tell a well-structured story is key to building long-term memory. Stating a clear purpose that doesn't take away from the discovery learning process is critical. Ensuring that people move from theory to practical application is imperative. Creating strong social learning is the key to commitment and engagement. Validating and affirming participants' comments is the way to create a positive learning environment.
July Snapshot: Employment Trends & Establishment Growth in Metro Atlanta
1. Atlanta Regional Commission
For more information, contact:
mcarnathan@atlantaregional.com
All Things Big and Small:
Employment Trends & Business
Establishment Growth in Metro
Atlanta
2. About the Data
• Bureau of Labor Statistics (BLS): We used BLS data to explore up to date
industry sector change in Atlanta and the U.S. as a whole.
• Quarterly Workforce Indicators (QWI): A set of economic indicators
including employment, job creating, earnings, and other measures of
employment flows. We have used the QWI to study and compare business
and employment patterns in metro Atlanta to other peer metro areas.
• Zip Code Business Patterns: We used Census business establishment/ firm
numbers to look at total establishments and change in establishments on
the Zip Code level.
Note: We mention both firms and establishments numerous times throughout the report. There are subtle differences, but, in general, when using these
terms, we simply mean “businesses.” To learn more about the difference between firms and establishments, please visit:
https://ask.census.gov/faq.php?id=5000&faqId=487
3. What the data tell us…
• Overall, Atlanta performs well when compared to
other U.S. metros in terms of job change and
employment. Atlanta ranks 2nd in relative job
change against 12 other metros over the past year.
• Metro Atlanta exceeded its pre-recession
employment peak in May 2014, finally digging out
of the hole the Great Recession wrought.
• At the county level, Forsyth, Henry, and Paulding
counties have had the highest relative increase in
employees from 2000 to 2013.
• At the Zip Code level, areas in North Fulton,
Forsyth, and Hall Counties have the largest increase
in business establishments since 2005. Specifically, a
Suwanee Zip Code has seen the largest increase.
• The Zip Codes with the highest concentrations of
small businesses are all clustered along the exurban
fringes of the region.
4. 0
20
40
60
80
100
120
140
160
Total Change
3.2
2
1.2
3.4
2.1
2.6
3.1
1.5
1
3 3
1.8
0
0.5
1
1.5
2
2.5
3
3.5
4
% Change(000s)
Job Change, May 2014- May 2015
Metro Atlanta is adding jobs at a nice clip recently, especially compared with the 11 other large
metros in the nation. The chart on the left shows total numbers and the chart on the right shows
percentages. For total jobs added, between May 2014 and May 2015, metro Atlanta has added the
fourth-most jobs. Metro Atlanta ranks second in percent change of jobs over the past year.
Source: Bureau of Labor Statistics
5. 0.6
0.7
0.8
0.9
1
1.1
1.2
1.3
1.4
Metro Atlanta's Relative Strengths Compared to Other Large Metros
(Location Quotient by Super Sector)
Strengths of Metro Atlanta’s Economy
We examined metro Atlanta’s strengths by comparing the percent of employment by each “super
sector” in metro Atlanta to the percentage of employment in each sector in the other 11 large
metro areas. Each value above one means that metro Atlanta is relatively stronger in that sector. So
Information; Trade, Transportation & Utilities, and Professional & Business Services are metro
Atlanta’s relative strengths, according to this analysis.
Source: Bureau of Labor Statistics. NOTE: For comparison purposes, Mining and Logging are included with Construction
6. Atlanta Boston Chicago Dallas Houston
Los
Angeles Miami New York Philadelphia Phoenix
San
Francisco Washington
Construction 2 1 1 7 7 1 1 1 1 2 3 2
Manufacturing 7 10 9 9 10 10 9 10 7 10 5 10
Trade, trans., and utilities 5 9 4 4 3 5 7 6 5 7 7 4
Information 10 5 7 10 5 9 8 8 9 9 2 9
Financial activities 4 7 9 2 8 8 3 8 6 5 10 8
Professional and bus. services 3 2 2 3 6 6 5 5 10 4 1 3
Education and health services 6 4 3 4 2 2 2 2 4 3 9 1
Leisure and hospitality 1 8 5 1 1 4 3 4 3 6 4 5
Other services 9 3 8 8 9 3 6 3 2 1 6 7
Government 8 5 6 6 4 7 10 7 8 8 8 6
Ranking the Sectors in Each of the 12 Largest Metros:
(% Change, May 2014-May 2015)
This chart shows which sectors have increased the most in each of the largest 12 metros by ranking
the percent increase in each sector. In metro Atlanta, for example, Leisure and Hospitality as well as
Construction experienced the largest percent gains in employment. In the table above, greens
indicate the largest percent increases, while reds indicate the smallest increases, or, in some cases,
declines.
Source: Bureau of Labor Statistics. NOTE: For comparison purposes, Mining and Logging are included with Construction
8. This shows total employment in metro Atlanta from January 2000 to May 2015. The pre-recession peak
employment of 2.48 million jobs occurred in December 2007, the month the Great Recession officially
began. Metro Atlanta exceeded that pre-recession peak in May 2014, and today is trading well above
the December 2007 number.
Total Employment, 2000-2015
Source: Bureau of Labor Statistics
2000.0
2100.0
2200.0
2300.0
2400.0
2500.0
2600.0
2700.0
Jan-00
May-00
Sep-00
Jan-01
May-01
Sep-01
Jan-02
May-02
Sep-02
Jan-03
May-03
Sep-03
Jan-04
May-04
Sep-04
Jan-05
May-05
Sep-05
Jan-06
May-06
Sep-06
Jan-07
May-07
Sep-07
Jan-08
May-08
Sep-08
Jan-09
May-09
Sep-09
Jan-10
May-10
Sep-10
Jan-11
May-11
Sep-11
Jan-12
May-12
Sep-12
Jan-13
May-13
Sep-13
Jan-14
May-14
Sep-14
Jan-15
May-15
Pre-recession peak
employment:
December 2007
9. This chart looks at business firm size, specifically small firms, as small local businesses are critical to a
sustainable and healthy economy. For this snapshot, small business firms are defined as firms with 0-
49 employees. Of these metros, Atlanta has the second highest percentage of small firms at 23.8%. It
is right behind Chicago with 24.4% of firms that are considered “small”.
Business Firms by Size
23.80%
24.40%
22.10%
22.50%
21.10%
21.50%
19.00%
20.00%
21.00%
22.00%
23.00%
24.00%
25.00%
Atlanta Chicago Dallas Houston Washington Phoenix
% Employees in Small Business Firms, 2014 (Q2)
Source: Quarterly Workforce Indicators (All years show data for Q2)
10. Payroll by Business Firm Size
19.1%
20.6% 21.5%
15.6%
20.9%
14.6%
0.0%
5.0%
10.0%
15.0%
20.0%
25.0%
Atlanta DC Phoenix Dallas Chicago Houston
% Payroll going to Small Business Firms (0-49 Employees)
While Atlanta has the second largest percentage of people working in small business firms, QWI
payroll numbers tell us something slightly different. In terms of the percent of payroll going to small
firms, we fall to 4th in ranking. These data suggest that even though many of our employees work in
small firms, they are just not paid as much in comparison to other metros. Of course, cost-of-living
differences among the metros explain most of this variation.
Source: Quarterly Workforce Indicators (All years show data for Q2)
11. 17.7%
21.0%
19.3%
21.2%
28.6%
19.9%
0.0%
5.0%
10.0%
15.0%
20.0%
25.0%
30.0%
35.0%
% Employees in Medium Sized Business firms,
2014
58.5%
54.6%
58.6% 56.3%
50.8%
58.6%
0.0%
10.0%
20.0%
30.0%
40.0%
50.0%
60.0%
70.0%
% Employees in Large Business Firms, 2014
Distribution of Employees in Medium and Large Business Firms-
Atlanta and other U.S. Metros
Medium Business firms are defined as 50-499 employees and large business firms are defined as 500+ employees
In comparing business firm size across large metros, there isn’t much variation of the percentage of
employees working for medium or large firms. In general, Atlanta has a lower percentage of employees
working in medium-sized firms, and a slightly higher percentage of employees working in large firms.
Source: Quarterly Workforce Indicators (All years show data for Q2)
12. Distribution of Employees by Business Firm Size in Metro Atlanta
This chart shows how the distribution of employees has changed from 2000 to 2014. Due to the
recession, not surprisingly, each firm size lost employees around 2010. But businesses have recovered
nicely since 2010 as firms of all sizes have more employees in 2014 than in 2000.
465,430
362,422
1,187,053
457,285
340,443
1,121,817
508,715
378,287
1,250,657
0
200,000
400,000
600,000
800,000
1,000,000
1,200,000
1,400,000
Small (0-49 Employees) Medium (50-499
Employees)
Large (500+ Employees)
2000 2010 2014
Source: Quarterly Workforce Indicators (All years show data for Q2)
13. Percent Change in the Number of
Employees from 2000-2014, by County
74%
70% 71%
79%
58%
69%
74%
61%
73% 72%
81%
67%
69%
72%
80%
73%
81%
64% 65%
74%
0%
10%
20%
30%
40%
50%
60%
70%
80%
90%
We used QWI data to determine the percent change in the number of employees from 2000 to
2014 in each county. We can see that the largest increases in employees are in Forsyth, Henry
and Paulding counties, three counties that experienced tremendous population growth during the
2000s as well.
Source: Quarterly Workforce Indicators
14. Now we will look at the number of business establishments by size (instead of the number of employees
by business firm size) using data from the U.S. Census’ Business Patterns program. Because the data are
different, the groupings we use will be different. But, as the pie chart shows, the VAST majority of
business establishments employ fewer than 20 employees (almost 86 percent).
57.5%
16.4%
11.6%
8.8%
3.1%
1.9%
0.5%
0.2% 0.1%
Number of Business Establishments, 2013
1 to 4 employees
5 to 9 employees
10 to 19 employees
20 to 49 employees
50 to 99 employees
100 to 249 employees
250 to 499 employees
500 to 999 employees
1,000 employees or more
Number of Business Establishments by Size, Metro Atlanta (2013)
Source: Business Patterns, U.S Census
15. Because the definition of metro Atlanta changed in 2012, we can only look at growth in the number of
business establishments between 2012 and 2013. As the chart and table show, there isn’t a lot of
difference in the rates of growth among the different business establishment sizes, although those
employing one to four employees had the slowest rate of growth.
Change in the Number of Business Establishments by Size,
Metro Atlanta, 2012 - 2013
0.8%
1.1%
1.6%
0.0%
1.0%
2.0%
3.0%
4.0%
5.0%
1 to 4 employees 5 to 9 employees All Other Establishment Sizes
Percent Change in the Number of Business Establishments
2013 2012 Change % Change
1 to 4 employees 75,789 75,168 621 0.8%
5 to 9 employees 21,617 21,387 230 1.1%
All Other Establishment Sizes 34,377 33,834 543 1.6%
Source: Business Patterns, U.S Census
16. 129,130
133,087
136,724
134,338
129,429
128,177
127,305
129,287
130,704
122,000
124,000
126,000
128,000
130,000
132,000
134,000
136,000
138,000
2005 2006 2007 2008 2009 2010 2011 2012 2013
This chart analyzes the total number of business establishments in the 20-county Atlanta region
between 2005-2013. As the line shows, the Great Recession destroyed many business establishments,
and the 20-county area has yet to recover. There are roughly 6,000 fewer establishments today than in
2007. The good news, however, is that there are about 3,400 more establishments today than during
the nadir of 2011.
* Zip Codes do not adhere to county boundaries, so we included only Zip Codes that have their center point in one of the 20 counties.
Total number of Business Establishments in 20-
County Atlanta Region Zip Codes*: 2005-2013
Source: Business Patterns, U.S Census
17. Distribution of Business Establishments, by Zip Code
The map on the left shows the total number of business establishments in 2013, with the bulk of the establishments
located in the northern parts of the region, between I-75 and I-85. There is a Zip Code in Henry County that has among
the most number of establishments in the region as well. The map on the right shows the number of establishments
per 1,000 people. Although there isn’t much difference between the two, the areas with the most establishments per
1,000 people are clustered in the region’s most affluent areas (North Fulton, Buckhead, Decatur and Fayette County).
Total Business Establishments, 2013
Total Business Establishments per 1,000
Population, 2013
Source: Business Patterns, U.S Census, via Neighborhood Nexus
18. Change in the total number of Business Establishments,
2005-2013
This map illustrates the
number of change in
business establishments
from 2005 to 2013. As the
map shows, the most
dramatic increases the
number of establishments
are in North Fulton
(Alpharetta/Johns Creek
area), Forsyth, and
Gwinnett (Suwanee/Duluth
areas).
This map reflects earlier
findings in the percent change
in employees in each county.
Forsyth County and the largest
increase in establishments
AND the largest percent
increase in employees.
Business Growth, 2005-
2013
Source: Business Patterns, U.S Census, via Neighborhood Nexus
19. Focus on small Business Establishments (1-9
Employees), 2013
This map highlights those Zip
Codes where at least 90
percent of all business
establishments have fewer
than 10 employees – so where
the heaviest concentrations of
small businesses are located.
As the map shows, all of these
Zip Codes are located on the
exurban fringes of the region,
which makes some sense given
that many small businesses
may not require “foot traffic”,
thus they don’t necessarily
need to be in heavily
populated areas.
Highest Concentrations of
Small Businesses, 2013
Source: Business Patterns, U.S Census, via Neighborhood Nexus