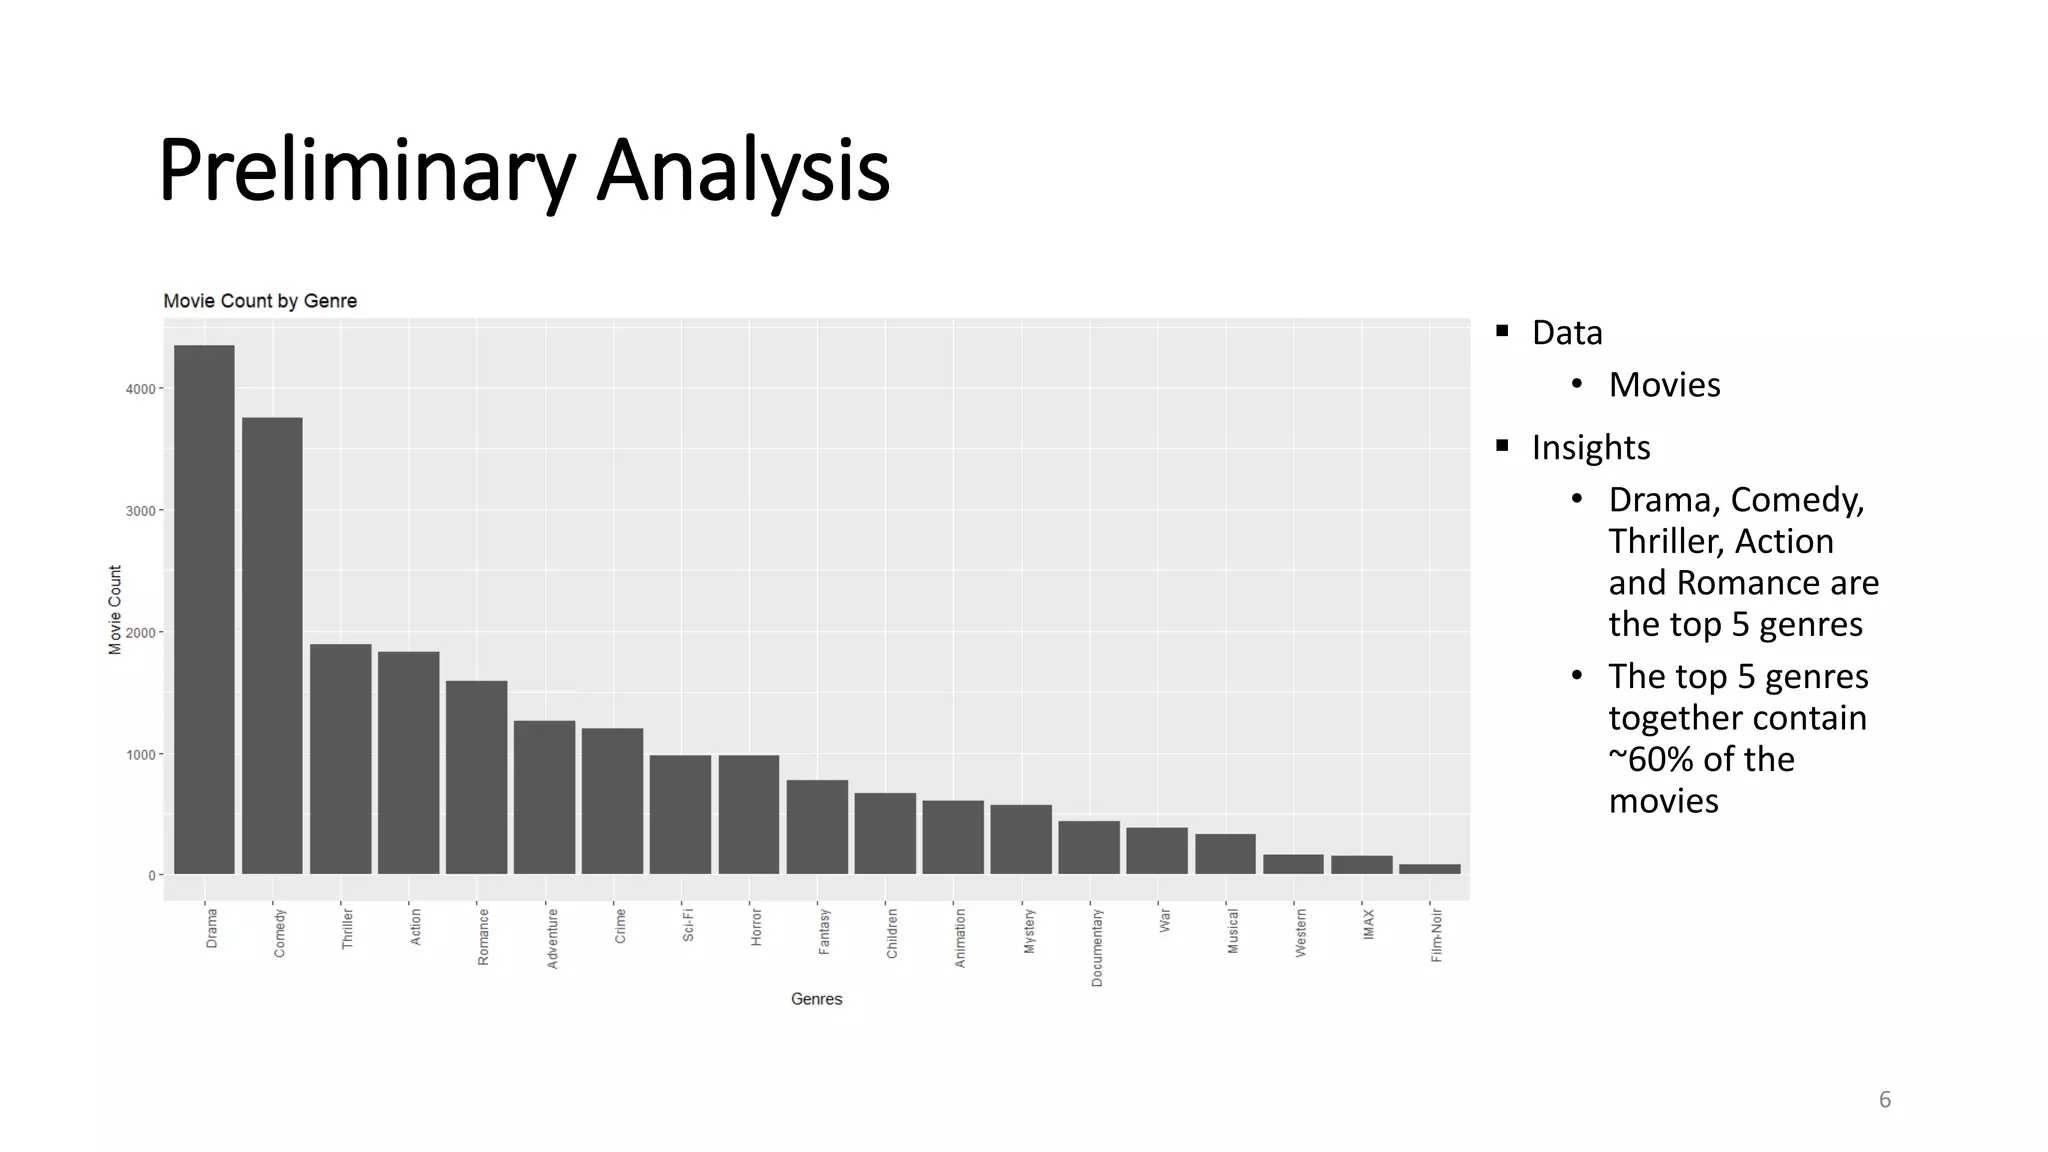
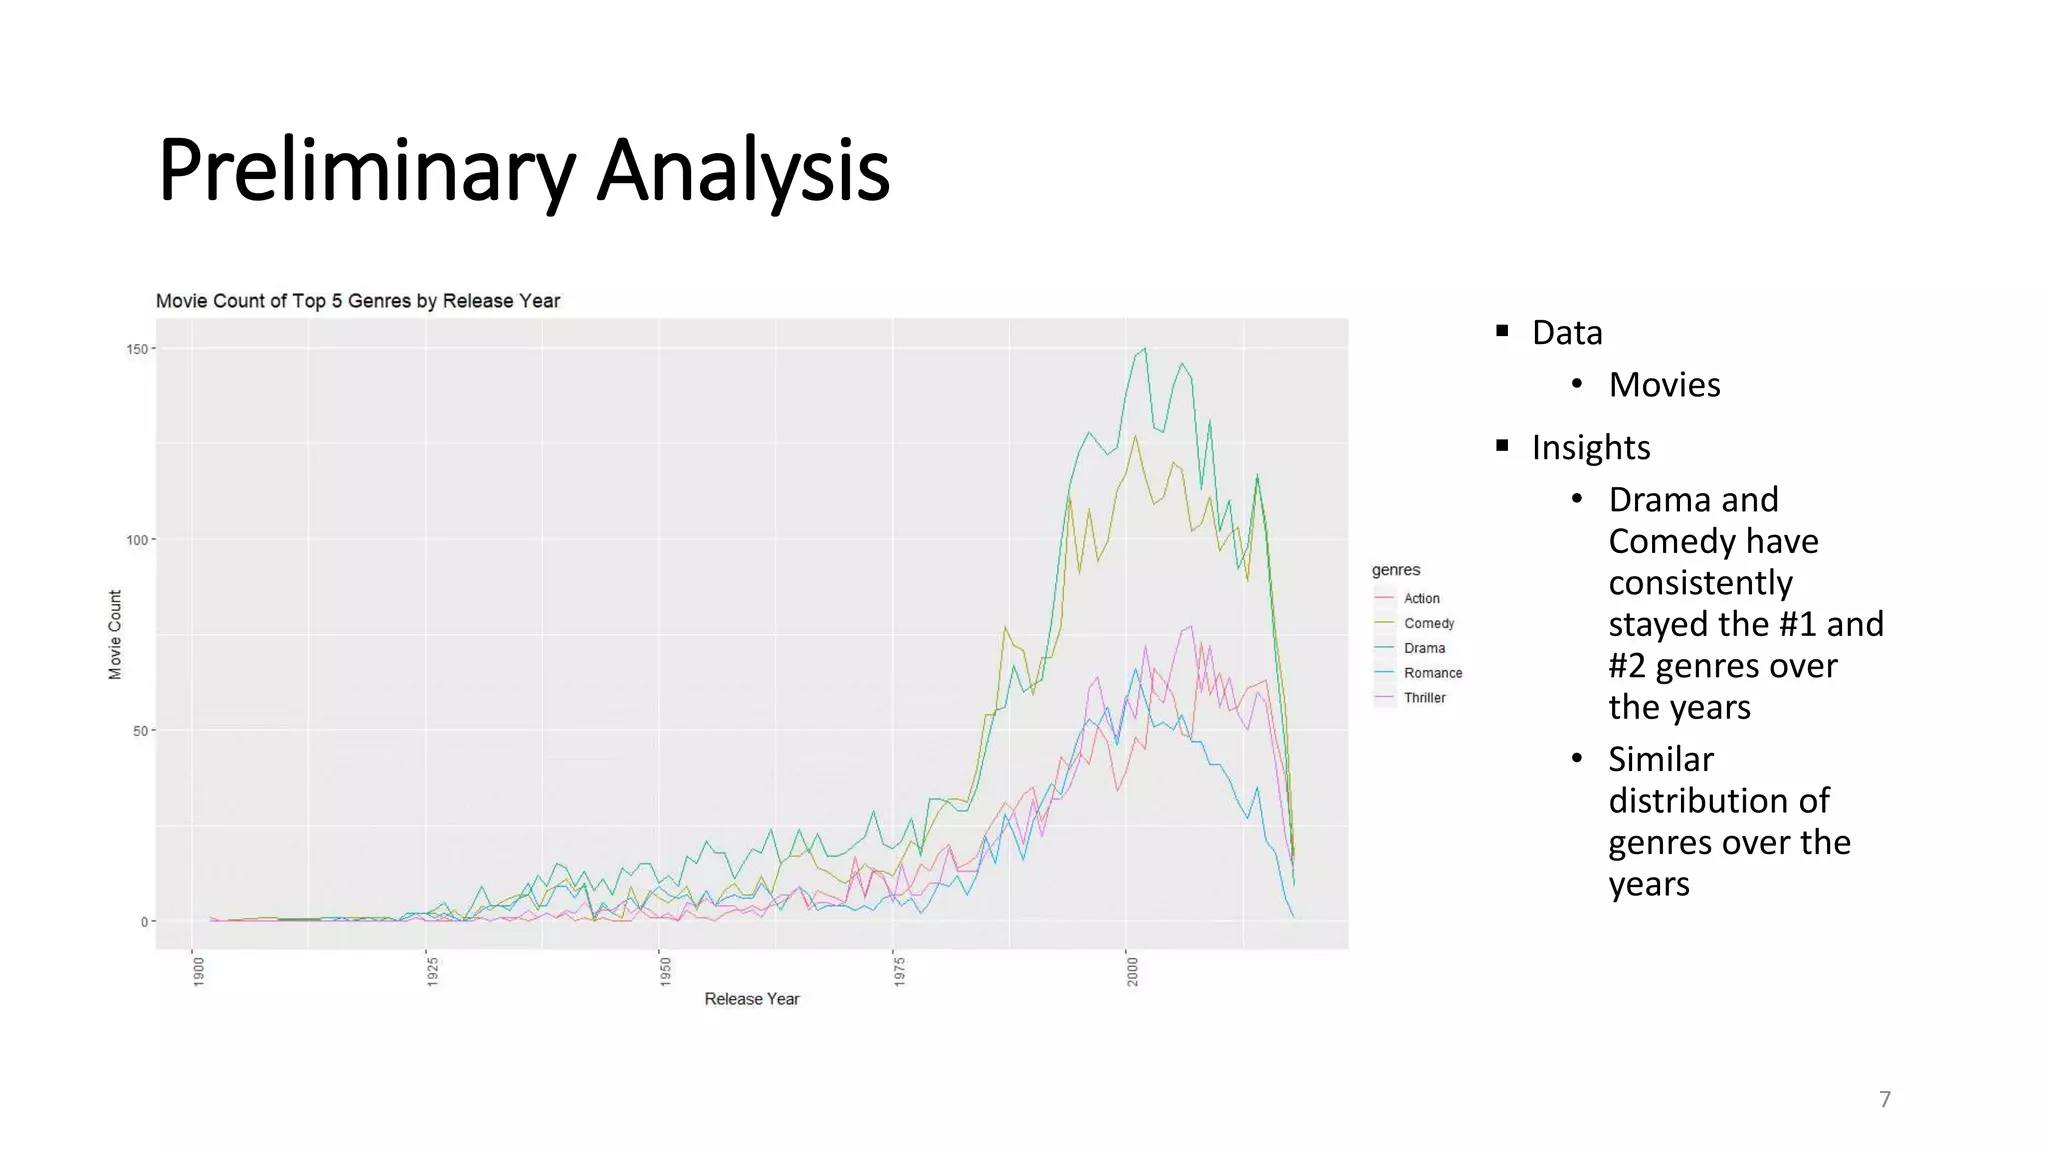
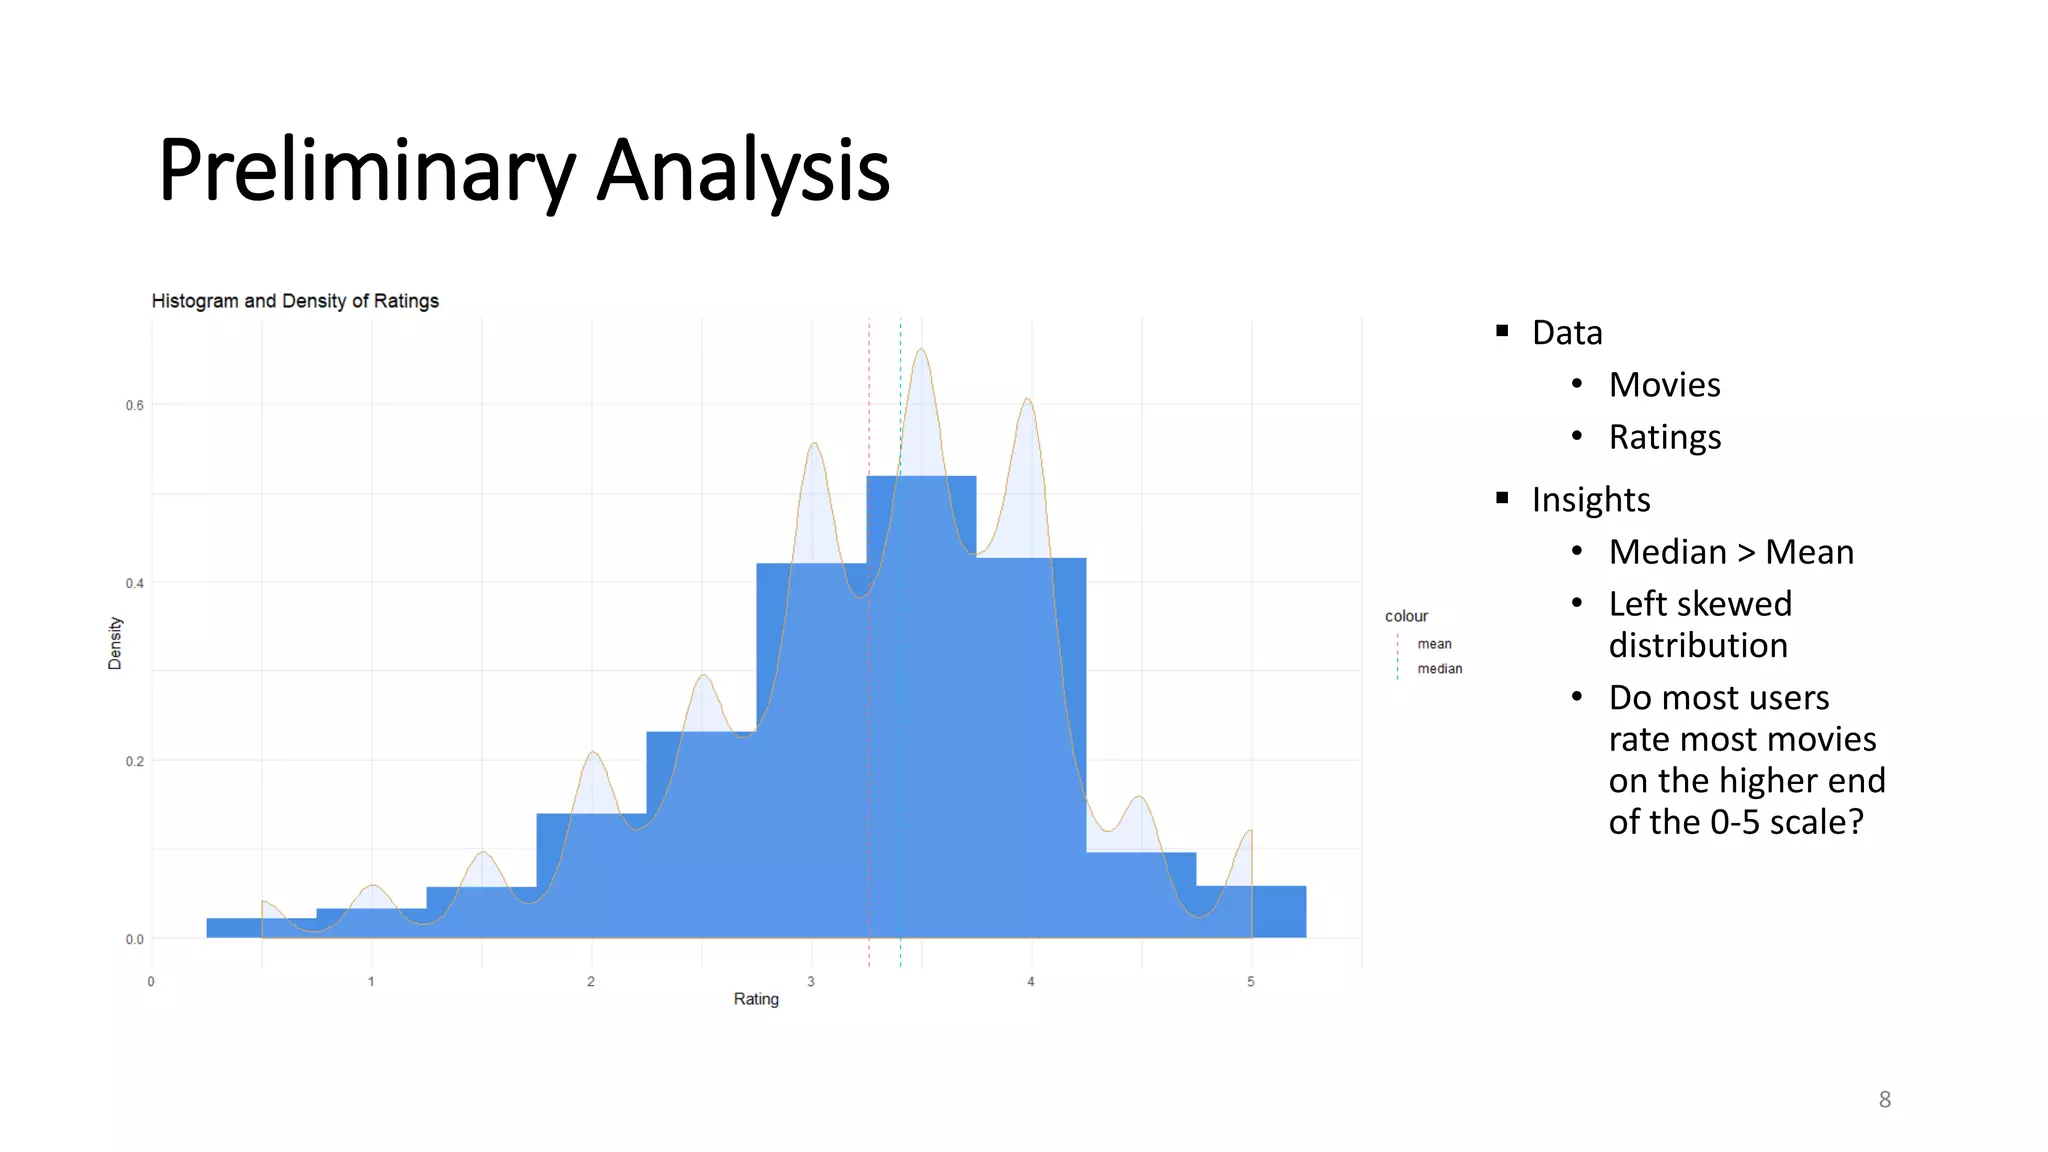
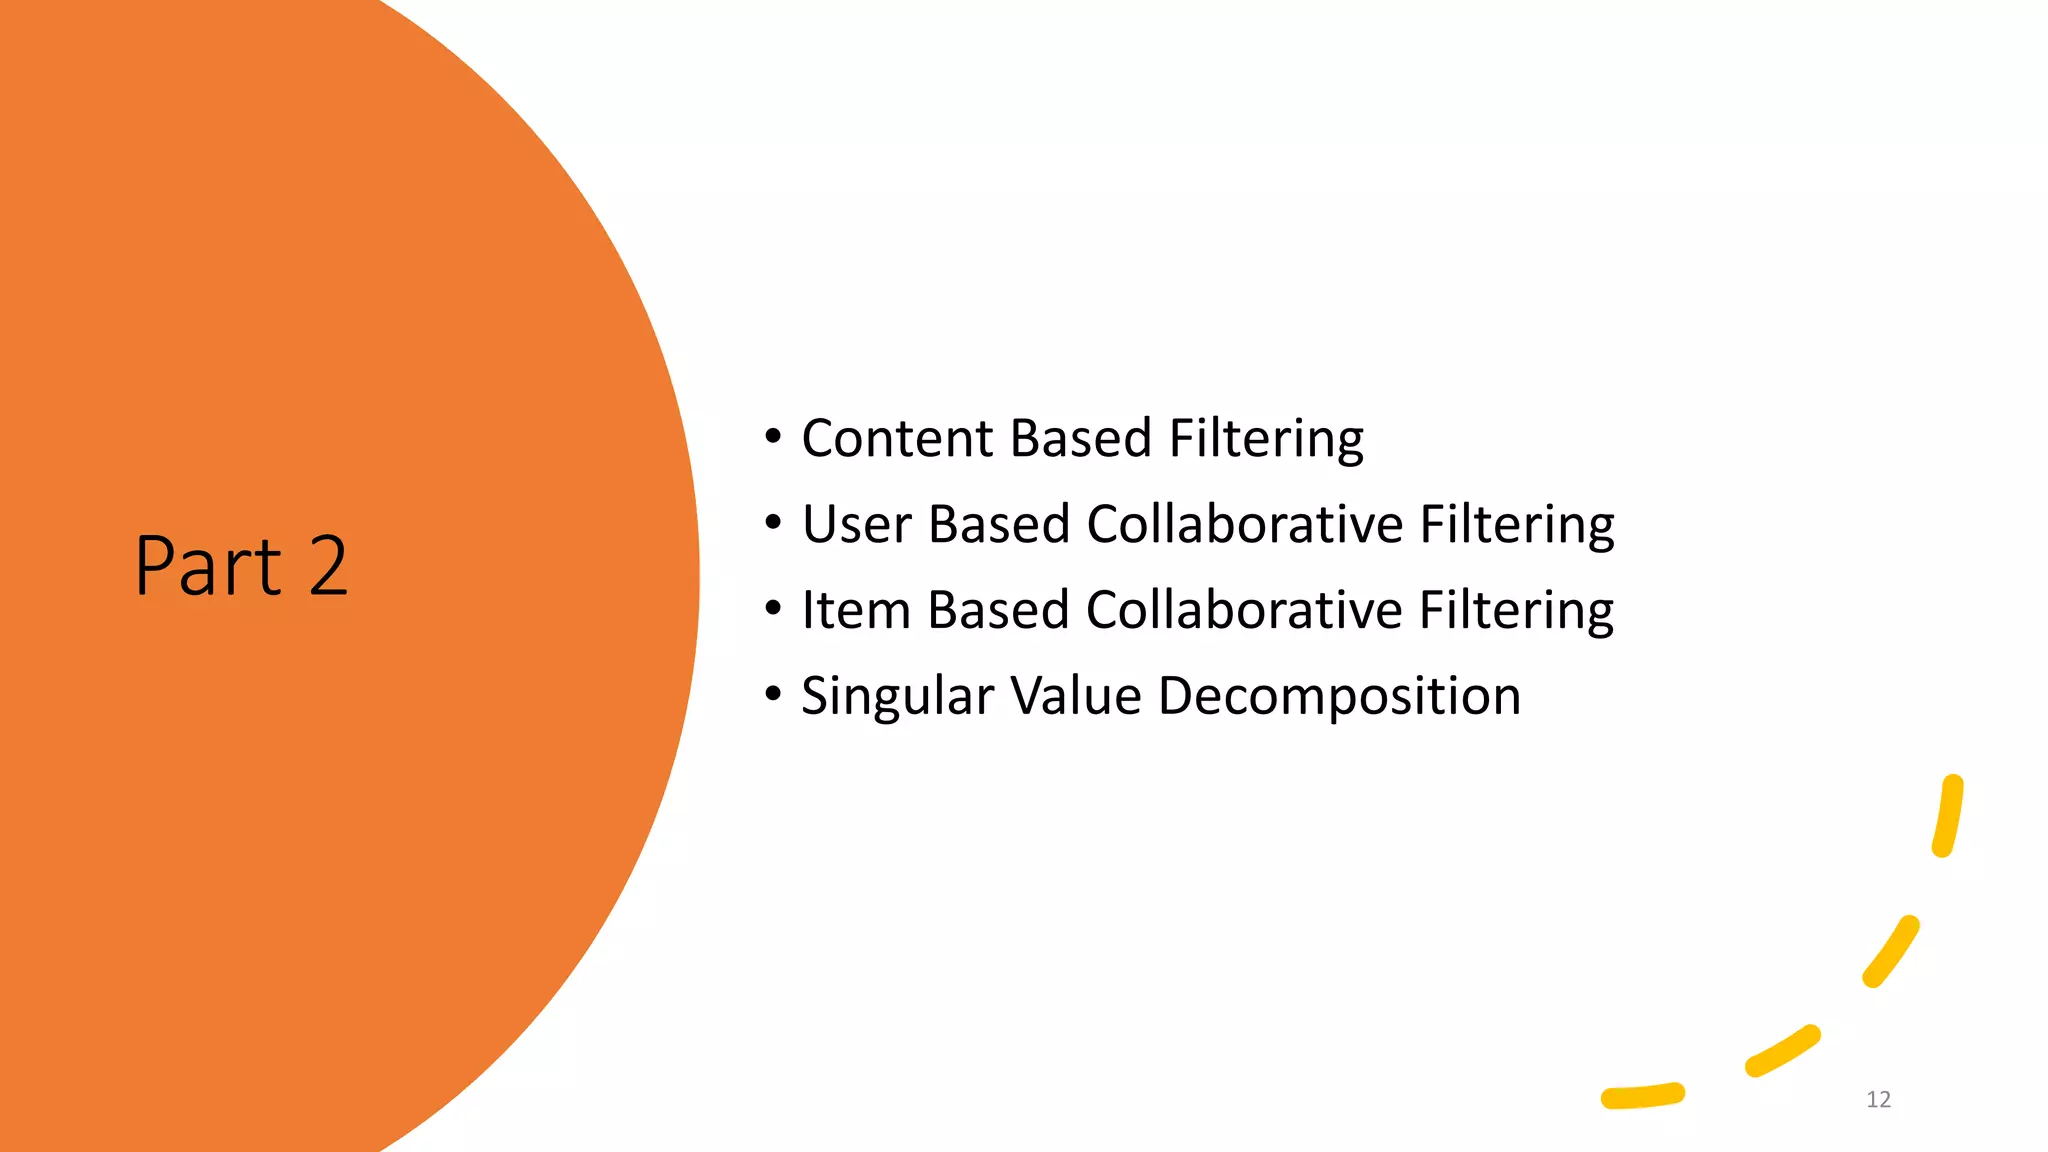
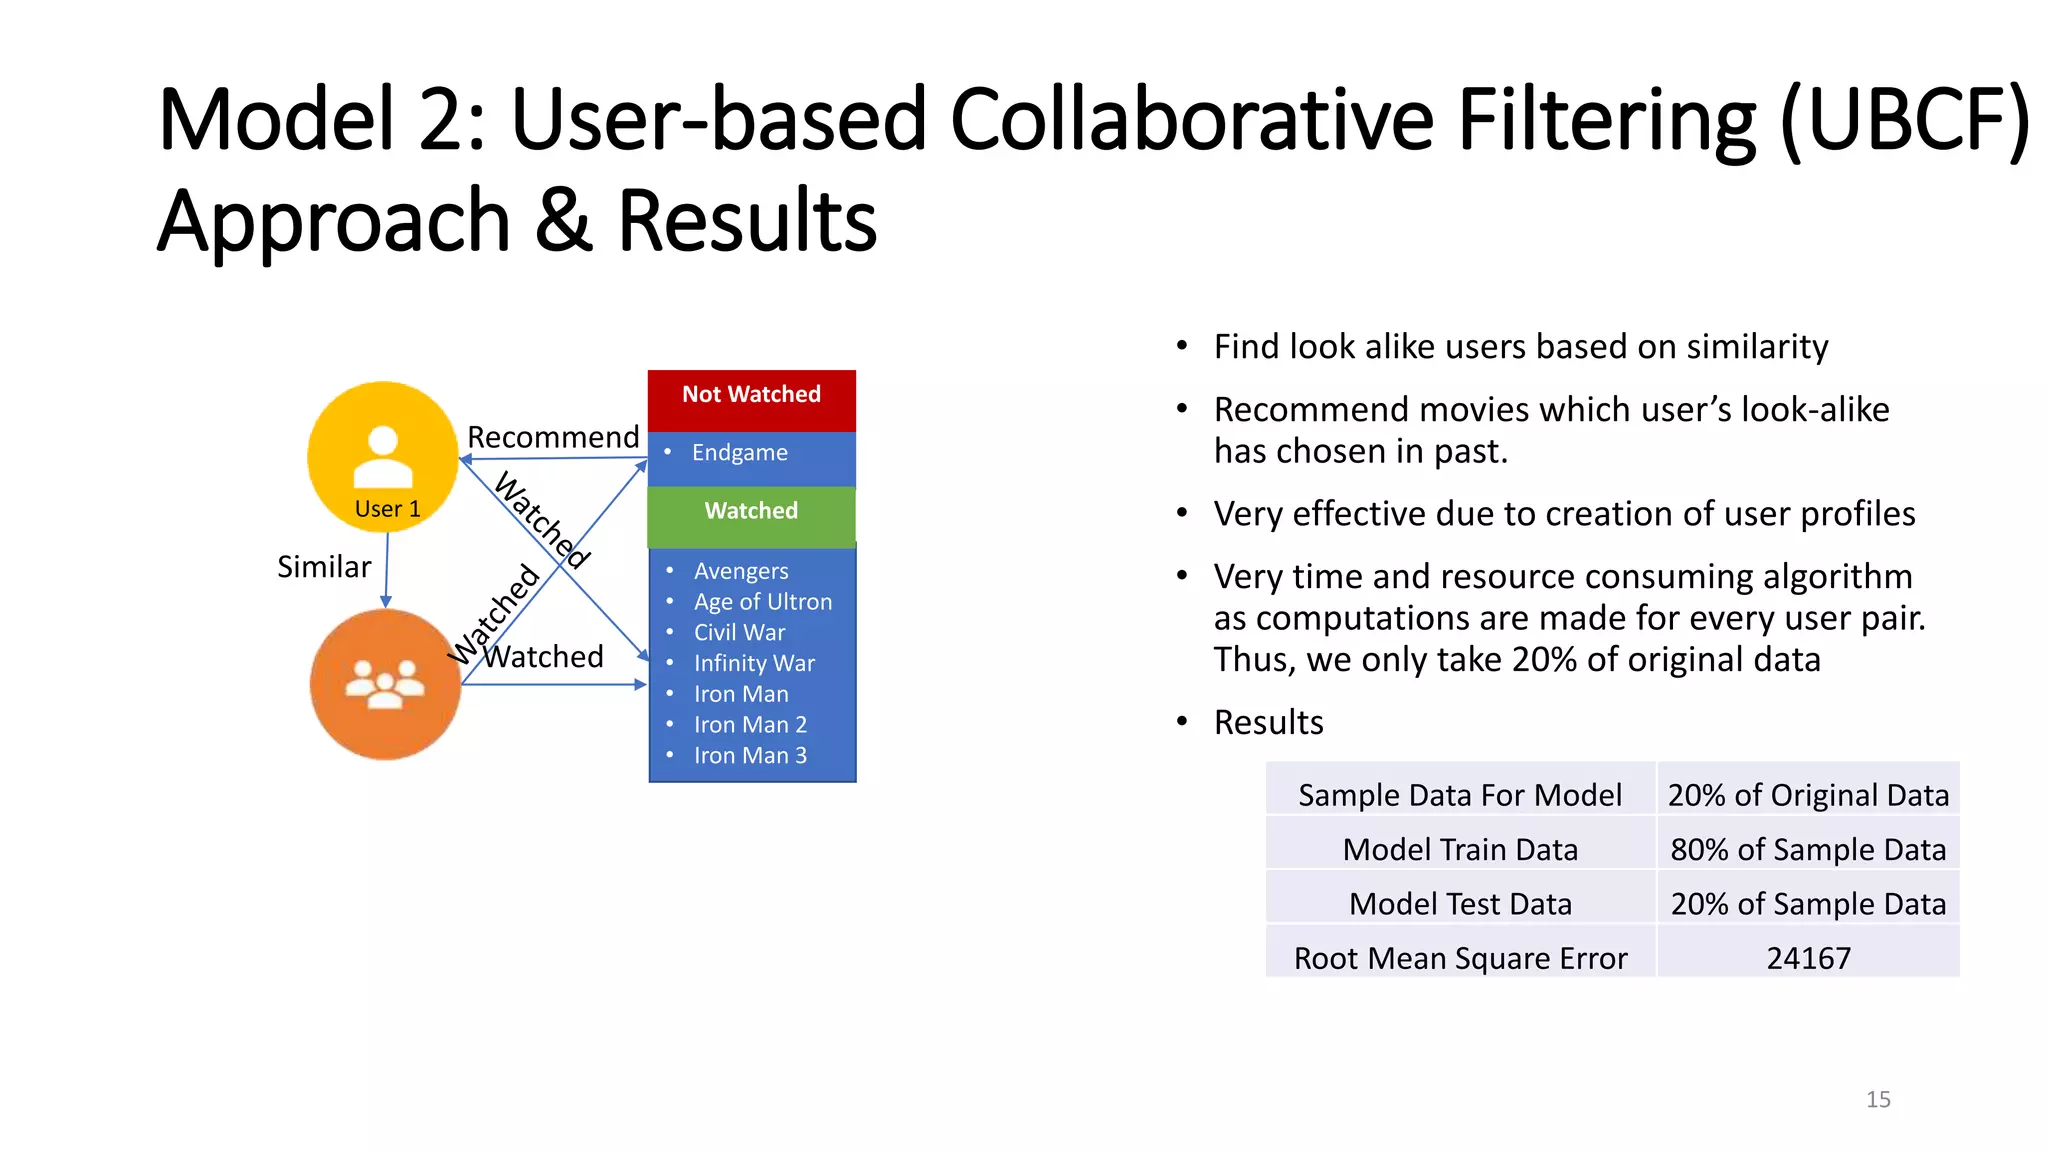
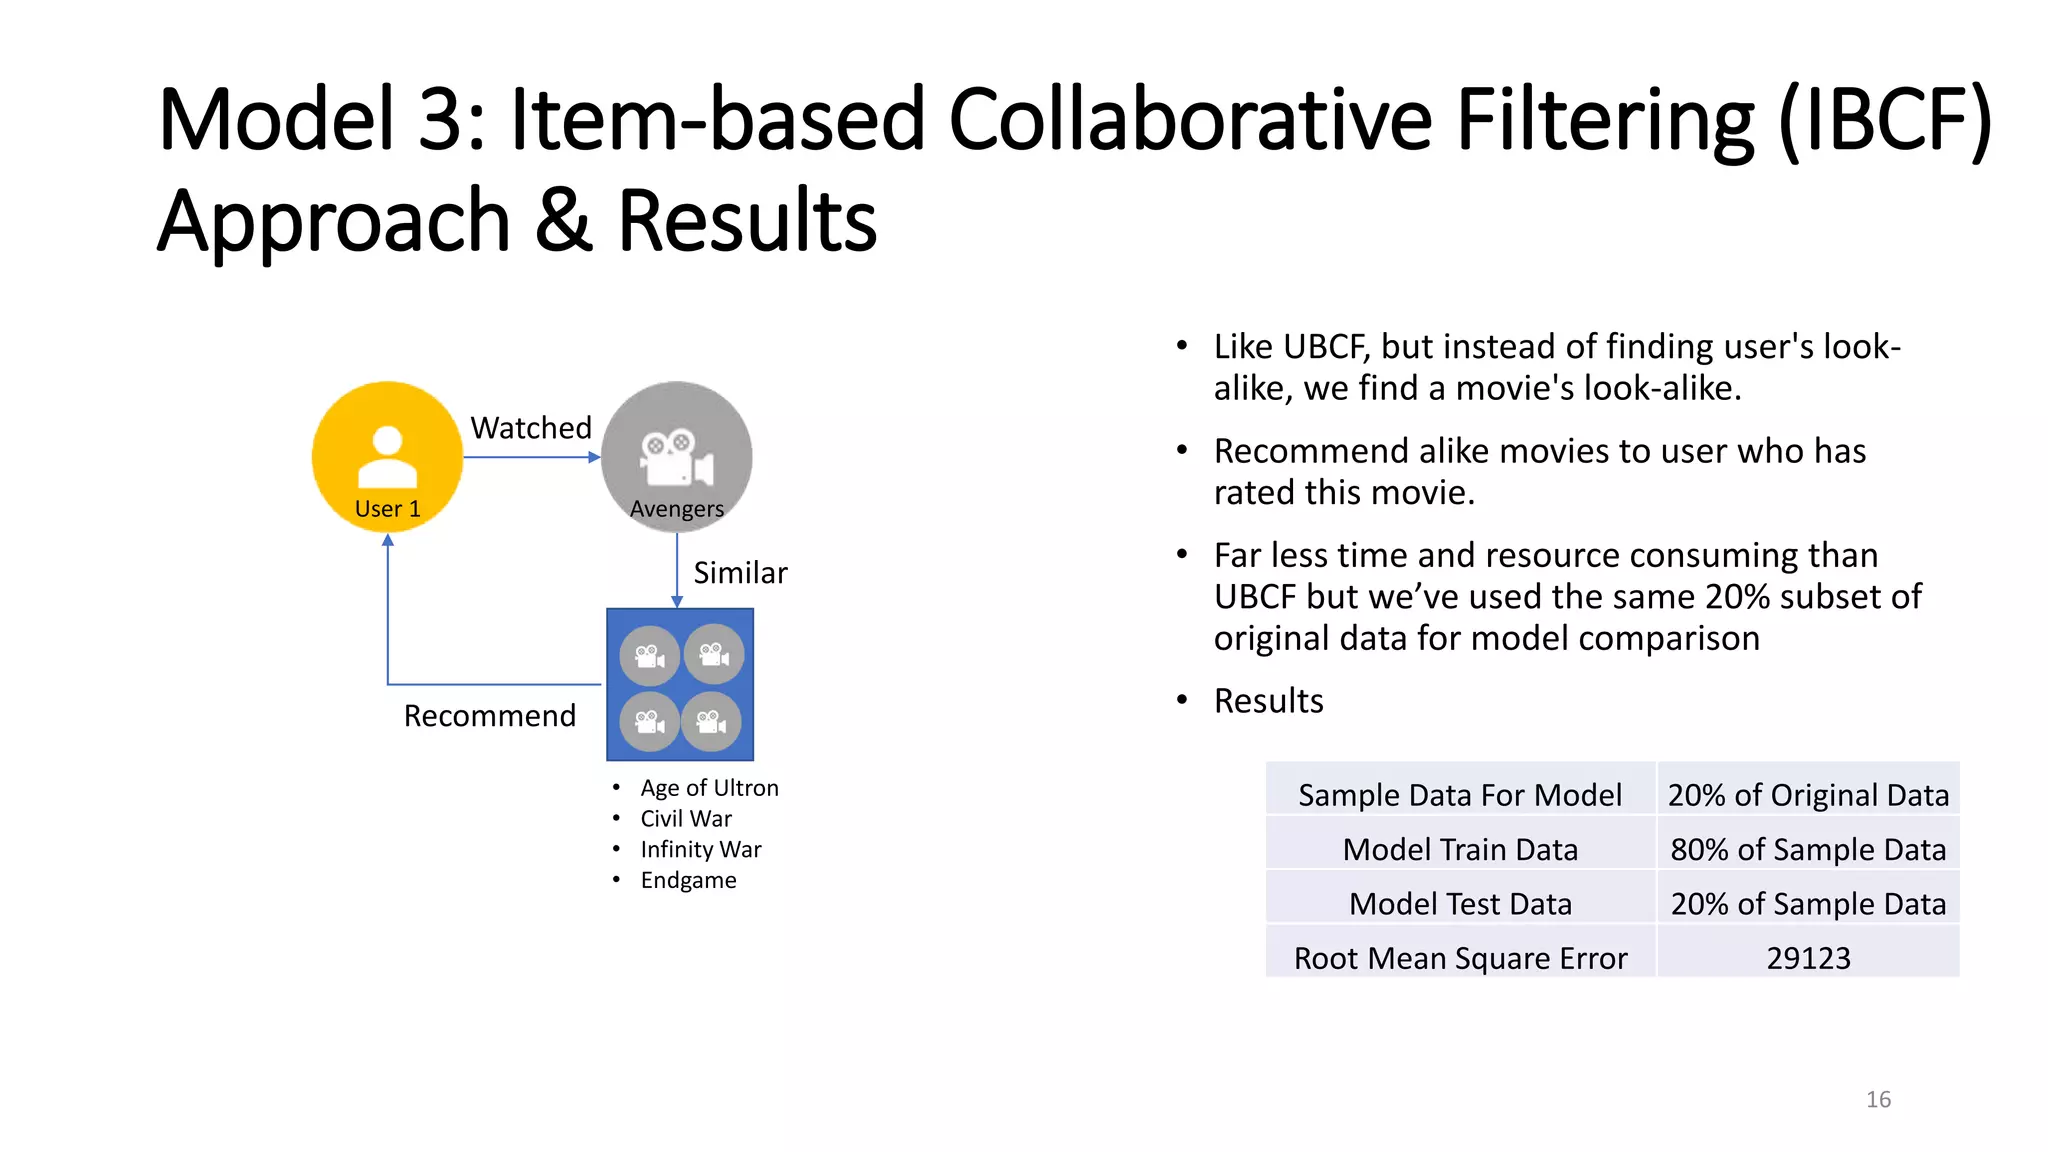
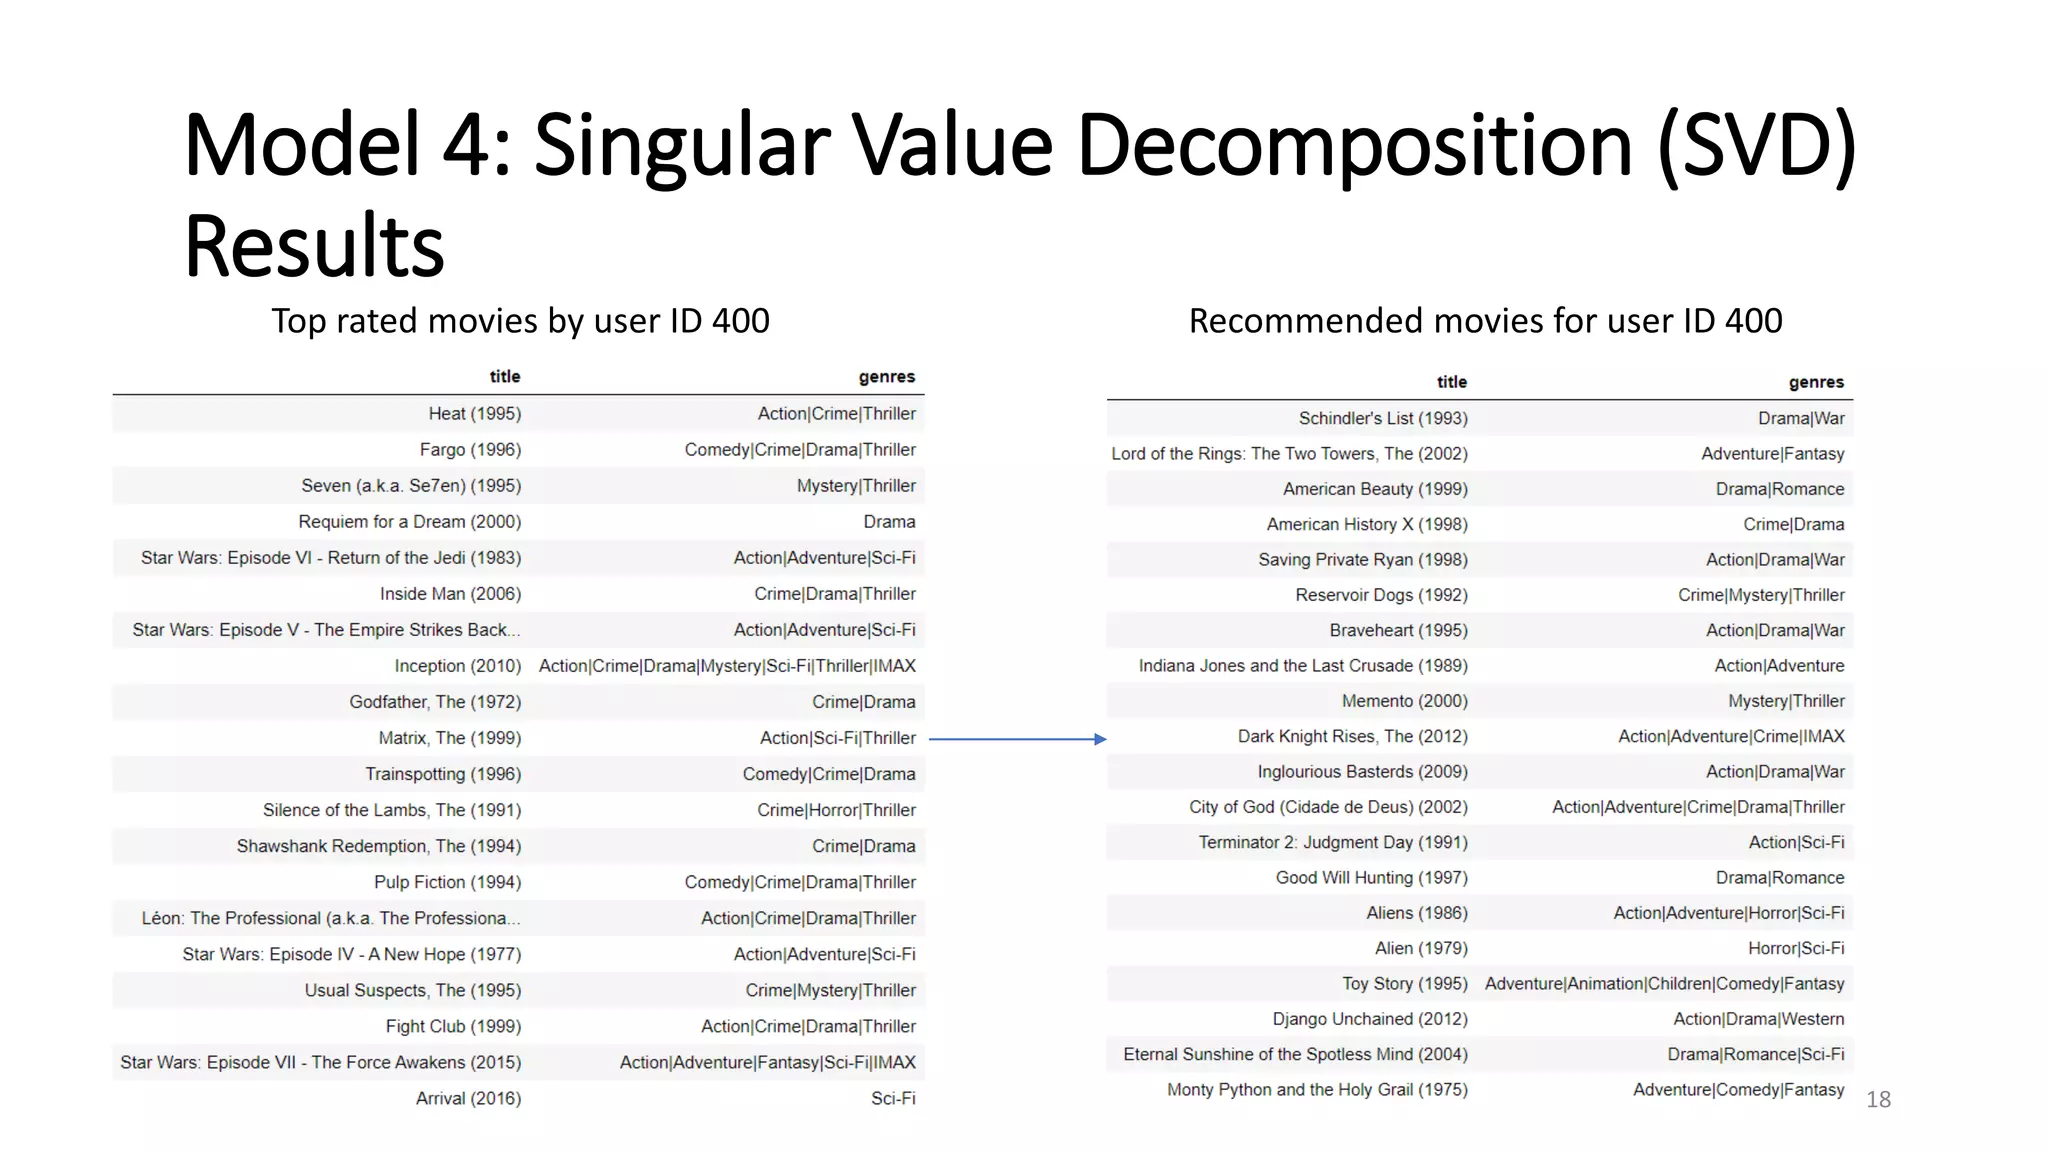
MOVIE
RECOMMENDATION
SYSTEM
BANA7047-002 FINAL PROJECT
• Group 2
• Jagruti Joshi
• Priya Kumari
• Pooja Sahare
1
Part 1
• Background
• Data
• Preliminary Analysis
2
Background
Top Streaming
Services
Need for a
recommendation system 13,000+ titles ~8 seconds
Netflix’s total content library Average human attention span
Data used in a
recommendation system
Impact of a
recommendation system
Watch
Data
Search
Data
Ratings
Data
Increased
Revenues
3
Data
• Source: https://grouplens.org/datasets/movielens/
• recommended for education and development
• Small: 100,000 ratings and 3,600 tag applications applied to 9,000 movies by
600 users. Last updated 9/2018.
•Movies
•movieId
•title
•genres
•Ratings
•userId
•movieId
•rating
•timestamp
•Tags
•userId
•movieId
•tag
•timestamp
•Links
•movieId
•imdbId
•tmdbId
9,742 100,836 1,587,923 9,742
4
Preliminary Analysis
 Data
• Movies
 Insights
• No of movies
released is
increasing every
year peaking at
733 in 2006.
• Sharp decline is
observed in
recent years
(could be due to
not including
recent releases in
the data)
5
Preliminary Analysis
 Data
• Movies
 Insights
• Drama, Comedy,
Thriller, Action
and Romance are
the top 5 genres
• The top 5 genres
together contain
~60% of the
movies
6
Preliminary Analysis
 Data
• Movies
 Insights
• Drama and
Comedy have
consistently
stayed the #1 and
#2 genres over
the years
• Similar
distribution of
genres over the
years
7
Preliminary Analysis
 Data
• Movies
• Ratings
 Insights
• Median > Mean
• Left skewed
distribution
• Do most users
rate most movies
on the higher end
of the 0-5 scale?
8
Preliminary Analysis
 Data
• Movies
• Ratings
 Insights
• Most users rate
less than 1000
movies
• Most users rate
movies on the
higher end of the
0-5 scale
• Most movies
receive less than
100 ratings
• Most movies are
rated on the
higher end of the
0-5 scale
9
Preliminary Analysis
 Data
• Movies
• Ratings
 Insights
• Average Ratings
for all genres is
between 3 and 4
• Among the top 5
genres, Drama
and Romance
movies have
higher ratings
compared to the
remaining three
#1 #2 #4#3#5
10
Preliminary Analysis
 Data
• Movies
• Tags
 Insights
• Tags can be useful
to create sub-
genres and drill
deeper into a
specific genre e.g.
Sci-Fi movies are
a huge sub-genre
within Action
movies
11
Part 2
• Content Based Filtering
• User Based Collaborative Filtering
• Item Based Collaborative Filtering
• Singular Value Decomposition
12
Model 1: Content Based Filtering (CBF) Approach
• Genre-based approach
• Without factoring release year, algorithm
recommends very old movies
• Term Frequency (TF) and Inverse Document
Frequency (IDF) used to determine the relative
importance of genres
• Vector Space Model
• Each movie represented by a vector of its
attributes
• For similar movies,
• Angle between their vectors is small
• Cosine of angle between their vectors is
large
13
1 movie
Movie Genre,
Release Year
CBF Algorithm
TF/IDF,
Cosine Similarity Score
n movies
Similar in Genres,
Closer in Release Years
Sort Results
Highest to Lowest
Cosine Similarity Scores
Filter Results
Select Top 20
Movies
Recommend Results
Display Movies in User’s
Watch Next List
Model 1: Content Based Filtering (CBF) Results
14
1. Rampage (2018)
2. Solo: A Star Wars Story (2018)
3. Ant-Man and the Wasp (2018)
4. Deadpool 2 (2018)
5. Sorry to Bother You (2018)
6. Pacific Rim: Uprising (2018)
7. A Wrinkle in Time (2018)
8. Jupiter Ascending (2015)
9. Avengers: Age of Ultron (2015)
10.Ant-Man (2015)
11.Power/Rangers (2015)
12.Turbo Kid (2015)
13.Hardcore Henry (2015)
14.Iron Man (2008)
15.Journey to the Center of the Earth (2008)
16.Mutant Chronicles (2008)
17.Outlander (2008)
18.Doctor Strange (2016)
19.Independence Day: Resurgence (2016)
20.Star Trek Beyond (2016)
Avengers: Infinity War - Part I (2018) Toy Story (1995) Insidious: Chapter 3 (2015)
1. Gordy (1995)
2. Reckless (1995)
3. Ninja Scroll (Jûbei ninpûchô) (1995)
4. Tale of Despereaux, The (2008)
5. Wild, The (2006)
6. Asterix and the Vikings (Astérix etlesVikings)
(2006)
7. Monsters, Inc. (2001)
8. The Good Dinosaur (2015)
9. Toy Story 2 (1999)
10.Shrek the Third (2007)
11.Moana (2016)
12.Adventures of Rocky and Bullwinkle,The-2000
13.Emperor's New Groove, The (2000)
14.Turbo (2013)
15.Antz (1998)
16.Jumanji (1995)
17.Indian in the Cupboard, The (1995)
18.Shrek (2001)
19.TMNT (Teenage Mutant Ninja Turtles)(2007)
20.Three Wishes (1995)
1. The Gallows (2015)
2. Frankenstein (2015)
3. Maggie (2015)
4. Body (2015)
5. Massu Engira Maasilamani (2015)
6. Into the Grizzly Maze (2015)
7. Return to Sender (2015)
8. Careful What You Wish For (2015)
9. Spotlight (2015)
10. Mojave (2015)
11. Knock Knock (2015)
12. Zipper (2015)
13. The Stanford Prison Experiment (2015)
14. Partisan (2015)
15. Bridge of Spies (2015)
16. The Perfect Guy (2015)
17. Silent Hill (2006)
18. Nightmare on Elm Street, A (2010)
19. Insidious (2010)
20. Paperhouse (1988)
Model 2: User-based Collaborative Filtering (UBCF)
Approach & Results
15
• Find look alike users based on similarity
• Recommend movies which user’s look-alike
has chosen in past.
• Very effective due to creation of user profiles
• Very time and resource consuming algorithm
as computations are made for every user pair.
Thus, we only take 20% of original data
• Results
User 1
• Avengers
• Age of Ultron
• Civil War
• Infinity War
• Iron Man
• Iron Man 2
• Iron Man 3
• Endgame
Not Watched
Watched
Watched
Recommend
Similar
Sample Data For Model 20% of Original Data
Model Train Data 80% of Sample Data
Model Test Data 20% of Sample Data
Root Mean Square Error 24167
Model 3: Item-based Collaborative Filtering (IBCF)
Approach & Results
16
• Like UBCF, but instead of finding user's look-
alike, we find a movie's look-alike.
• Recommend alike movies to user who has
rated this movie.
• Far less time and resource consuming than
UBCF but we’ve used the same 20% subset of
original data for model comparison
• Results
Watched
User 1 Avengers
• Age of Ultron
• Civil War
• Infinity War
• Endgame
Similar
Recommend
Sample Data For Model 20% of Original Data
Model Train Data 80% of Sample Data
Model Test Data 20% of Sample Data
Root Mean Square Error 29123
• Basic essence of SVD is to decomposes a
matrix of any shape into a product of 3
matrices with notable mathematical
properties: X = U S VT
• Decomposition of ratings matrix results in an
ordered matrix of a user feature matrix and
an item feature matrix which encapsulate the
variance associated with every direction of
the matrix
• Larger variances indicate less redundancy
and less correlation and hold features of data
• A representative subset of user rating
directions or principal components to
recommend movies is utilized
• Overall SVD aims to find the smallest
condensed subset of features by discarding
features imparting noise
17
Model 4: Singular Value Decomposition (SVD)
Approach
Movie
User
Sci-Fi
FemaleMale
Wonder
Woman
Captain
Marvel
Drama
Avengers
Endgame
Iron Man
Captain
America
Thelma &
Louise
Legally
Blonde
The
Shawshank
Redemption
Fight Club
Model 4: Singular Value Decomposition (SVD)
Results
Top rated movies by user ID 400
18
Recommended movies for user ID 400
Model Comparison & Recommendations
Model Proportion of Data RMSE
UBCF 20% 24167
IBCF 20% 29123
SVD 20% 0.91
19
• Movie recommendations are very subjective and vary from one user to another
• Each model has a different approach and its own set of pros and cons
• Weighing all the pros and cons, we would recommend SVD as it is a good mix of both collaborative filtering
methods
References
• Slide 2: Background
• https://www.comparitech.com/blog/vpn-privacy/netflix-statistics-facts-
figures/
• Slide 3: Data
• https://grouplens.org/about/what-is-grouplens/
• https://movielens.org/info/about
20
References
• Slides 11,13,15: Collaborative Filtering, UBCF and IBCF
• https://github.com/khanhnamle1994/movielens/blob/master/Content_Base
d_and_Collaborative_Filtering_Models.ipynb
• https://www.comparitech.com/blog/vpn-privacy/netflix-statistics-facts-
figures/
• Slide 17: SVD
• http://www.cs.carleton.edu/cs_comps/0607/recommend/recommender/svd.
html
• https://alyssaq.github.io/2015/20150426-simple-movie-recommender-using-
svd/
• https://www.dataminingapps.com/2020/02/singular-value-decomposition-in-
recommender-systems/
21

Movie Recommendation System - MovieLens Dataset

  • 1.
    MOVIE RECOMMENDATION SYSTEM BANA7047-002 FINAL PROJECT •Group 2 • Jagruti Joshi • Priya Kumari • Pooja Sahare 1
  • 2.
    Part 1 • Background •Data • Preliminary Analysis 2
  • 3.
    Background Top Streaming Services Need fora recommendation system 13,000+ titles ~8 seconds Netflix’s total content library Average human attention span Data used in a recommendation system Impact of a recommendation system Watch Data Search Data Ratings Data Increased Revenues 3
  • 4.
    Data • Source: https://grouplens.org/datasets/movielens/ •recommended for education and development • Small: 100,000 ratings and 3,600 tag applications applied to 9,000 movies by 600 users. Last updated 9/2018. •Movies •movieId •title •genres •Ratings •userId •movieId •rating •timestamp •Tags •userId •movieId •tag •timestamp •Links •movieId •imdbId •tmdbId 9,742 100,836 1,587,923 9,742 4
  • 5.
    Preliminary Analysis  Data •Movies  Insights • No of movies released is increasing every year peaking at 733 in 2006. • Sharp decline is observed in recent years (could be due to not including recent releases in the data) 5
  • 6.
    Preliminary Analysis  Data •Movies  Insights • Drama, Comedy, Thriller, Action and Romance are the top 5 genres • The top 5 genres together contain ~60% of the movies 6
  • 7.
    Preliminary Analysis  Data •Movies  Insights • Drama and Comedy have consistently stayed the #1 and #2 genres over the years • Similar distribution of genres over the years 7
  • 8.
    Preliminary Analysis  Data •Movies • Ratings  Insights • Median > Mean • Left skewed distribution • Do most users rate most movies on the higher end of the 0-5 scale? 8
  • 9.
    Preliminary Analysis  Data •Movies • Ratings  Insights • Most users rate less than 1000 movies • Most users rate movies on the higher end of the 0-5 scale • Most movies receive less than 100 ratings • Most movies are rated on the higher end of the 0-5 scale 9
  • 10.
    Preliminary Analysis  Data •Movies • Ratings  Insights • Average Ratings for all genres is between 3 and 4 • Among the top 5 genres, Drama and Romance movies have higher ratings compared to the remaining three #1 #2 #4#3#5 10
  • 11.
    Preliminary Analysis  Data •Movies • Tags  Insights • Tags can be useful to create sub- genres and drill deeper into a specific genre e.g. Sci-Fi movies are a huge sub-genre within Action movies 11
  • 12.
    Part 2 • ContentBased Filtering • User Based Collaborative Filtering • Item Based Collaborative Filtering • Singular Value Decomposition 12
  • 13.
    Model 1: ContentBased Filtering (CBF) Approach • Genre-based approach • Without factoring release year, algorithm recommends very old movies • Term Frequency (TF) and Inverse Document Frequency (IDF) used to determine the relative importance of genres • Vector Space Model • Each movie represented by a vector of its attributes • For similar movies, • Angle between their vectors is small • Cosine of angle between their vectors is large 13 1 movie Movie Genre, Release Year CBF Algorithm TF/IDF, Cosine Similarity Score n movies Similar in Genres, Closer in Release Years Sort Results Highest to Lowest Cosine Similarity Scores Filter Results Select Top 20 Movies Recommend Results Display Movies in User’s Watch Next List
  • 14.
    Model 1: ContentBased Filtering (CBF) Results 14 1. Rampage (2018) 2. Solo: A Star Wars Story (2018) 3. Ant-Man and the Wasp (2018) 4. Deadpool 2 (2018) 5. Sorry to Bother You (2018) 6. Pacific Rim: Uprising (2018) 7. A Wrinkle in Time (2018) 8. Jupiter Ascending (2015) 9. Avengers: Age of Ultron (2015) 10.Ant-Man (2015) 11.Power/Rangers (2015) 12.Turbo Kid (2015) 13.Hardcore Henry (2015) 14.Iron Man (2008) 15.Journey to the Center of the Earth (2008) 16.Mutant Chronicles (2008) 17.Outlander (2008) 18.Doctor Strange (2016) 19.Independence Day: Resurgence (2016) 20.Star Trek Beyond (2016) Avengers: Infinity War - Part I (2018) Toy Story (1995) Insidious: Chapter 3 (2015) 1. Gordy (1995) 2. Reckless (1995) 3. Ninja Scroll (Jûbei ninpûchô) (1995) 4. Tale of Despereaux, The (2008) 5. Wild, The (2006) 6. Asterix and the Vikings (Astérix etlesVikings) (2006) 7. Monsters, Inc. (2001) 8. The Good Dinosaur (2015) 9. Toy Story 2 (1999) 10.Shrek the Third (2007) 11.Moana (2016) 12.Adventures of Rocky and Bullwinkle,The-2000 13.Emperor's New Groove, The (2000) 14.Turbo (2013) 15.Antz (1998) 16.Jumanji (1995) 17.Indian in the Cupboard, The (1995) 18.Shrek (2001) 19.TMNT (Teenage Mutant Ninja Turtles)(2007) 20.Three Wishes (1995) 1. The Gallows (2015) 2. Frankenstein (2015) 3. Maggie (2015) 4. Body (2015) 5. Massu Engira Maasilamani (2015) 6. Into the Grizzly Maze (2015) 7. Return to Sender (2015) 8. Careful What You Wish For (2015) 9. Spotlight (2015) 10. Mojave (2015) 11. Knock Knock (2015) 12. Zipper (2015) 13. The Stanford Prison Experiment (2015) 14. Partisan (2015) 15. Bridge of Spies (2015) 16. The Perfect Guy (2015) 17. Silent Hill (2006) 18. Nightmare on Elm Street, A (2010) 19. Insidious (2010) 20. Paperhouse (1988)
  • 15.
    Model 2: User-basedCollaborative Filtering (UBCF) Approach & Results 15 • Find look alike users based on similarity • Recommend movies which user’s look-alike has chosen in past. • Very effective due to creation of user profiles • Very time and resource consuming algorithm as computations are made for every user pair. Thus, we only take 20% of original data • Results User 1 • Avengers • Age of Ultron • Civil War • Infinity War • Iron Man • Iron Man 2 • Iron Man 3 • Endgame Not Watched Watched Watched Recommend Similar Sample Data For Model 20% of Original Data Model Train Data 80% of Sample Data Model Test Data 20% of Sample Data Root Mean Square Error 24167
  • 16.
    Model 3: Item-basedCollaborative Filtering (IBCF) Approach & Results 16 • Like UBCF, but instead of finding user's look- alike, we find a movie's look-alike. • Recommend alike movies to user who has rated this movie. • Far less time and resource consuming than UBCF but we’ve used the same 20% subset of original data for model comparison • Results Watched User 1 Avengers • Age of Ultron • Civil War • Infinity War • Endgame Similar Recommend Sample Data For Model 20% of Original Data Model Train Data 80% of Sample Data Model Test Data 20% of Sample Data Root Mean Square Error 29123
  • 17.
    • Basic essenceof SVD is to decomposes a matrix of any shape into a product of 3 matrices with notable mathematical properties: X = U S VT • Decomposition of ratings matrix results in an ordered matrix of a user feature matrix and an item feature matrix which encapsulate the variance associated with every direction of the matrix • Larger variances indicate less redundancy and less correlation and hold features of data • A representative subset of user rating directions or principal components to recommend movies is utilized • Overall SVD aims to find the smallest condensed subset of features by discarding features imparting noise 17 Model 4: Singular Value Decomposition (SVD) Approach Movie User Sci-Fi FemaleMale Wonder Woman Captain Marvel Drama Avengers Endgame Iron Man Captain America Thelma & Louise Legally Blonde The Shawshank Redemption Fight Club
  • 18.
    Model 4: SingularValue Decomposition (SVD) Results Top rated movies by user ID 400 18 Recommended movies for user ID 400
  • 19.
    Model Comparison &Recommendations Model Proportion of Data RMSE UBCF 20% 24167 IBCF 20% 29123 SVD 20% 0.91 19 • Movie recommendations are very subjective and vary from one user to another • Each model has a different approach and its own set of pros and cons • Weighing all the pros and cons, we would recommend SVD as it is a good mix of both collaborative filtering methods
  • 20.
    References • Slide 2:Background • https://www.comparitech.com/blog/vpn-privacy/netflix-statistics-facts- figures/ • Slide 3: Data • https://grouplens.org/about/what-is-grouplens/ • https://movielens.org/info/about 20
  • 21.
    References • Slides 11,13,15:Collaborative Filtering, UBCF and IBCF • https://github.com/khanhnamle1994/movielens/blob/master/Content_Base d_and_Collaborative_Filtering_Models.ipynb • https://www.comparitech.com/blog/vpn-privacy/netflix-statistics-facts- figures/ • Slide 17: SVD • http://www.cs.carleton.edu/cs_comps/0607/recommend/recommender/svd. html • https://alyssaq.github.io/2015/20150426-simple-movie-recommender-using- svd/ • https://www.dataminingapps.com/2020/02/singular-value-decomposition-in- recommender-systems/ 21

Editor's Notes

  • #4 Background information of the project. The objective you want to achieve.
  • #5 discussion of data source and nature of the variables involved in the analysis GrouplLens - a research lab in the Department of Computer Science and Engineering at the University of Minnesota, Twin Cities specializing in recommender systems MovieLens - a research site run by GroupLens Research, a unique research vehicle for dozens of undergraduates and graduate students researching various aspects of personalization and filtering technologies
  • #6 Exploratory analysis of the data set, summary, plots, and maybe some kind of linear regression fit to check the feasibility of the problem as well as get a better idea of how this data looks.
  • #7 Exploratory analysis of the data set, summary, plots, and maybe some kind of linear regression fit to check the feasibility of the problem as well as get a better idea of how this data looks.
  • #8 Exploratory analysis of the data set, summary, plots, and maybe some kind of linear regression fit to check the feasibility of the problem as well as get a better idea of how this data looks.
  • #9 Exploratory analysis of the data set, summary, plots, and maybe some kind of linear regression fit to check the feasibility of the problem as well as get a better idea of how this data looks.
  • #10 Exploratory analysis of the data set, summary, plots, and maybe some kind of linear regression fit to check the feasibility of the problem as well as get a better idea of how this data looks.
  • #11 Exploratory analysis of the data set, summary, plots, and maybe some kind of linear regression fit to check the feasibility of the problem as well as get a better idea of how this data looks.
  • #12 Exploratory analysis of the data set, summary, plots, and maybe some kind of linear regression fit to check the feasibility of the problem as well as get a better idea of how this data looks.
  • #18 Ratings are associated with both users and movies While creating the best representation of our original features, we remove the unnecessary noise By retaining features the features which have larger variances
  • #19 Different genres in input -> Different genres in output as well Holistic view