The document discusses reaction rate graphs and how to interpret them:
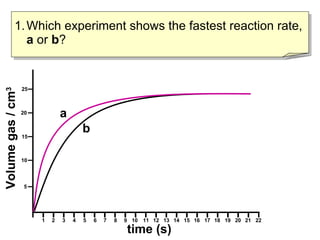
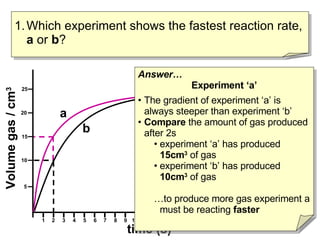
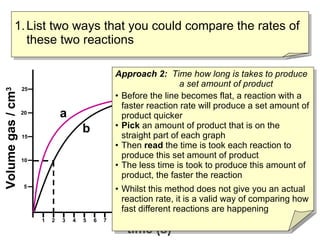
- Experiment A shows a faster reaction rate than Experiment B based on its steeper slope and producing more product in less time.
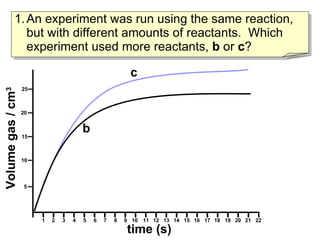
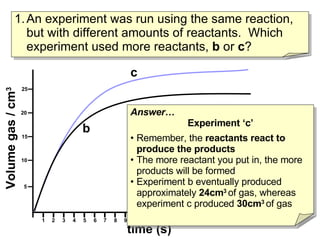
- Experiment C used more reactants than Experiment B based on producing more total product.
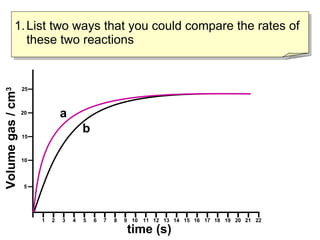
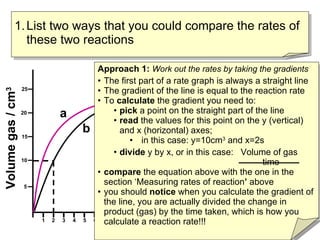
- Two ways to compare reaction rates are to calculate the slope/gradient of the initial linear portion of the graphs, or to measure the time taken to produce a set amount of product.
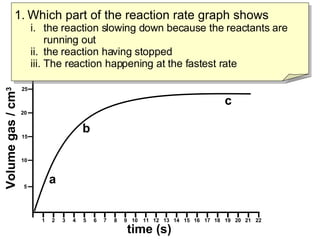
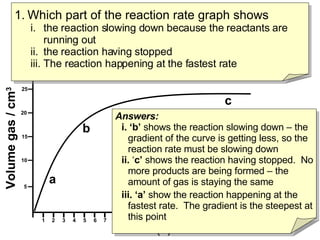
- Region B shows the reaction slowing down due to lack of reactants, region C shows the reaction stopping, and region A shows the fastest reaction rate based on steepest slope.