The document discusses reaction rate graphs and how to analyze them:
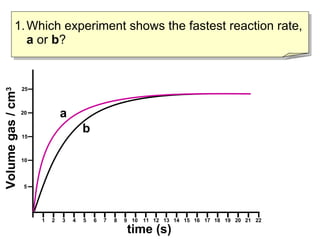
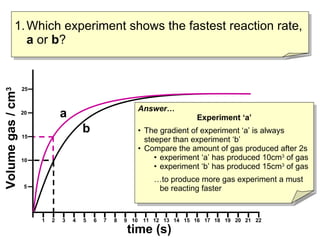
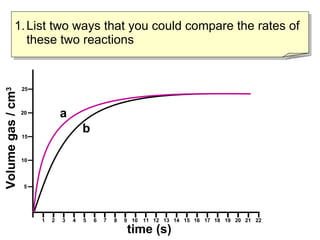
- Graph A shows a faster reaction rate than Graph B because it produces more product in less time as seen by its steeper slope.
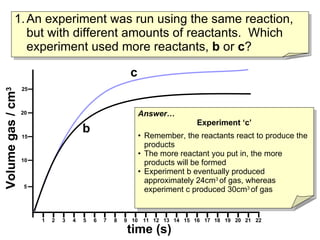
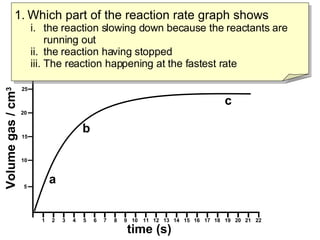
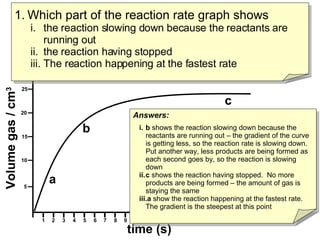
- Graph C shows a reaction that used more reactants than Graph B because it produced more total product over the same time period.
- Reaction rates can be compared by calculating the slope of the linear portion of the graphs or measuring the time taken to produce a set amount of product.
- Graph B shows the reaction slowing down due to lack of reactants as the slope decreases over time. Graph C shows the reaction fully stopped as no more product is being formed. Graph A shows the fastest reaction rate based on its stee