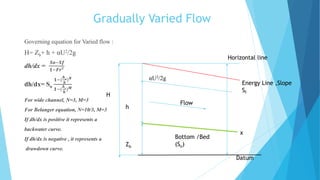
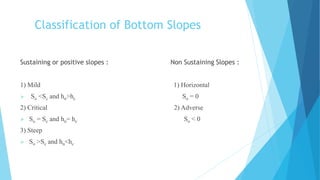
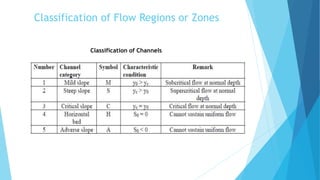
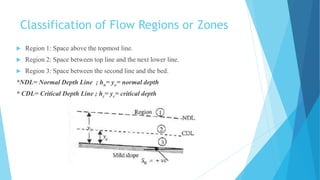
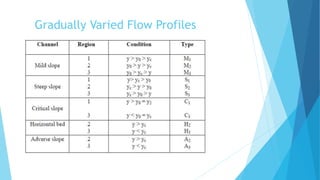
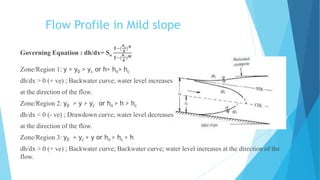
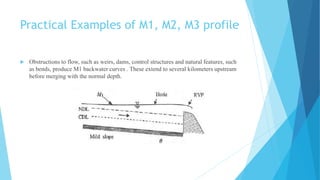
Chapter-6
Course Code : CE-421
Course Title : Water Resources Engineering-II
Romana Saila
Assistant Professor
Department of Civil Engineering
Gradually Varied Flow
Governing equation for Varied flow :
H= Zb+ h + αU2/2g
dh/dx =
𝑺𝒐−𝑺𝒇
𝟏−𝑭𝒓 𝟐
dh/dx= So
𝟏−(
𝒉 𝒏
𝒉
) 𝑵
𝟏−(
𝒉 𝒄
𝒉
) 𝑴
For wide channel, N=3, M=3
For Belanger equation, N=10/3, M=3
If dh/dx is positive it represents a
backwater curve.
If dh/dx is negative , it represents a
drawdown curve.
Datum
Zb
Bottom /Bed
(So)
h
αU2/2g
Energy Line ,Slope
Sf
Horizontal line
x
H
Flow
Classification of Bottom Slopes
Sustaining or positive slopes : Non Sustaining Slopes :
1) Mild 1) Horizontal
 So <Sc and hn>hc So = 0
2) Critical 2) Adverse
 So = Sc and hn= hc So < 0
3) Steep
 So >Sc and hn<hc
Classification of Flow Regions or Zones
Classification of Channels
Classification of Flow Regions or Zones
 Region 1: Space above the topmost line.
 Region 2: Space between top line and the next lower line.
 Region 3: Space between the second line and the bed.
*NDL= Normal Depth Line ; hn= yo= normal depth
* CDL= Critical Depth Line ; hc= yc= critical depth
Gradually Varied Flow Profiles
Flow Profile in Mild slope
Governing Equation : dh/dx= So
𝟏−(
𝒉 𝒏
𝒉
) 𝑵
𝟏−(
𝒉 𝒄
𝒉
) 𝑴
Zone/Region 1: y > y0 > yc or h> hn> hc
dh/dx > 0 (+ ve) ; Backwater curve; water level increases
at the direction of the flow.
Zone/Region 2: y0 > y > yc or hn > h > hc
dh/dx < 0 (- ve) ; Drawdown curve; water level decreases
at the direction of the flow.
Zone/Region 3: y0 > yc > y or hn > hc > h
dh/dx > 0 (+ ve) ; Backwater curve; Backwater curve; water level increases at the direction of the
flow.
Practical Examples of M1, M2, M3 profile
 Obstructions to flow, such as weirs, dams, control structures and natural features, such
as bends, produce M1 backwater curves . These extend to several kilometers upstream
before merging with the normal depth.
Practical Examples of M1, M2, M3 profile
 The M2 profiles occur at a sudden drop of the channel, at constriction type of transitions and at
the canal outlet into pools.
 Where a supercritical stream enters a mild slope channel, M3 type of profile occurs. The flow
leading from a spillway or a sluice gate to a mild slope forms a typical example.
Reference
 https://web.itu.edu.tr/~bulu/hydraulics_files/lecture_notes_06.pdf

Gradually Varied Flow

  • 1.
    Chapter-6 Course Code :CE-421 Course Title : Water Resources Engineering-II Romana Saila Assistant Professor Department of Civil Engineering
  • 2.
    Gradually Varied Flow Governingequation for Varied flow : H= Zb+ h + αU2/2g dh/dx = 𝑺𝒐−𝑺𝒇 𝟏−𝑭𝒓 𝟐 dh/dx= So 𝟏−( 𝒉 𝒏 𝒉 ) 𝑵 𝟏−( 𝒉 𝒄 𝒉 ) 𝑴 For wide channel, N=3, M=3 For Belanger equation, N=10/3, M=3 If dh/dx is positive it represents a backwater curve. If dh/dx is negative , it represents a drawdown curve. Datum Zb Bottom /Bed (So) h αU2/2g Energy Line ,Slope Sf Horizontal line x H Flow
  • 3.
    Classification of BottomSlopes Sustaining or positive slopes : Non Sustaining Slopes : 1) Mild 1) Horizontal  So <Sc and hn>hc So = 0 2) Critical 2) Adverse  So = Sc and hn= hc So < 0 3) Steep  So >Sc and hn<hc
  • 4.
    Classification of FlowRegions or Zones Classification of Channels
  • 5.
    Classification of FlowRegions or Zones  Region 1: Space above the topmost line.  Region 2: Space between top line and the next lower line.  Region 3: Space between the second line and the bed. *NDL= Normal Depth Line ; hn= yo= normal depth * CDL= Critical Depth Line ; hc= yc= critical depth
  • 6.
  • 7.
    Flow Profile inMild slope Governing Equation : dh/dx= So 𝟏−( 𝒉 𝒏 𝒉 ) 𝑵 𝟏−( 𝒉 𝒄 𝒉 ) 𝑴 Zone/Region 1: y > y0 > yc or h> hn> hc dh/dx > 0 (+ ve) ; Backwater curve; water level increases at the direction of the flow. Zone/Region 2: y0 > y > yc or hn > h > hc dh/dx < 0 (- ve) ; Drawdown curve; water level decreases at the direction of the flow. Zone/Region 3: y0 > yc > y or hn > hc > h dh/dx > 0 (+ ve) ; Backwater curve; Backwater curve; water level increases at the direction of the flow.
  • 8.
    Practical Examples ofM1, M2, M3 profile  Obstructions to flow, such as weirs, dams, control structures and natural features, such as bends, produce M1 backwater curves . These extend to several kilometers upstream before merging with the normal depth.
  • 9.
    Practical Examples ofM1, M2, M3 profile  The M2 profiles occur at a sudden drop of the channel, at constriction type of transitions and at the canal outlet into pools.  Where a supercritical stream enters a mild slope channel, M3 type of profile occurs. The flow leading from a spillway or a sluice gate to a mild slope forms a typical example.
  • 10.