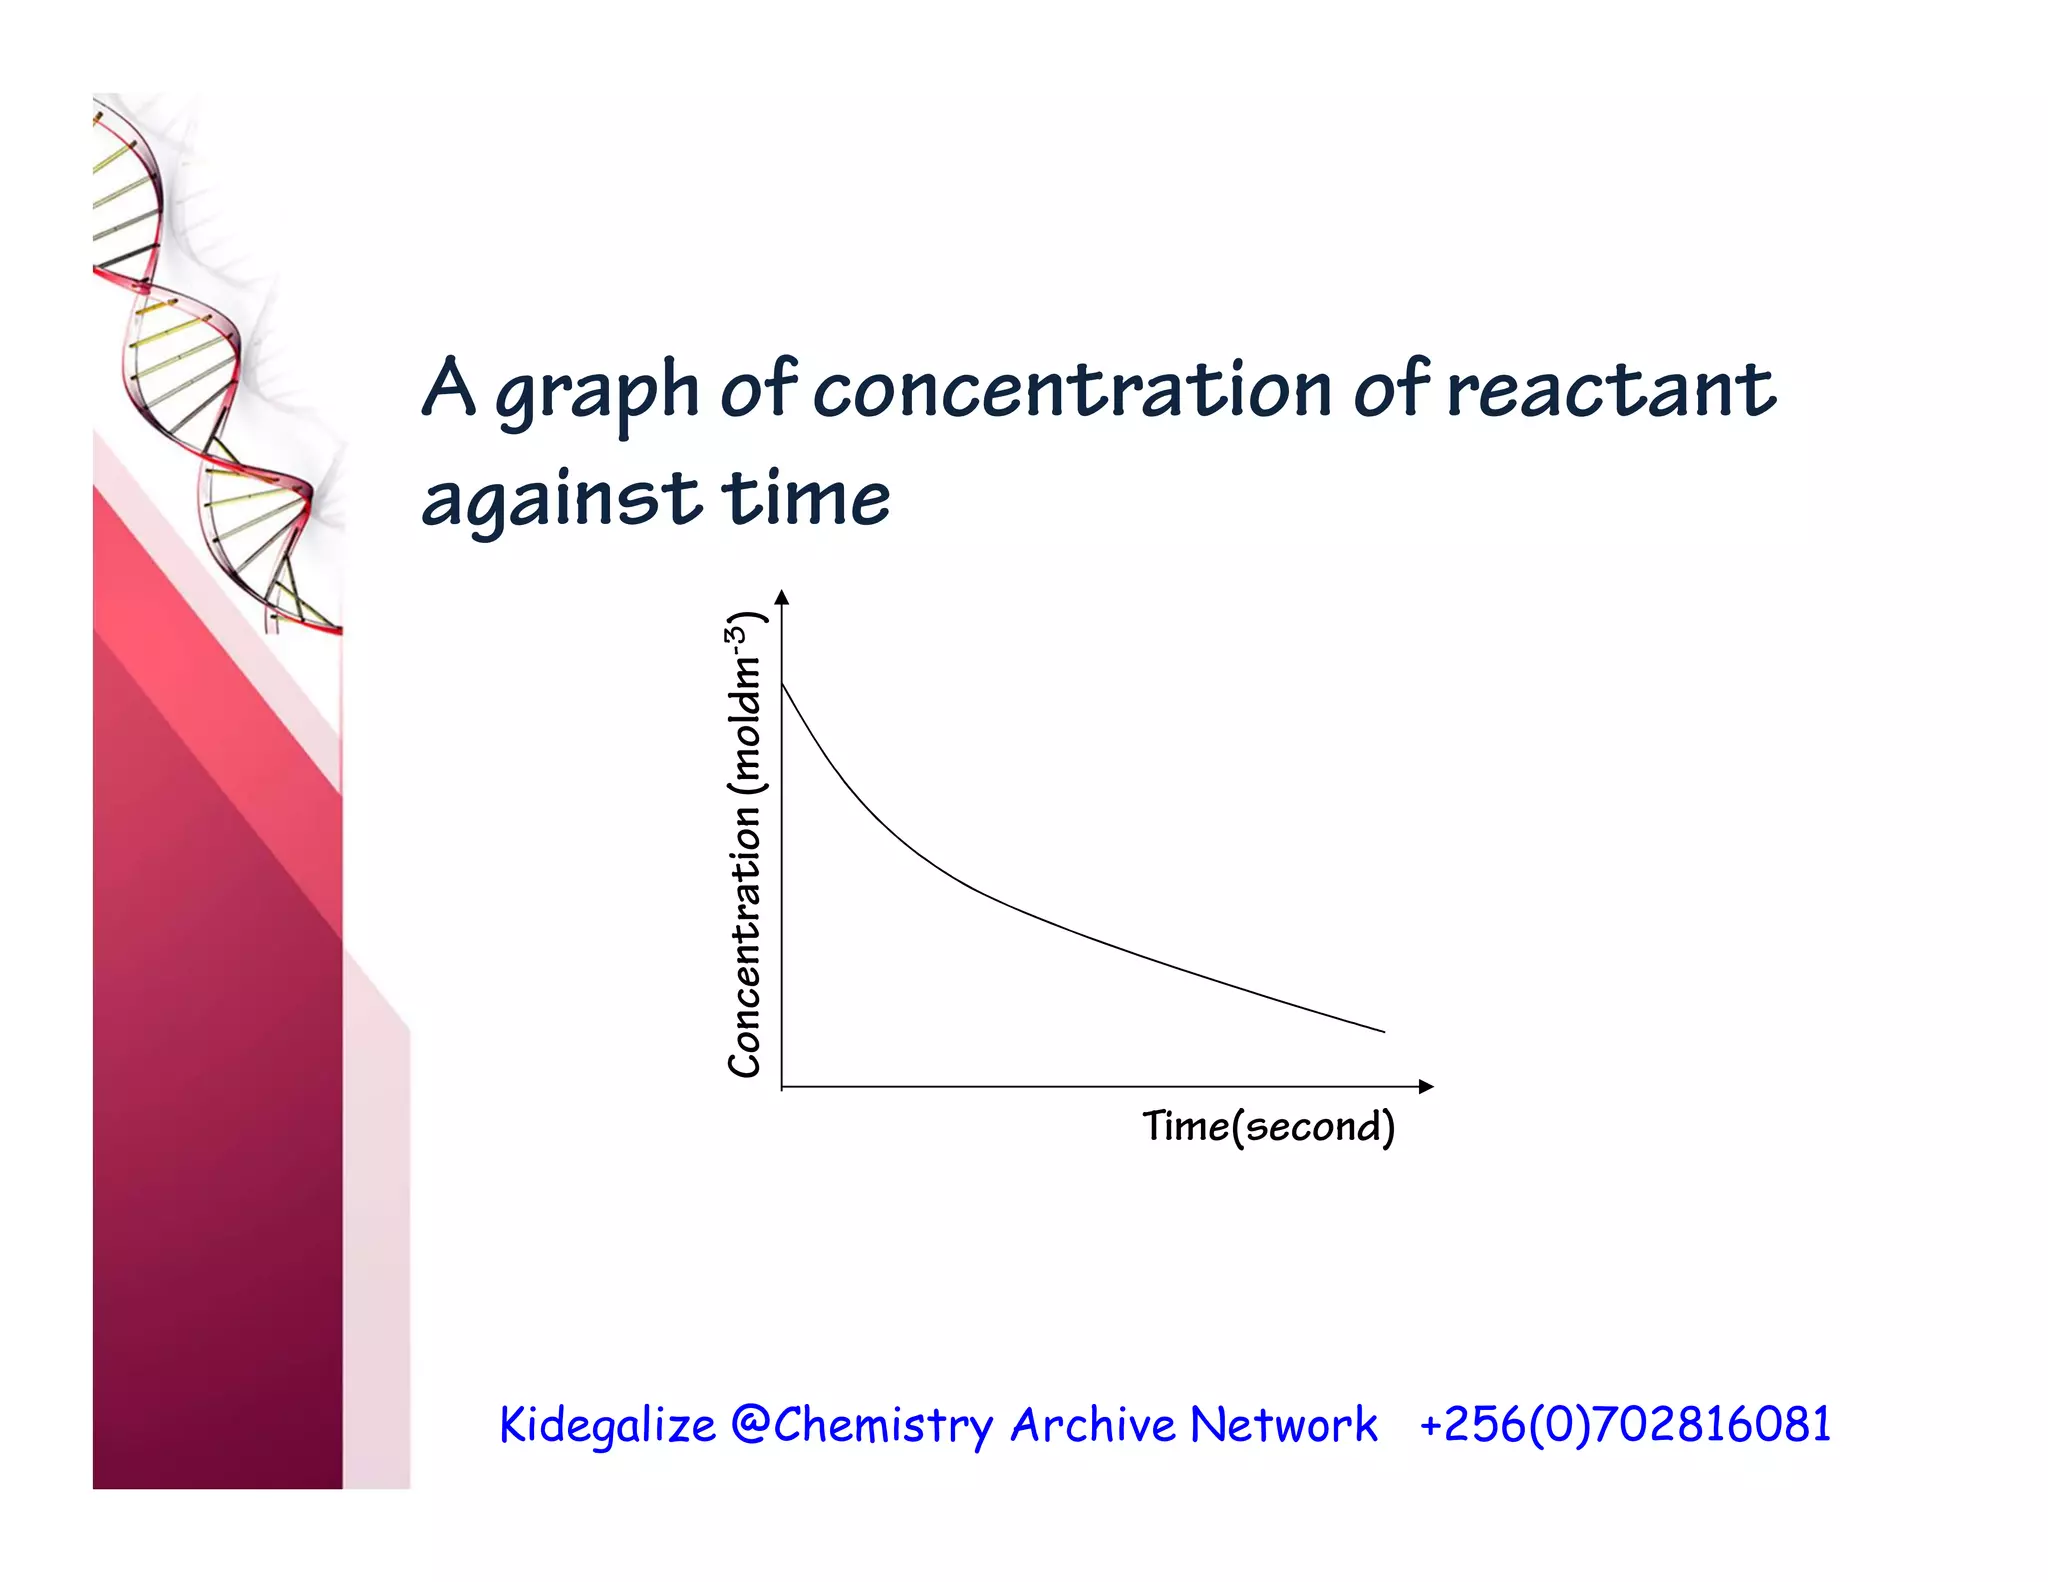
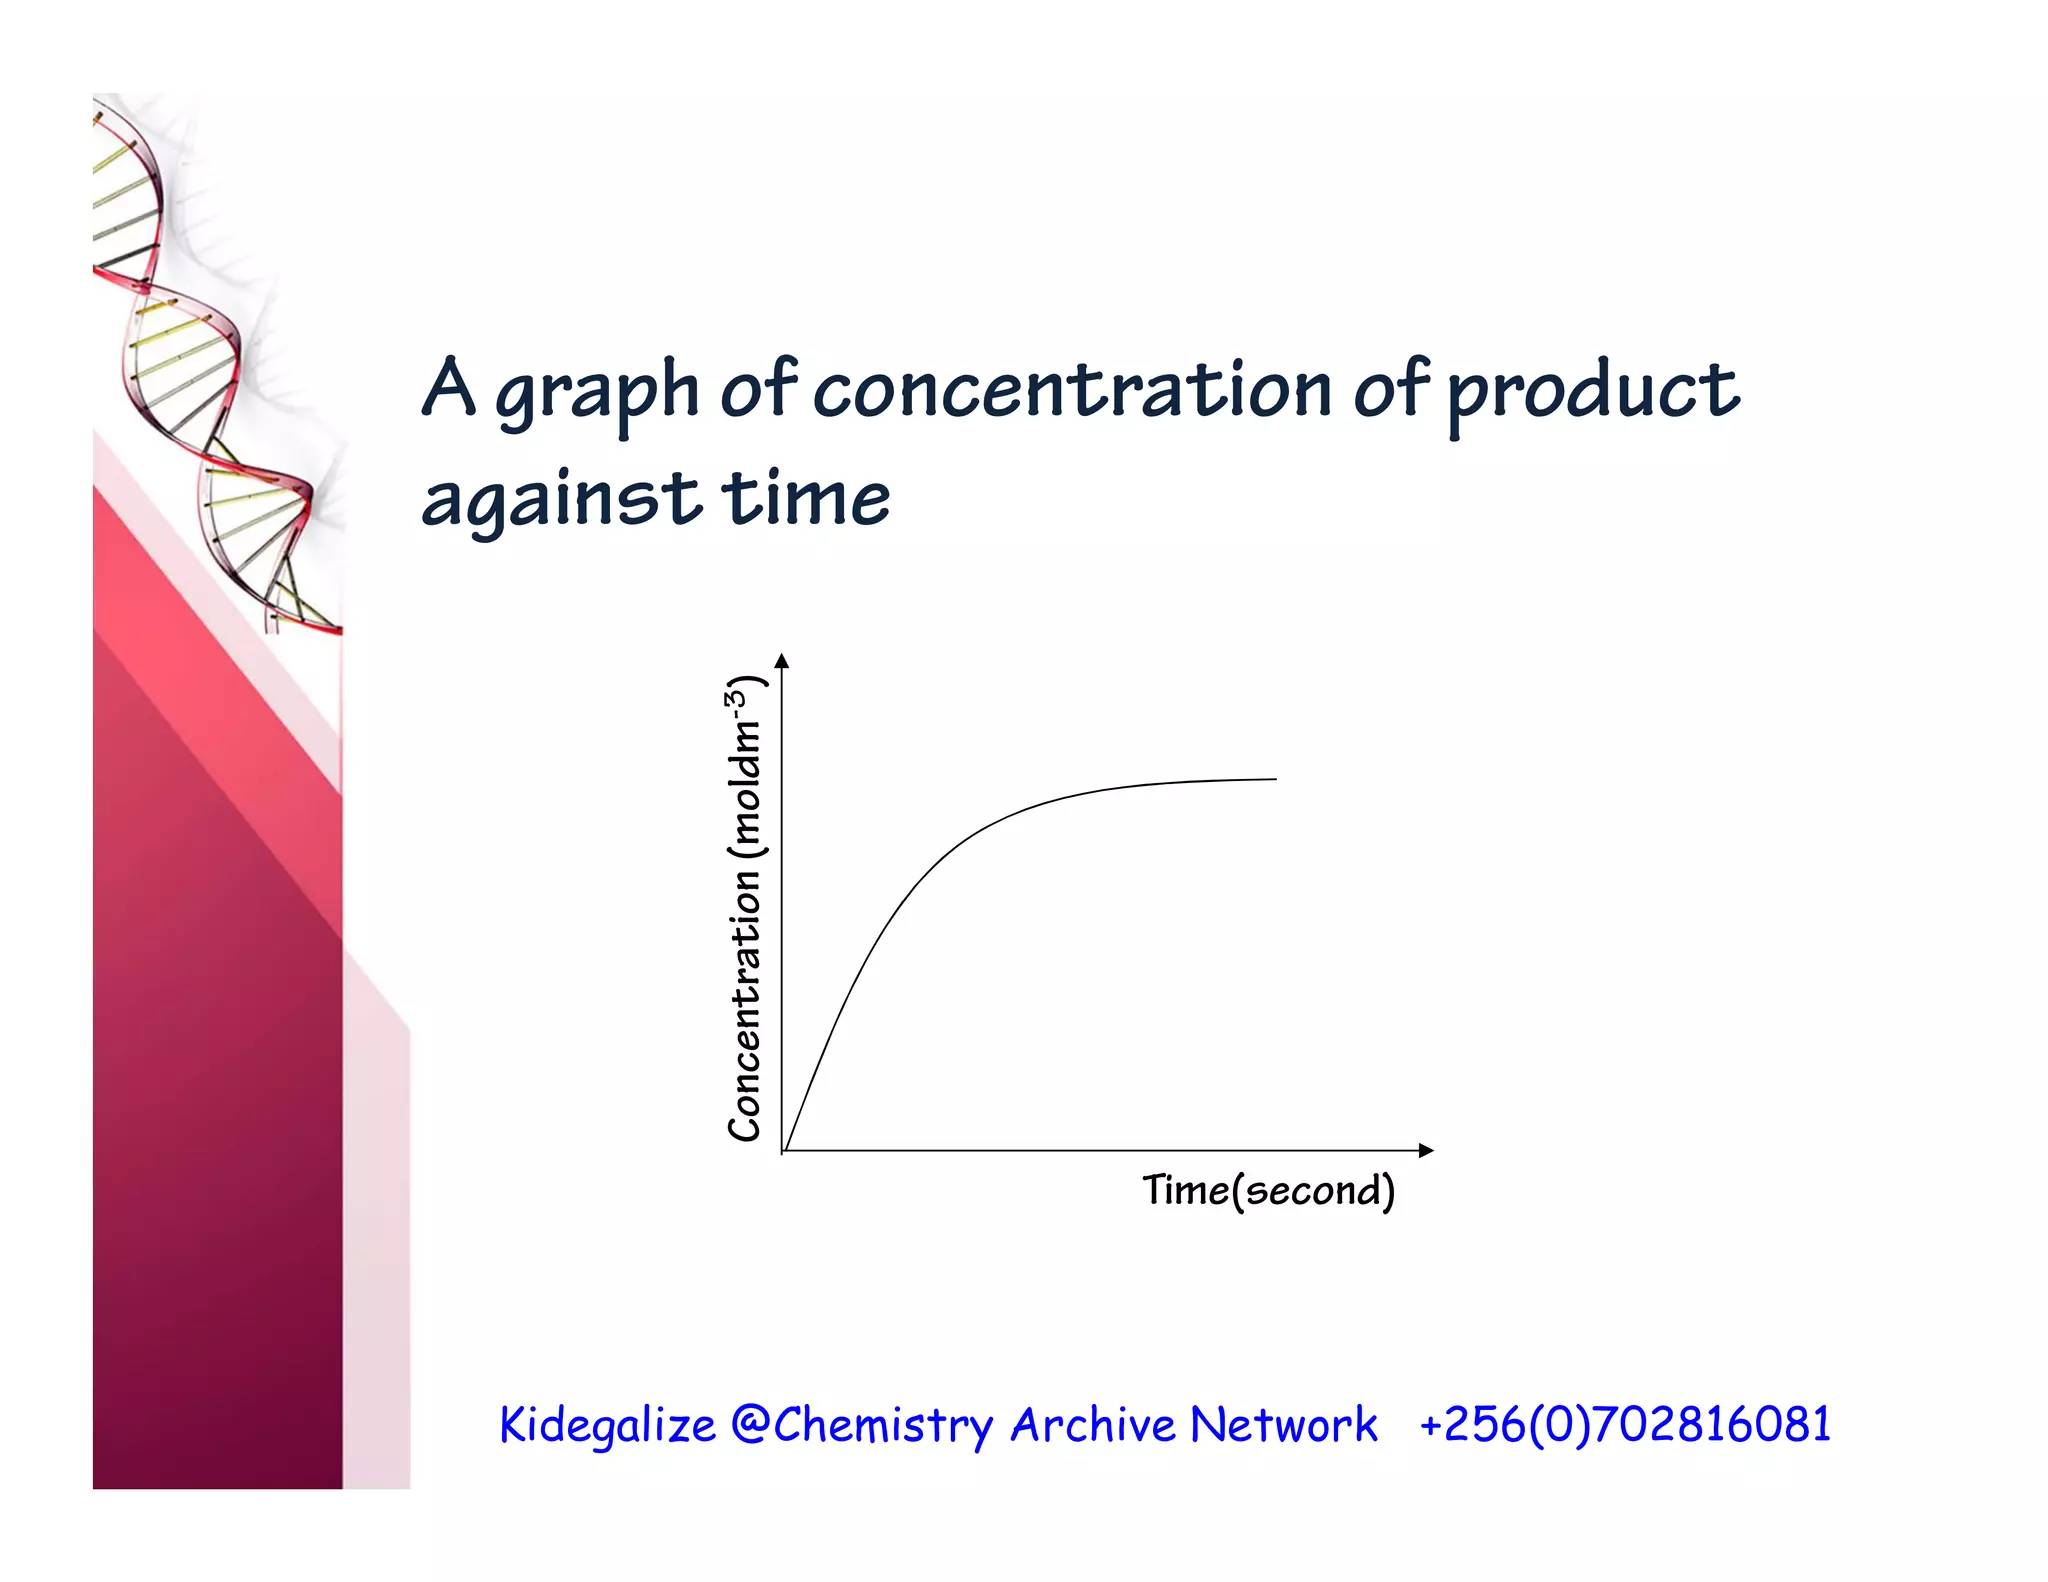
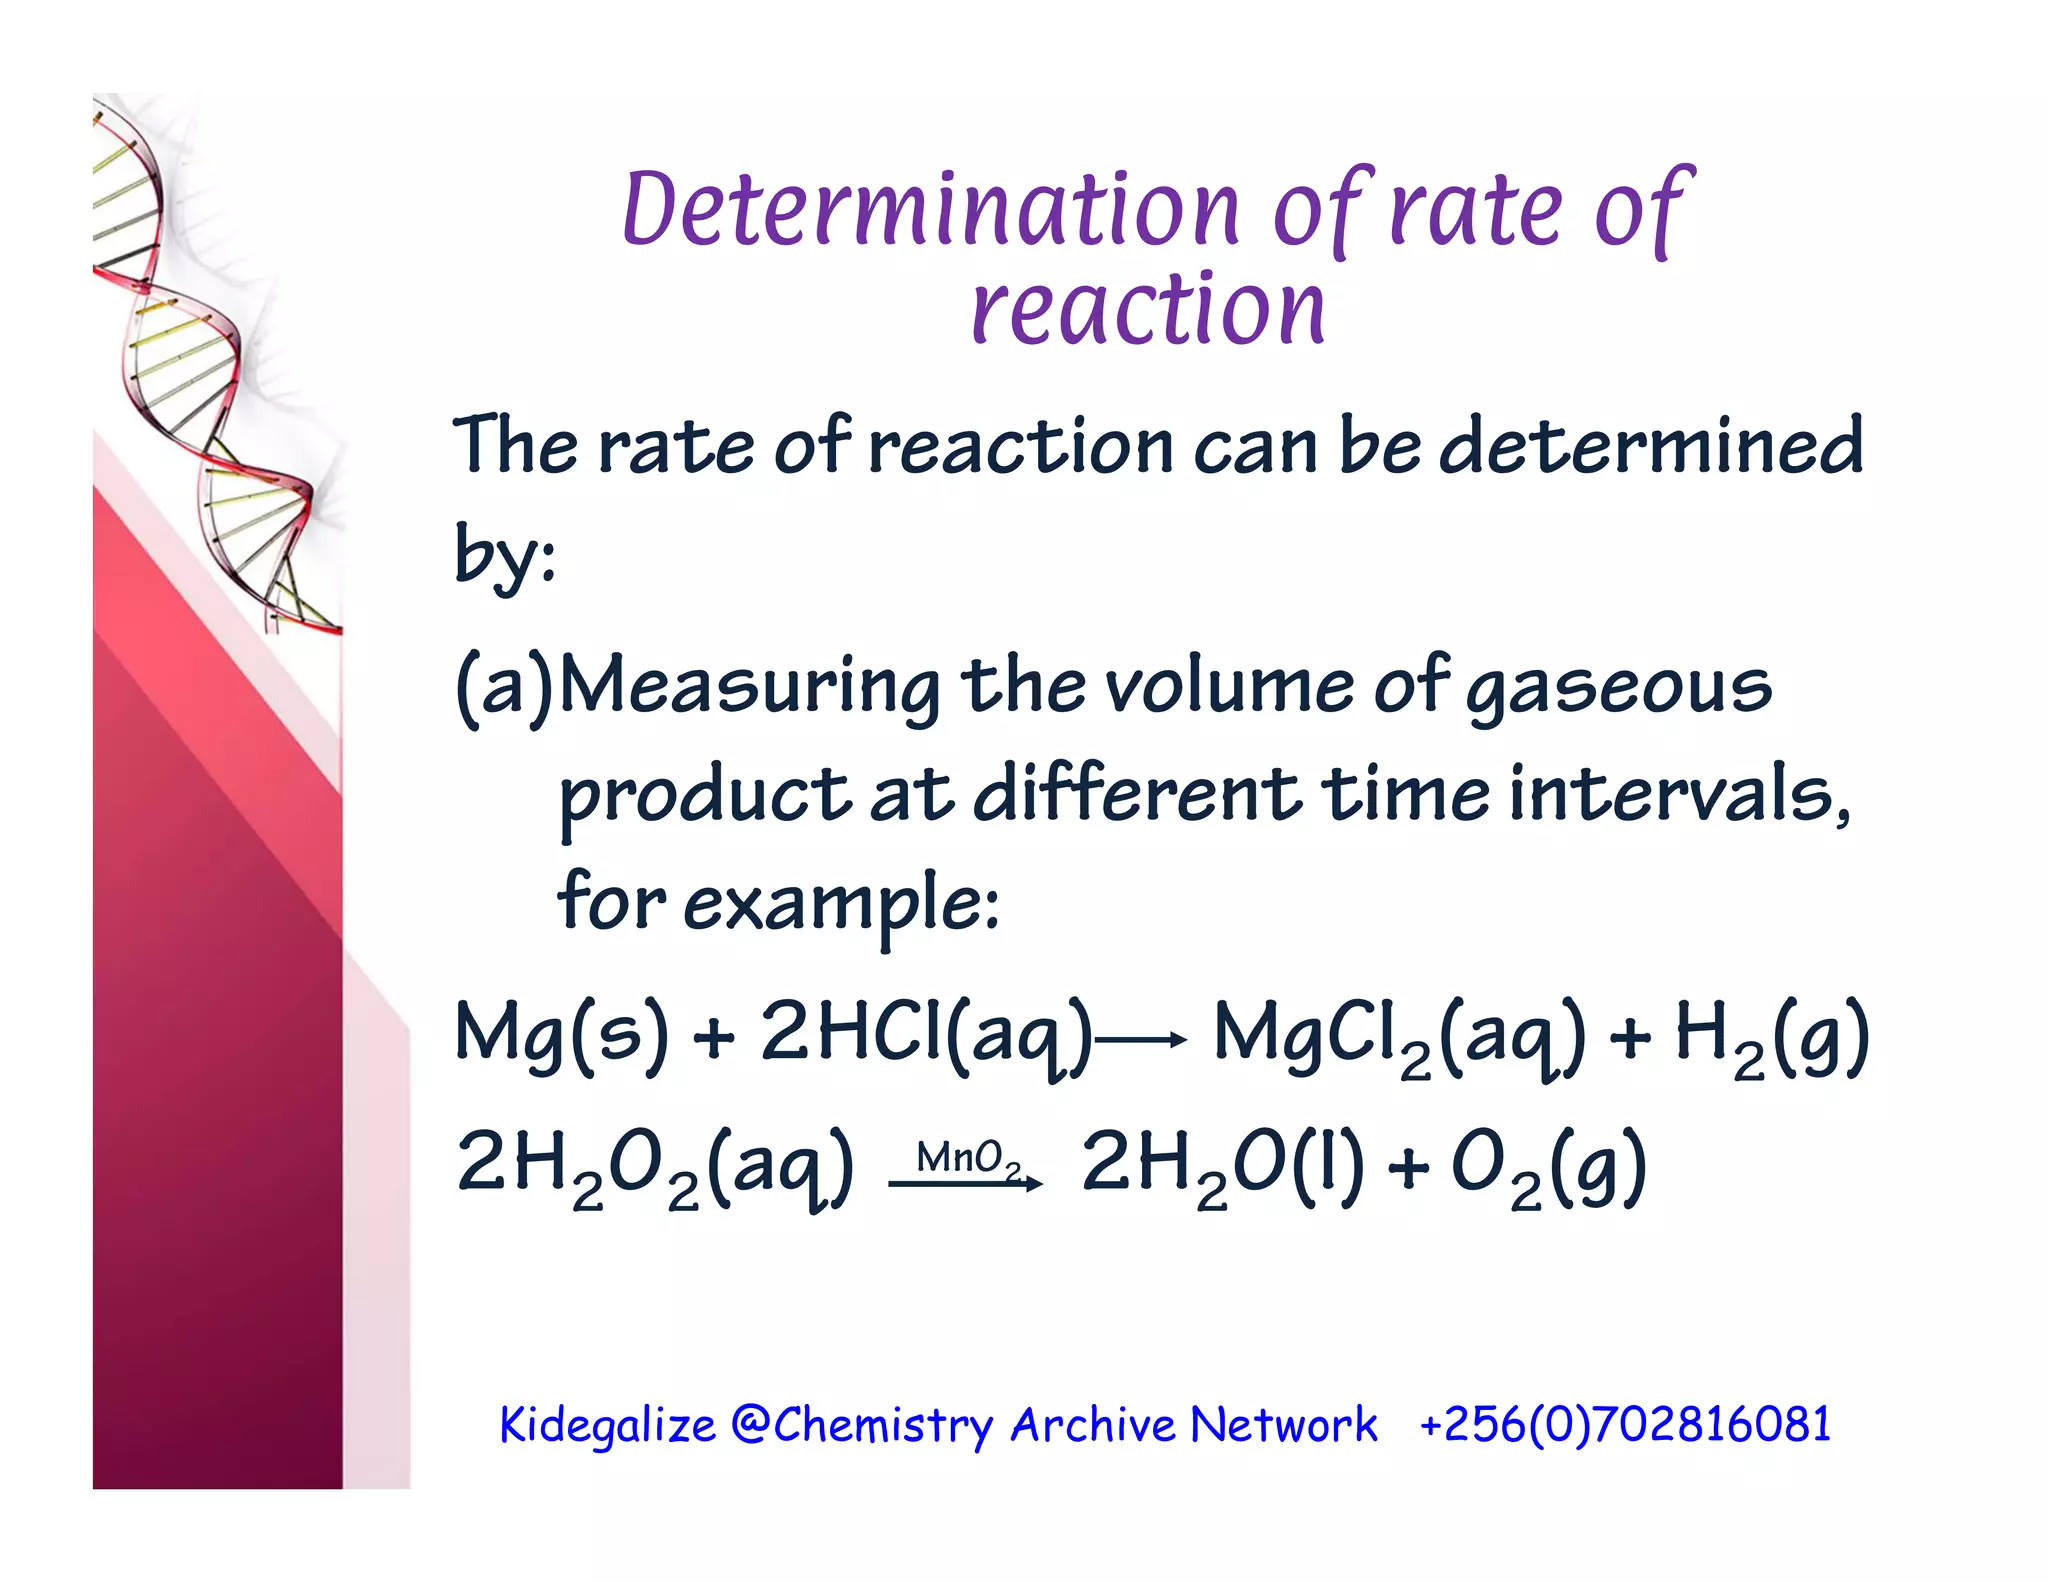
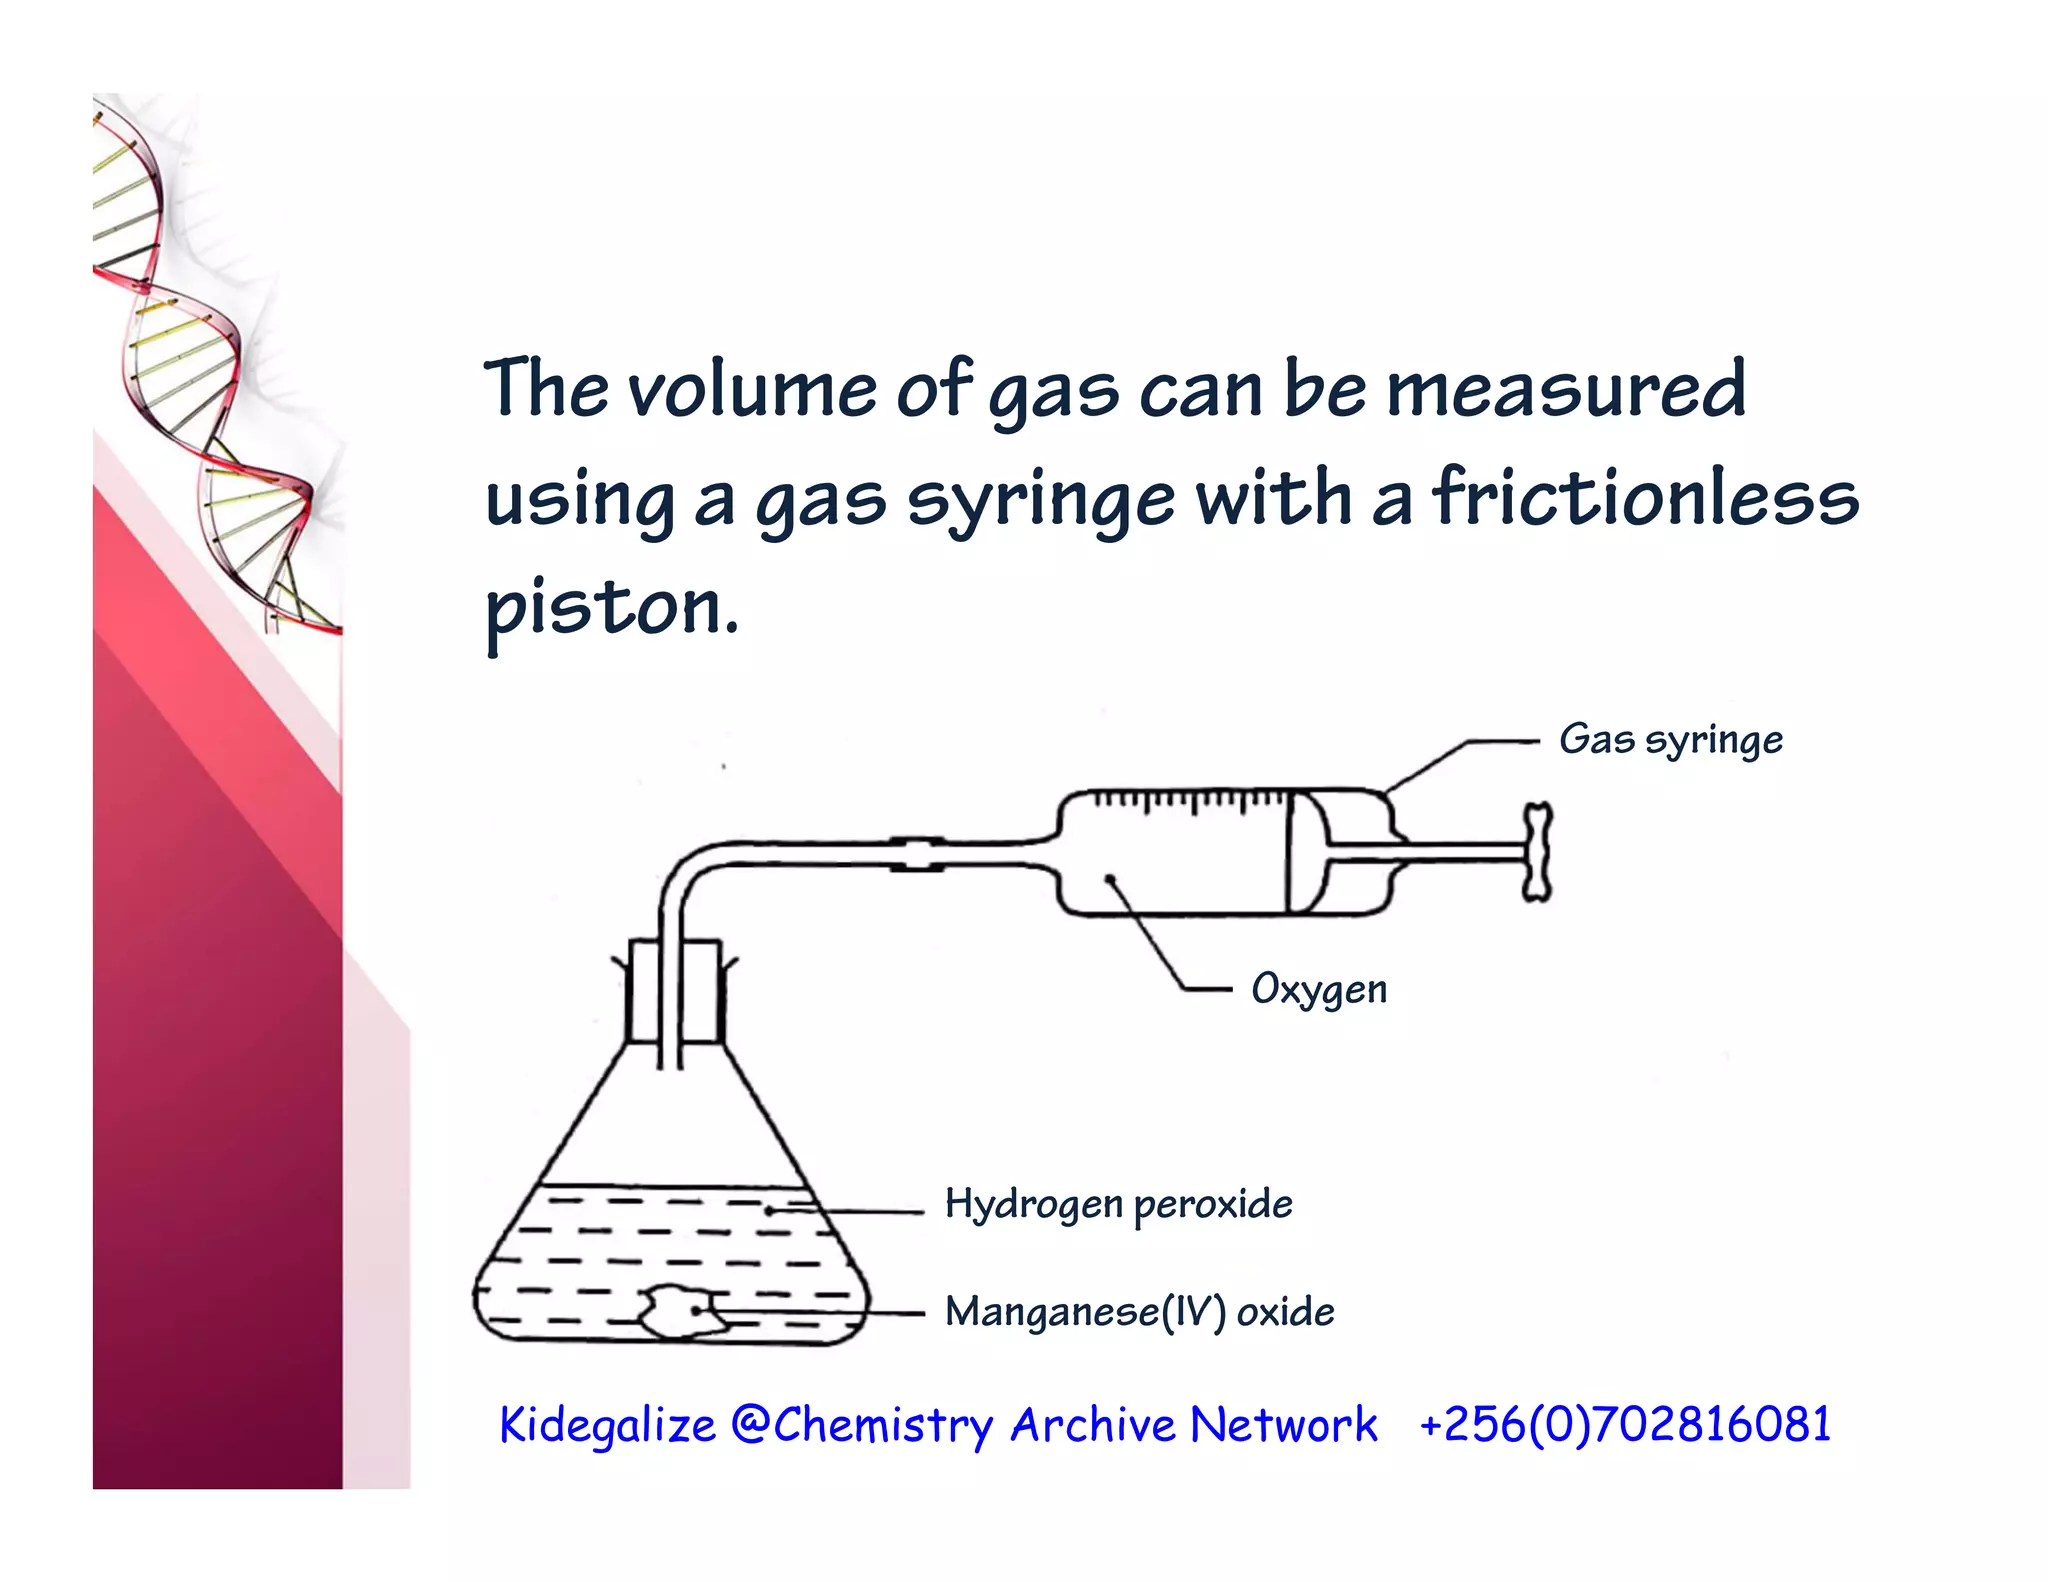
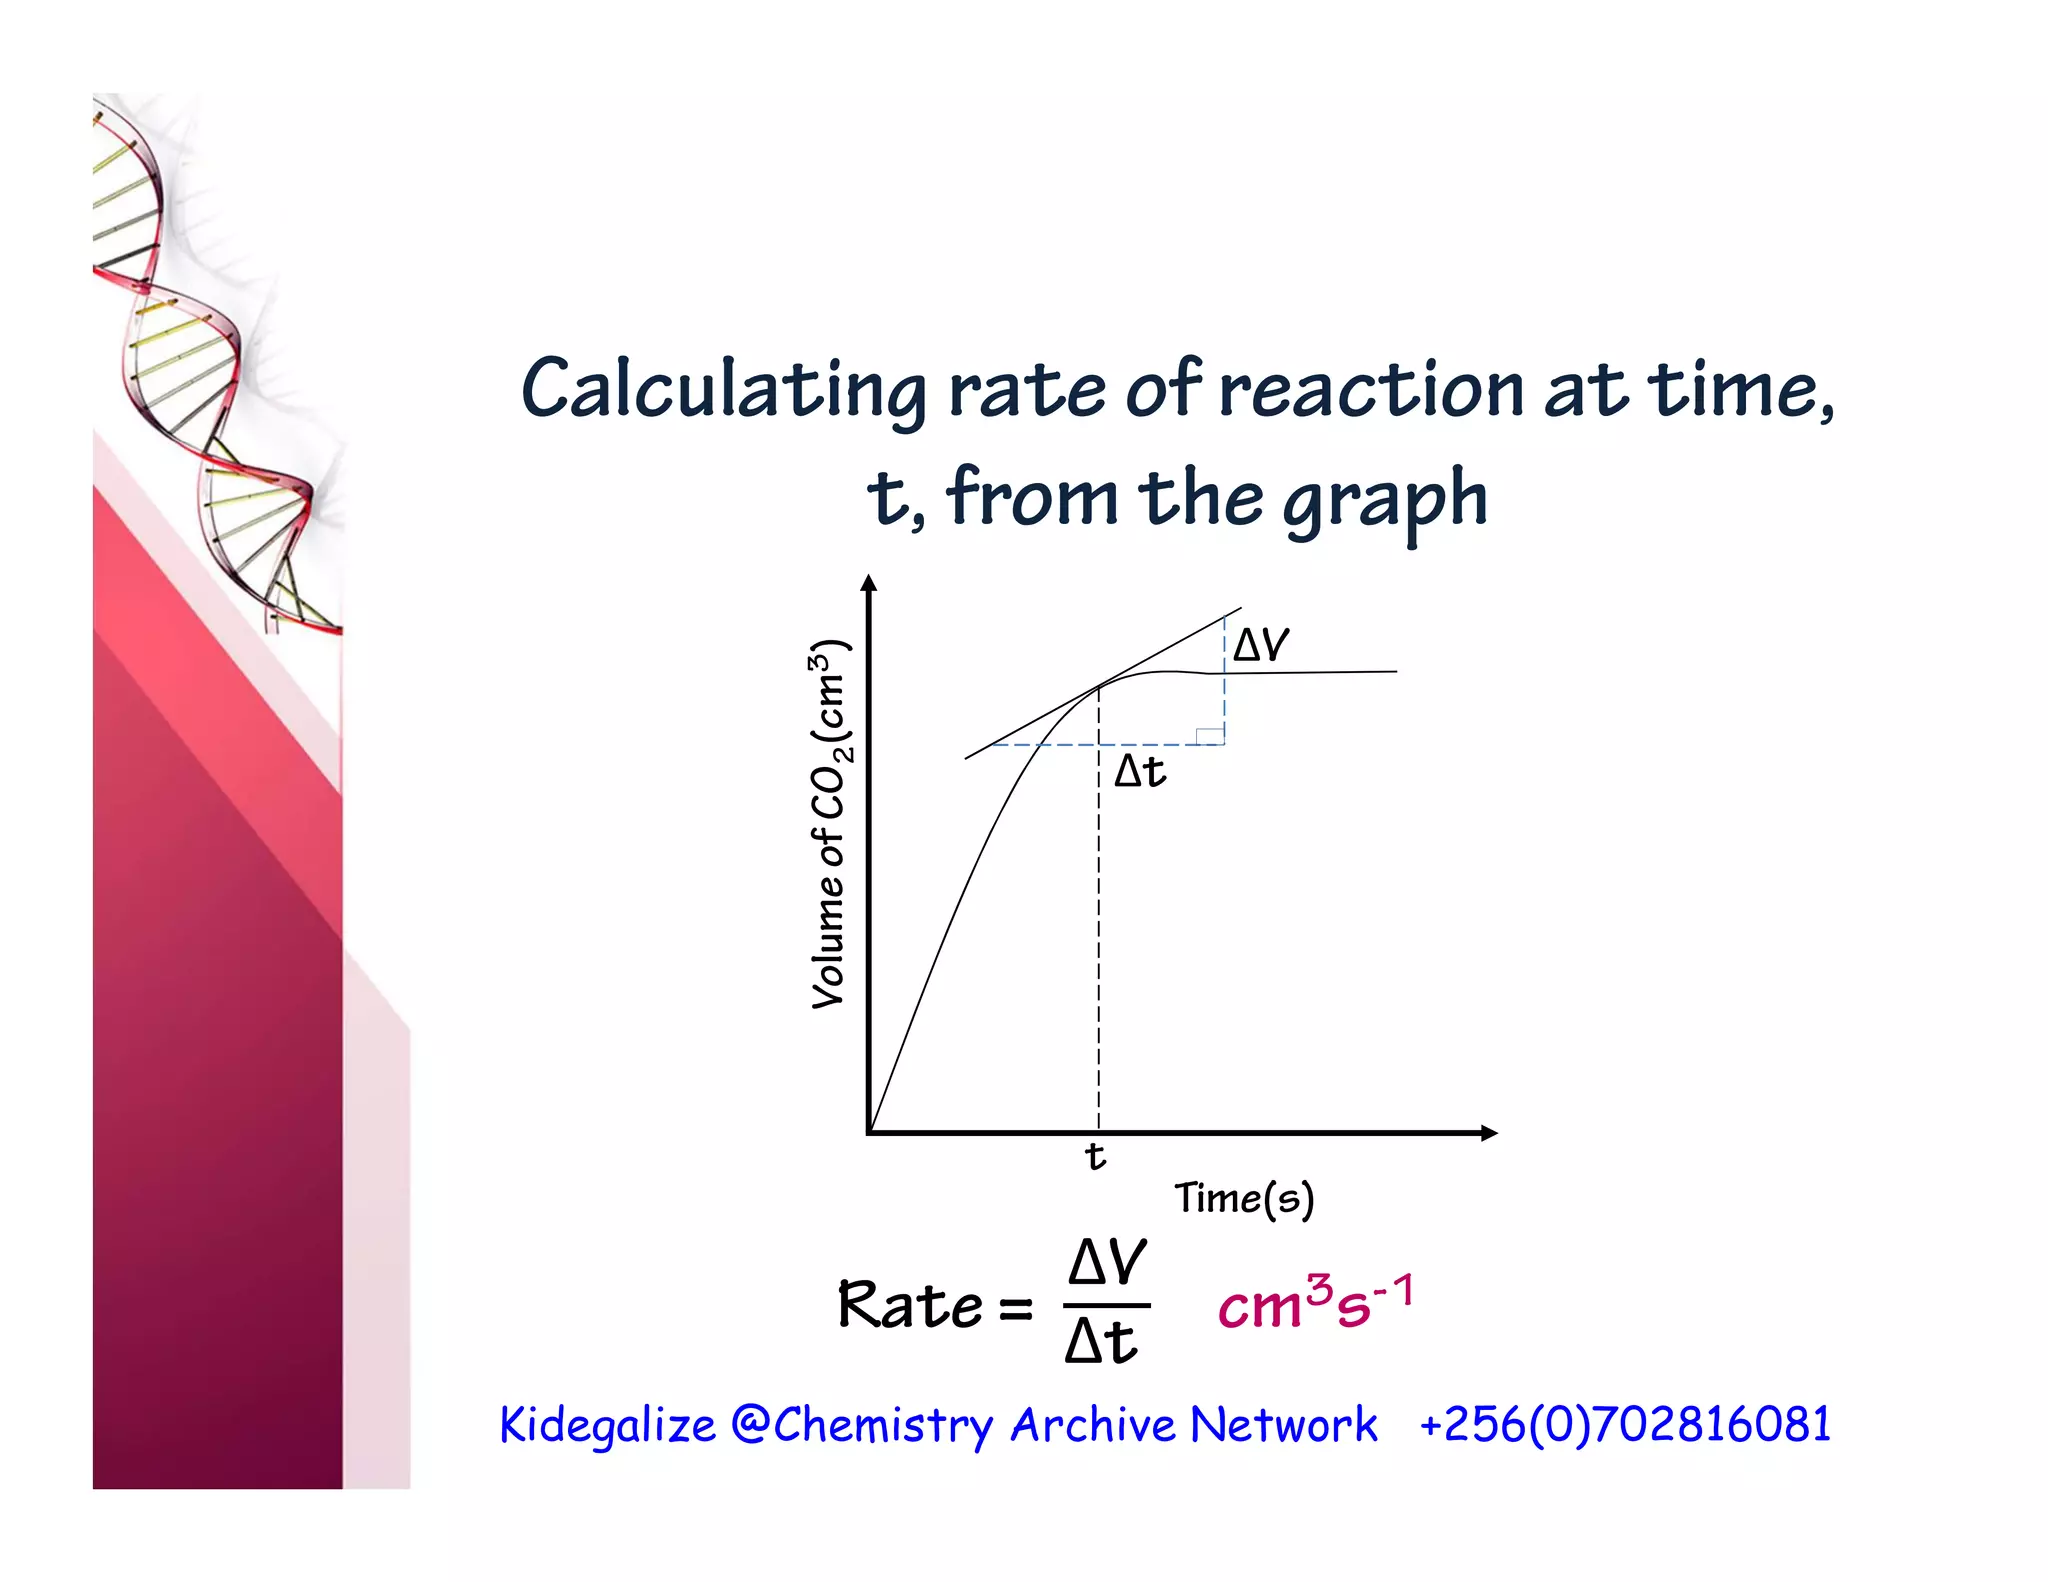
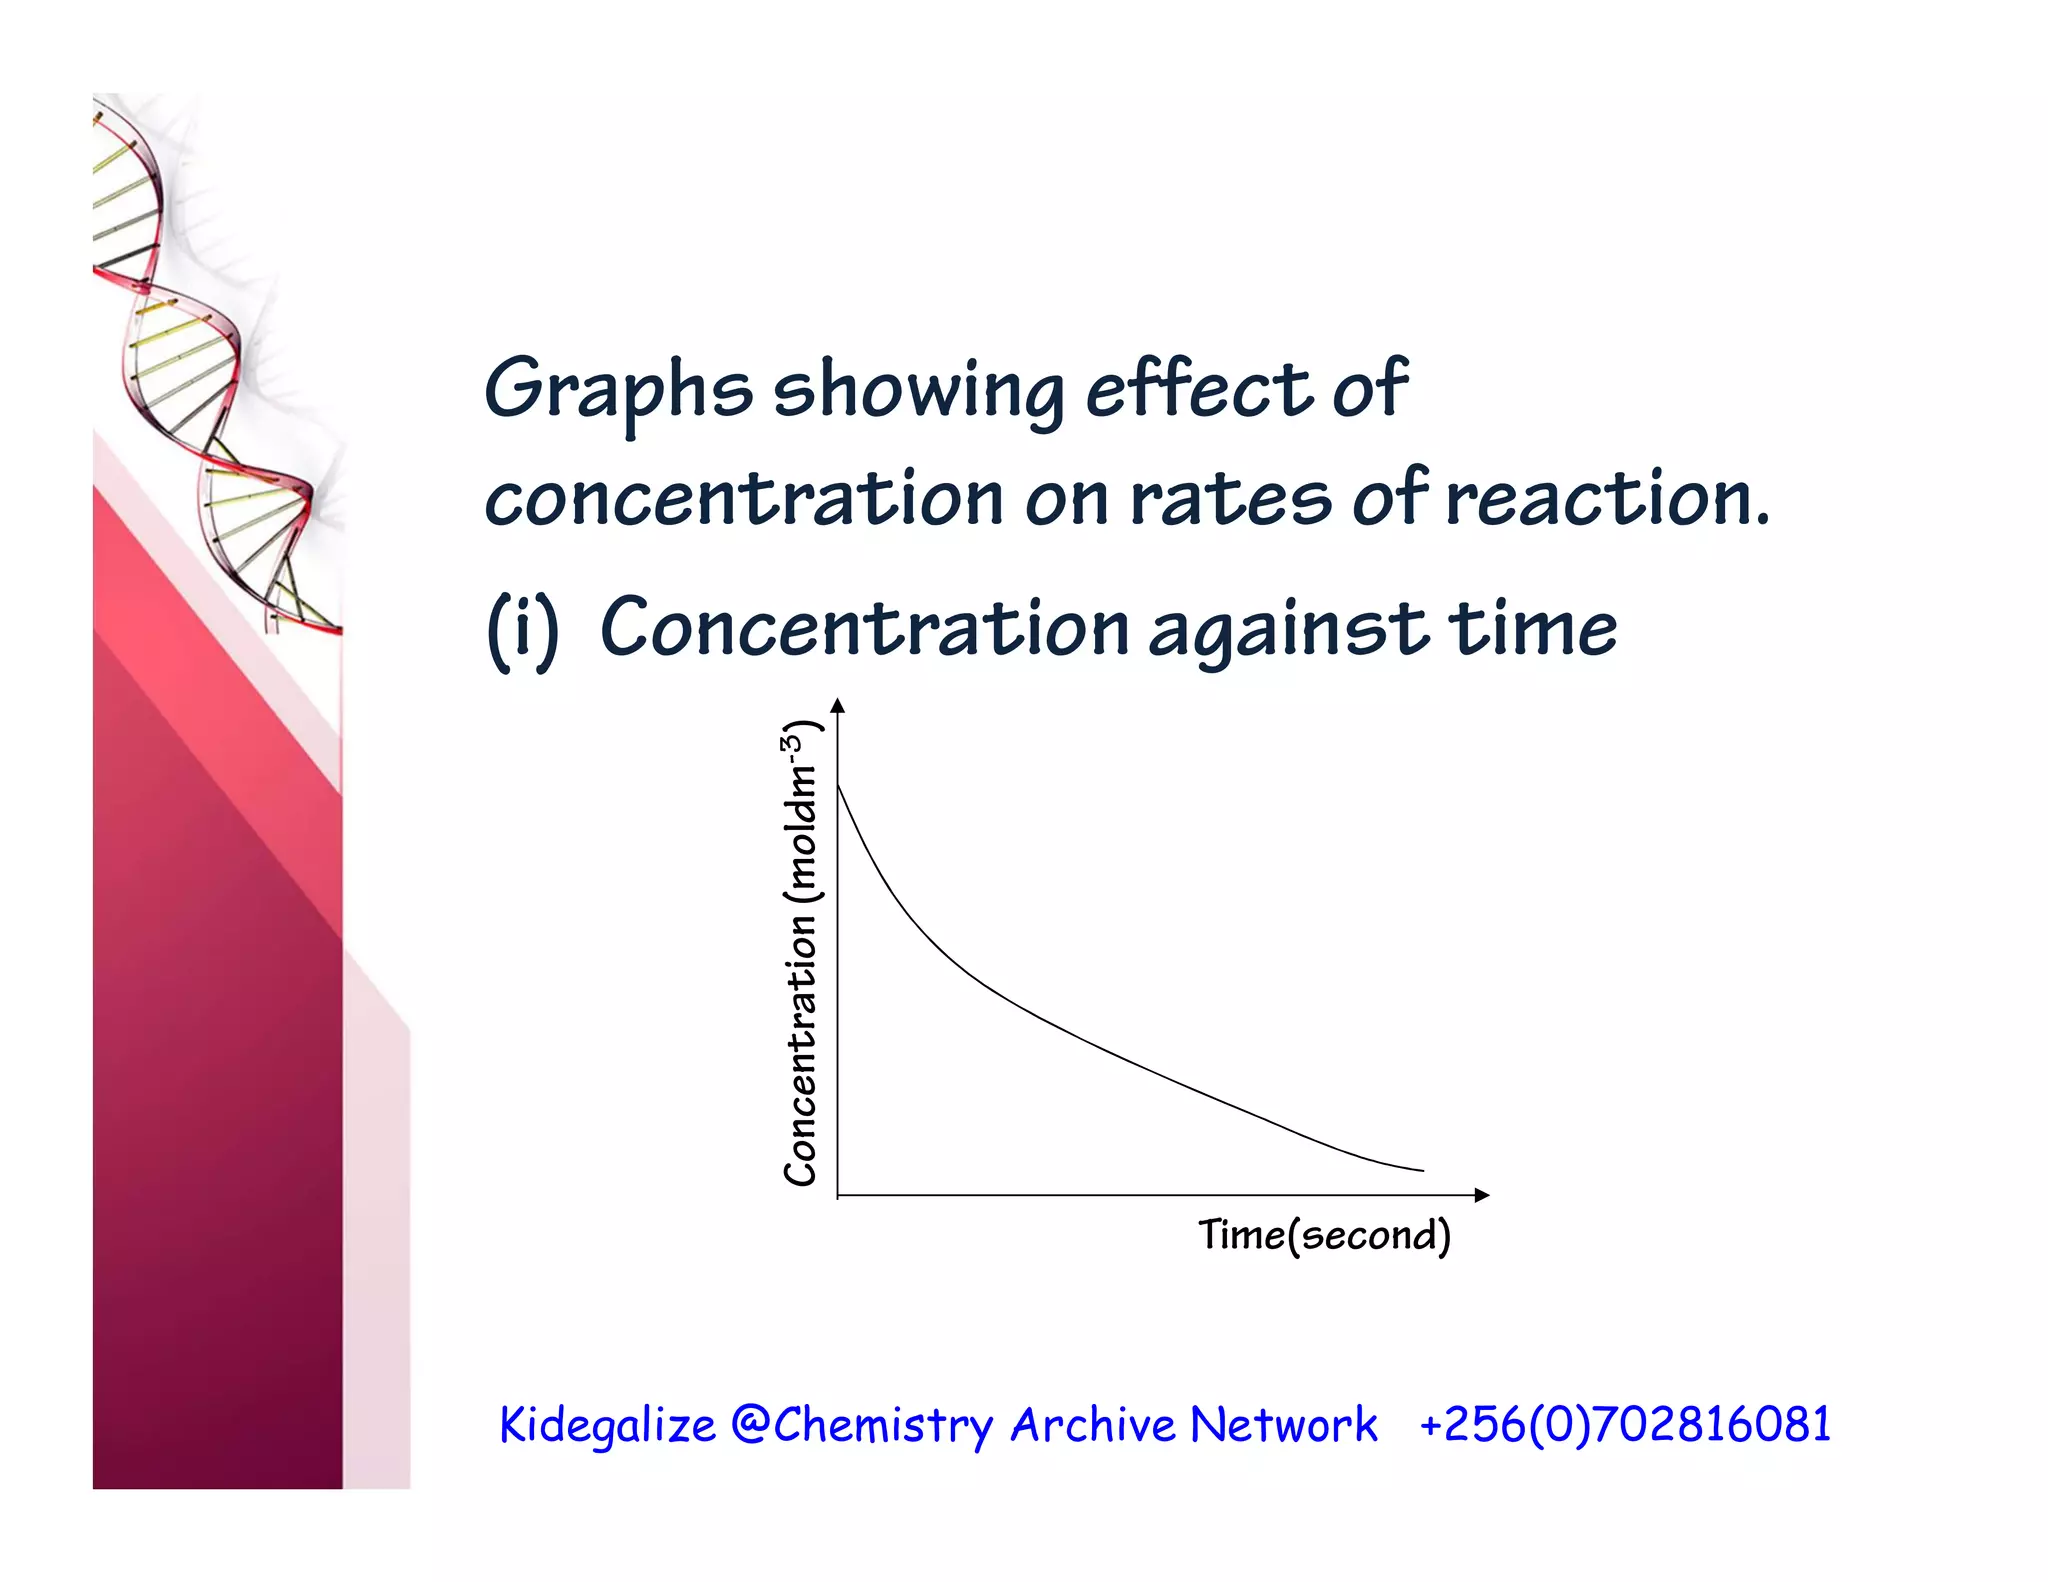
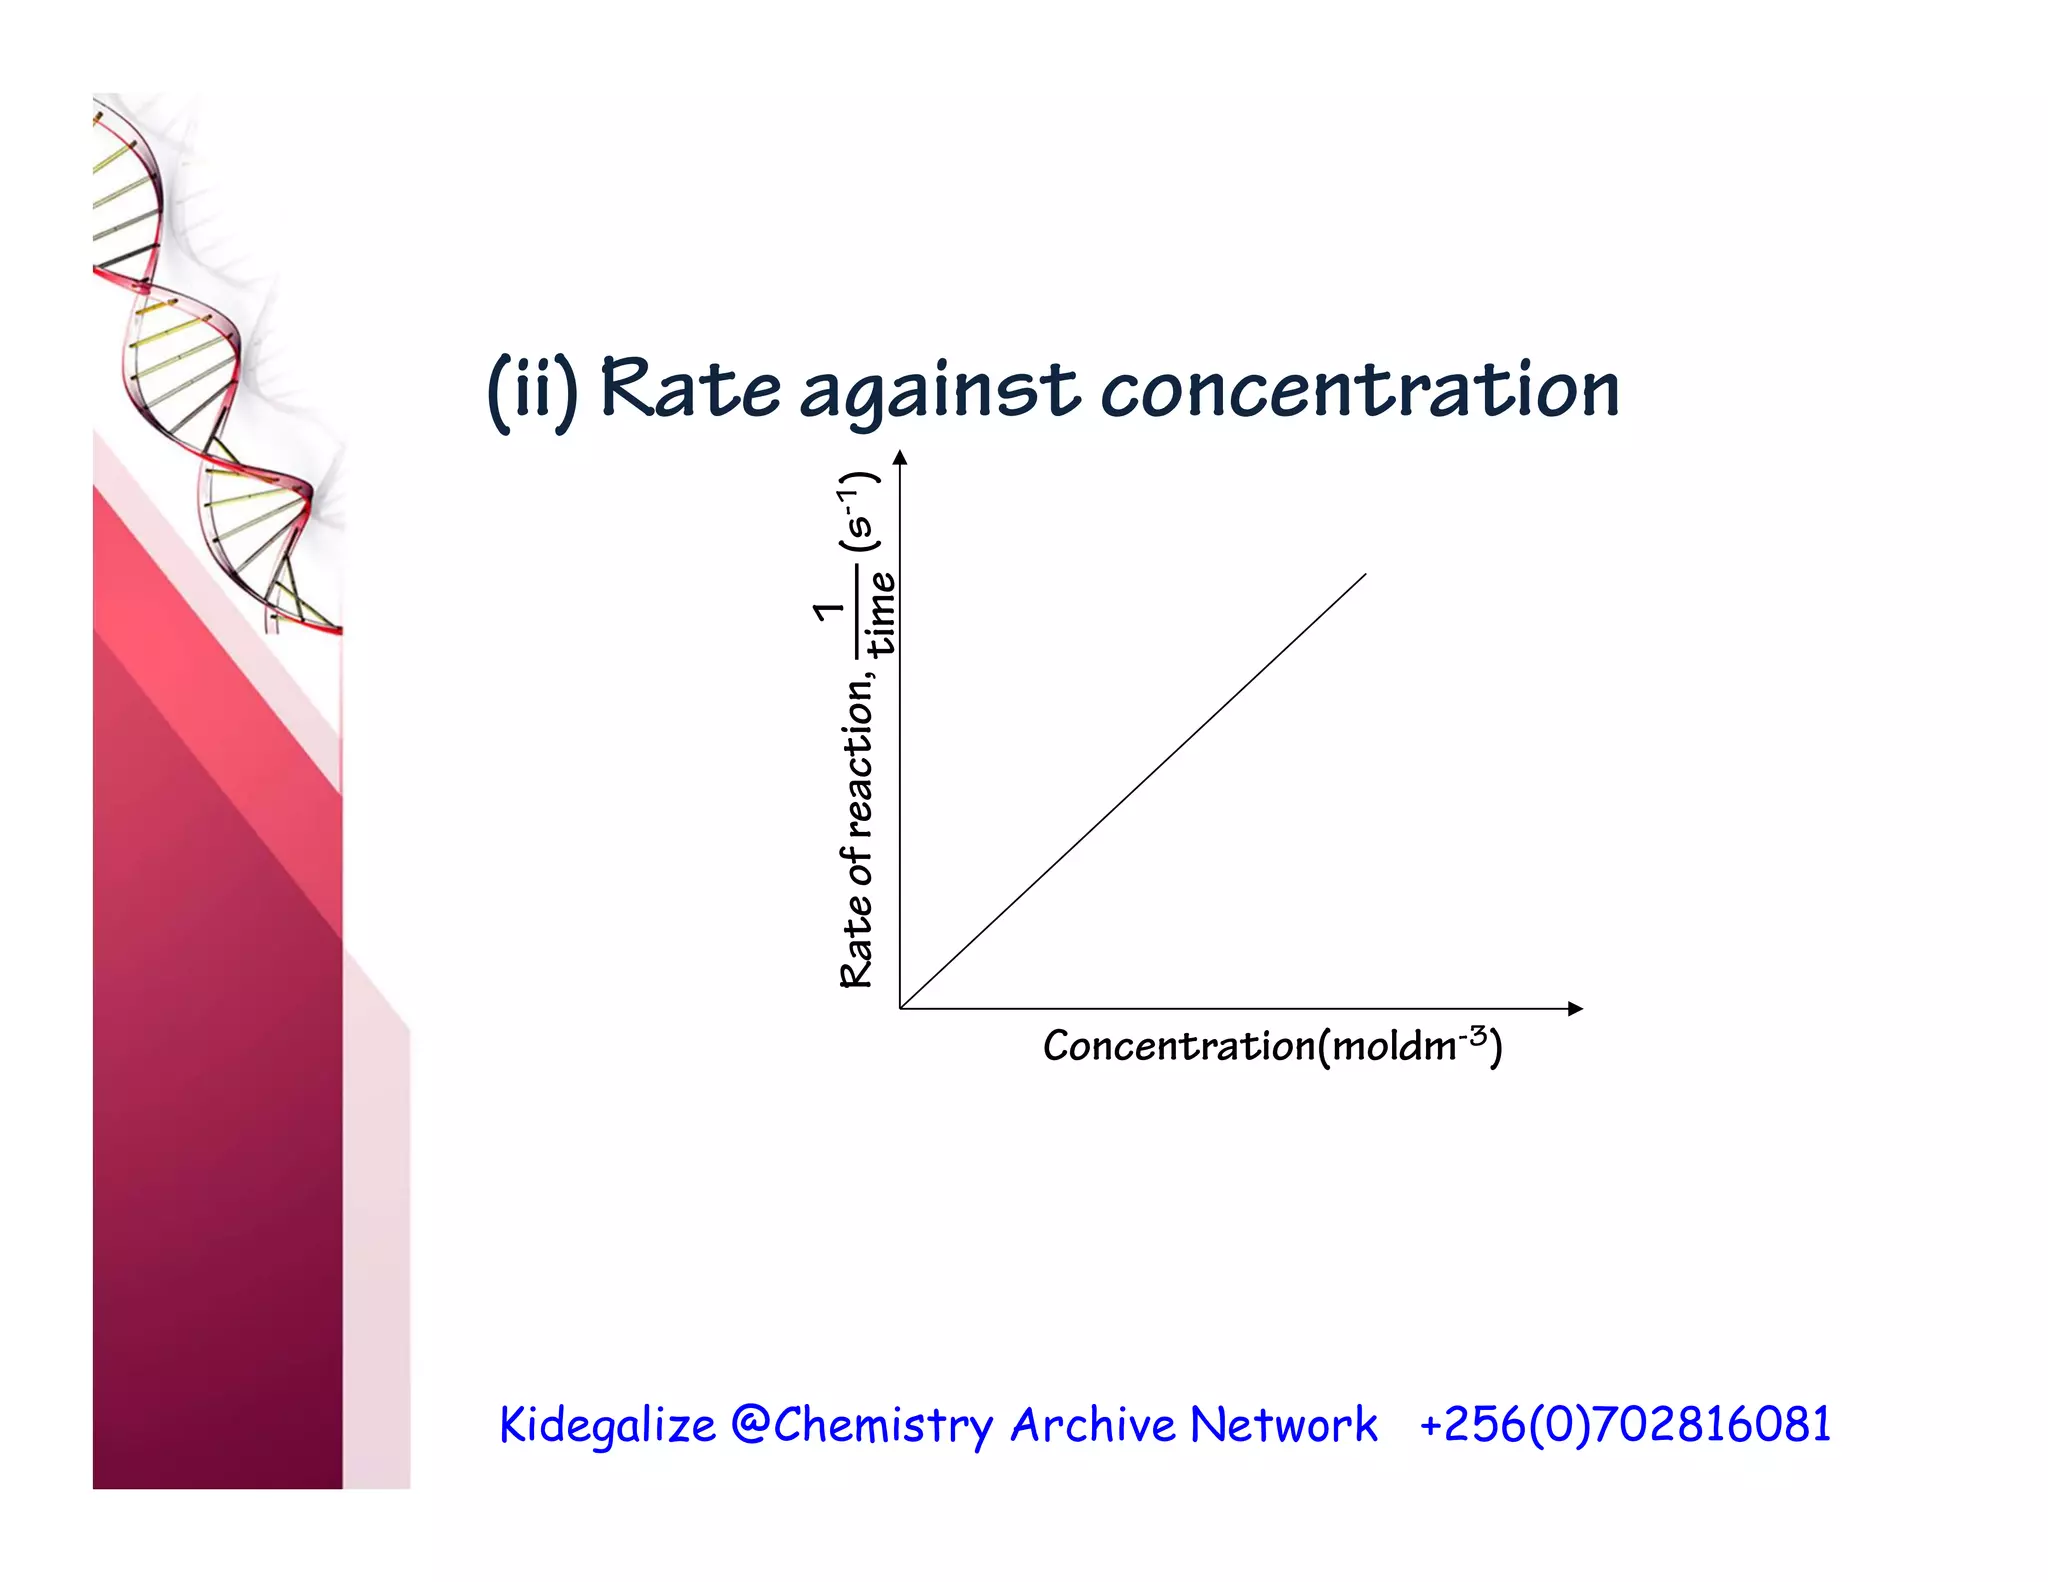
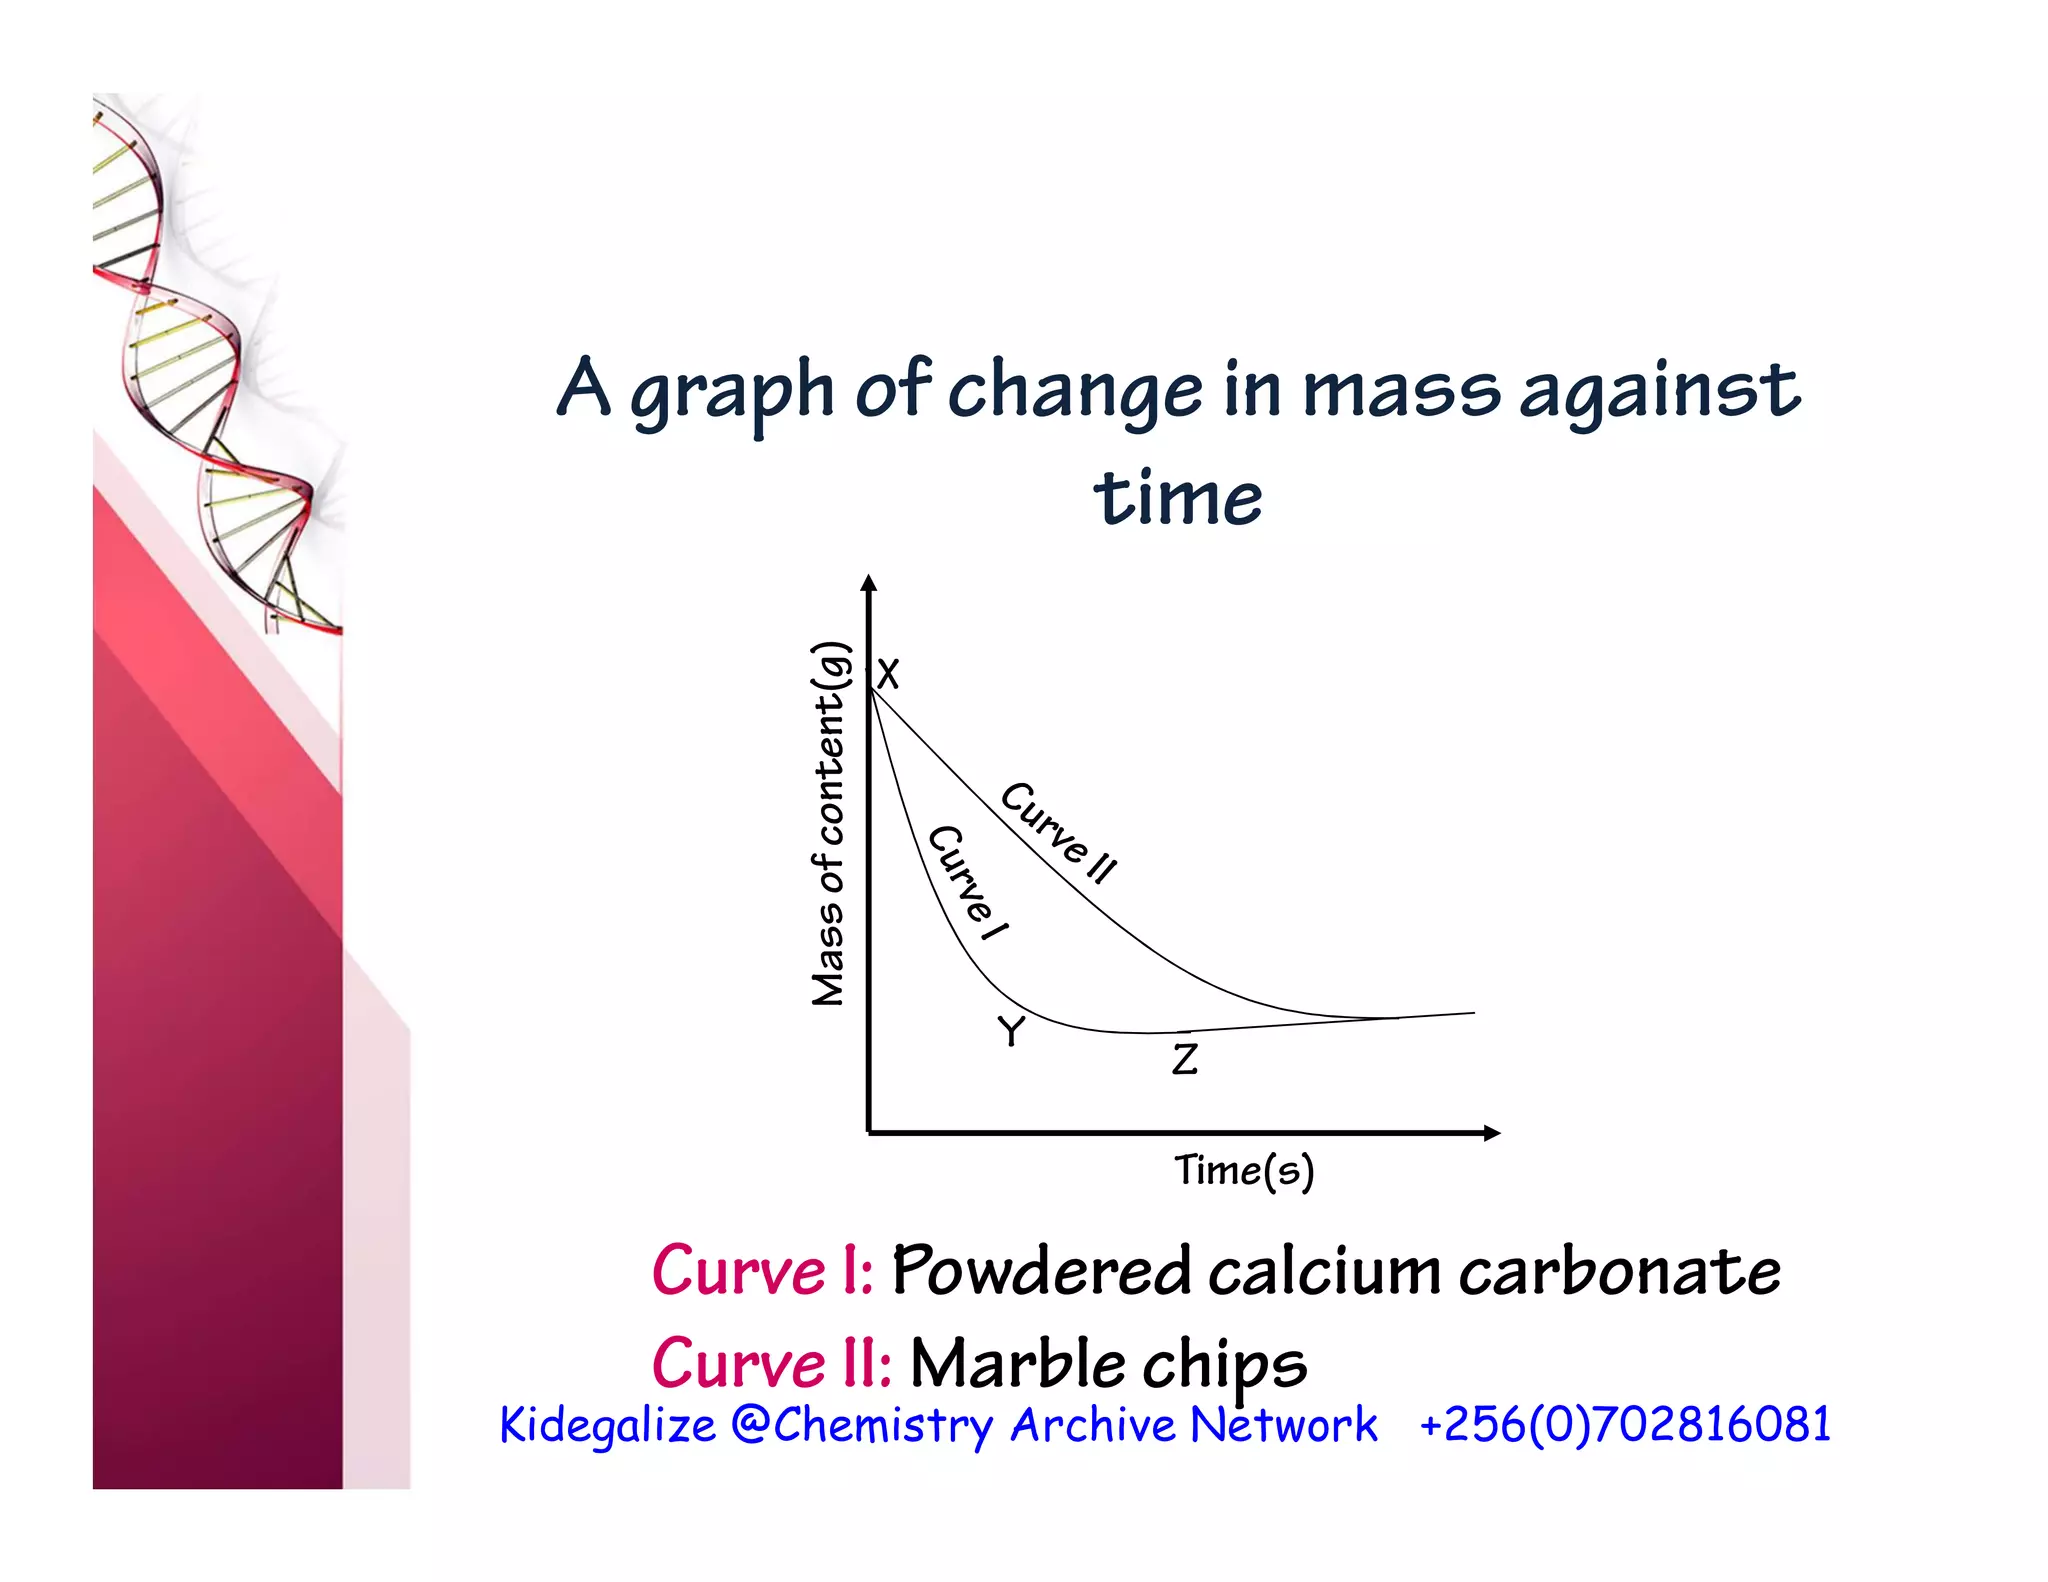
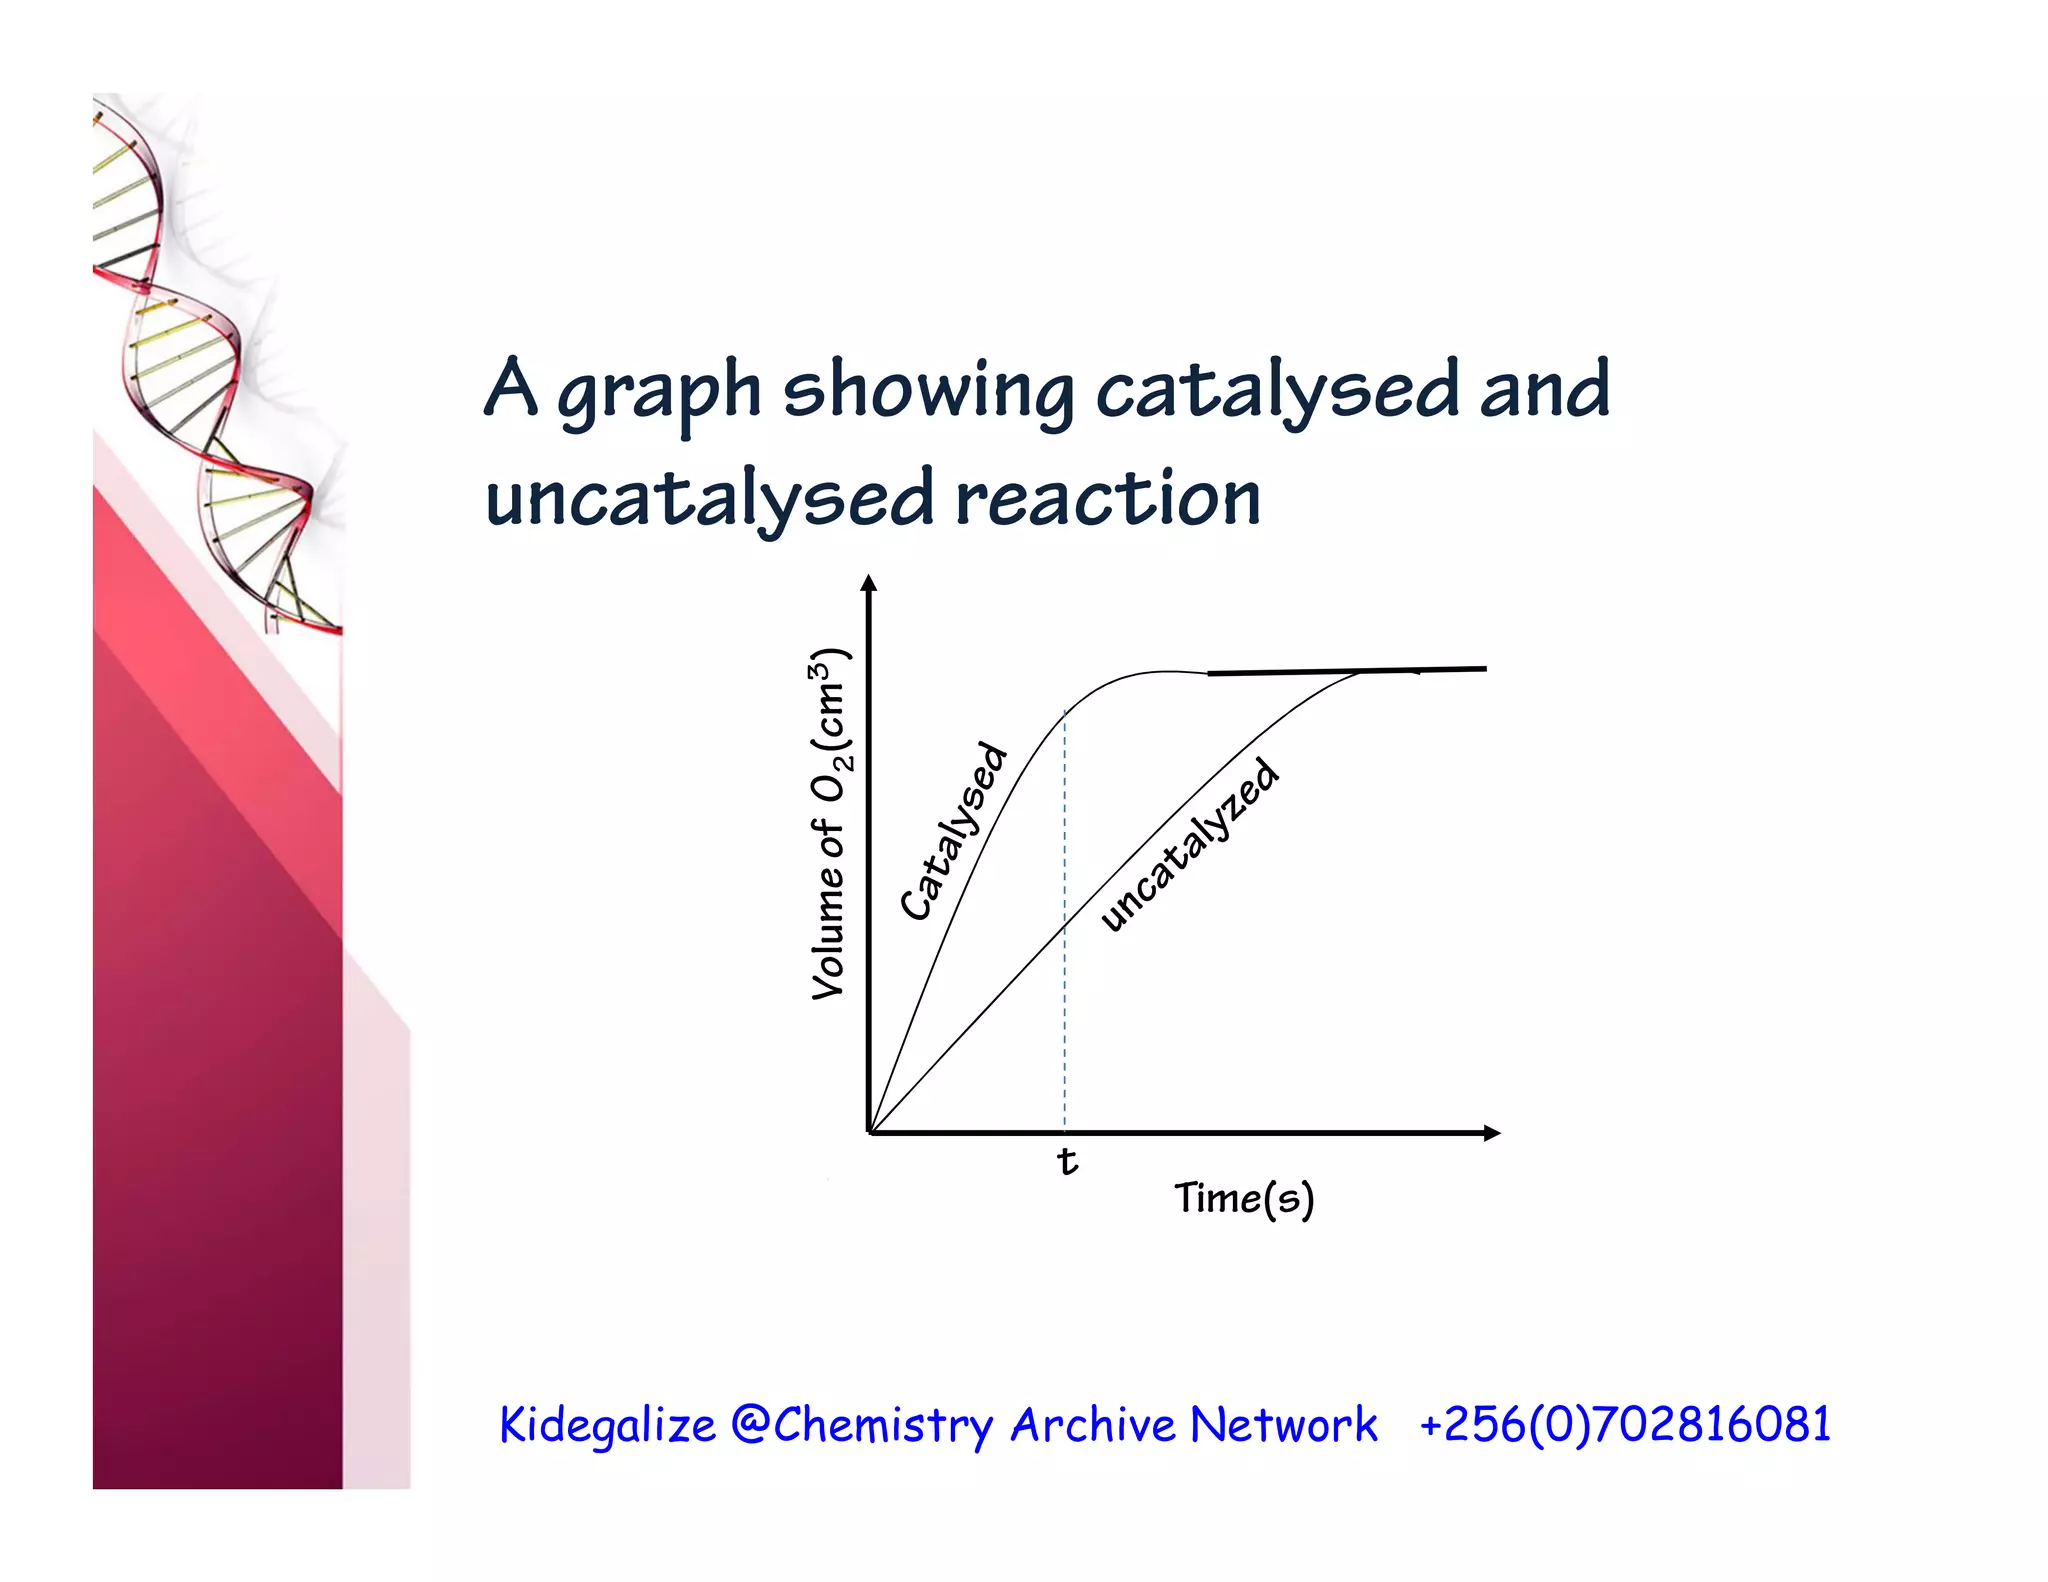
RATES OF REACTION
RATES OF REACTION
Charles Kidega
St. Gonzaga Budini Sec. Sch.
 c.kidega17@gmail.com
 +256(0)702816081
Kidegalize @Chemistry Archive Network +256(0)702816081
Introduction to rate of reaction
Rate of reaction is the change in the
mass/ concentration/ volume of a given
reactant/ product during the course of
reaction per unit time.
Rate of reaction =
change in amount
change in time
The rate of reaction with respect to
reactant is NEGATIVE because its
amount decreases with time.
Kidegalize @Chemistry Archive Network +256(0)702816081
A graph of concentration of reactant
against time
Time(second)
Concentration
(moldm
-3
)
Kidegalize @Chemistry Archive Network +256(0)702816081
A graph of concentration of product
against time
Time(second)
Concentration
(moldm
-3
)
Kidegalize @Chemistry Archive Network +256(0)702816081
Rate of reaction is inversely
proportional to the time of reaction.
Rate
1
time
Thus a fast reaction takes a short
time and a slow reaction takes a long
time to reach completion.
Kidegalize @Chemistry Archive Network +256(0)702816081
Determination of rate of
reaction
The rate of reaction can be determined
by:
(a)Measuring the volume of gaseous
product at different time intervals,
for example:
Mg(s) + 2HCl(aq) MgCl2(aq) + H2(g)
2H2O2(aq) 2H2O(l) + O2(g)
MnO2
Kidegalize @Chemistry Archive Network +256(0)702816081
The volume of gas can be measured
using a gas syringe with a frictionless
piston.
For example, Gas syringe
Oxygen
Hydrogen peroxide
Manganese(IV) oxide
Kidegalize @Chemistry Archive Network +256(0)702816081
Manganese(IV) oxide is taken in the
flask in the set up of apparatus
shown in the diagram above.
The stopper is opened and hydrogen
peroxide is added onto the
manganese(IV) oxide.
The stopper is quickly fitted back.
Volume of oxygen evolved is measured
from the gas syringe.
Kidegalize @Chemistry Archive Network +256(0)702816081
(b) Measuring mass of the reaction
mixture at different time intervals.
This method applies to reactions in
which a gas is given off and it is allowed
to escape. For example,
CaCO3(s) + 2HCl(aq) CaCl2(aq) + CO2(g) + H2O(l)
Kidegalize @Chemistry Archive Network +256(0)702816081
Set up of apparatus
Reaction mixture
Bubbles of gas
Cotton wool
Direct weighing
balance
Kidegalize @Chemistry Archive Network +256(0)702816081
(c) Measuring the time taken for the
reaction to reach a specific stage.
(i) Time taken for effervescence to
stop e.g.
Mg(s) + 2HCl(aq) MgCl2(aq) + H2(g)
(ii) Time taken to precipitate
sulphur.
S2O3
2 – (aq) + 2H+(aq) S(s) + SO2(g) + H2O(l)
Kidegalize @Chemistry Archive Network +256(0)702816081
(iii) Time taken for the brown color to
appear in solution.
H2O2(aq) + 2I – (aq) + 2H+(aq) I2(aq) + 2H2O(l)
Kidegalize @Chemistry Archive Network +256(0)702816081
Check Point-1
Question 1
1999/P2/11(a)(i) What is the rate
of reaction? OR
2003/P2/11(a) What is meant by
rate of a chemical reaction? OR
2007/P2/13(a) Define the term rate
of reaction.
Kidegalize @Chemistry Archive Network +256(0)702816081
Question 2 (2002/P2/12 )
When a certain volume of 0.1M
hydrochloric acid was reacted at
room temperature with excess of iron
fillings, 120cm3 of a gas were
produced.
(a) Draw a labelled diagram to show
how the rate of reaction was
determined.
Kidegalize @Chemistry Archive Network +256(0)702816081
(b) Write equation for the reaction
that took place.
(c) Draw a sketch graph of the volume
of the gas against time.
Kidegalize @Chemistry Archive Network +256(0)702816081
Question 3 (1987/P2/7(a) )
A given mass of magnesium strips was
reacted with dilute hydrochloric acid at
room temperature. The volume of the gas
produced was measured at various
intervals.
(i) Write equation for the reaction.
(ii) Sketch a graph to show variations of
the volume of the gas produced with
time.
Kidegalize @Chemistry Archive Network +256(0)702816081
Rate curves
A rate curve is a graph obtained when
volume of gas/ concentration of the
reactant/ mass of the reaction
mixture / loss in mass/ temperature
of reaction is plotted against time/
reciprocal of time or vice versa.
To determine the rate of reaction at
any time, t, on the graph:
Kidegalize @Chemistry Archive Network +256(0)702816081
• Draw a tangent line at the time
given.
• Complete it to obtain a right-angled
triangle.
• Then calculate the gradient/slope of
the tangent and this is equal to the
rate of reaction at time, t.
Kidegalize @Chemistry Archive Network +256(0)702816081
Calculating rate of reaction at time,
t, from the graph
Time(s)
Volume
of
CO
2
(cm
3
)
t
Δt
ΔV
Rate =
ΔV
Δt
cm3s-1
Kidegalize @Chemistry Archive Network +256(0)702816081
• To find the volume of a gas/ mass of
reactant/ concentration of reactant
at a given time from the graph, draw
a perpendicular line from the time
axis at the given time, to meet the
curve. Read off the value where the
perpendicular line meets the rate
curve.
Kidegalize @Chemistry Archive Network +256(0)702816081
Note
• Show evidence of value obtained
from the graph, use dotted lines or
triangle in case of slope.
• To explain the shape of the graph:
State the relationship and give
reason(s) for the shape.
Kidegalize @Chemistry Archive Network +256(0)702816081
• Where necessary, tabulate the rate
of reaction,
1
t
, giving the values in
scientific notation, for example,
0.0068 is recorded as 6.8 × 10⁻³.
Kidegalize @Chemistry Archive Network +256(0)702816081
Checkpoint-2
Question 1
The table below shows the variation in
the concentration of hydrogen
peroxide with time when a sample of
hydrogen peroxide was mixed with
iron(III) chloride at room temperature.
Concentration of S2O3
2-
(M)
0.2 0.6 0.8 1.2 1.6
Time for sulphur to form (s) 60 20 15 10 7.5
1
t
(s-1)
Kidegalize @Chemistry Archive Network +256(0)702816081
(a)Copy and complete the table above by
computing and filling in the values of
1
t
(b)Plot a graph of
1
t
against
concentration of hydrogen peroxide.
(c)Using a graph, deduce how the rate of
the reaction varies with the
concentration of hydrogen peroxide.
(d)Determine the slope of the graph.
Kidegalize @Chemistry Archive Network +256(0)702816081
Question 2
The table below shows the variation in
volume of hydrogen evolved with time
when dilute hydrochloric acid was
added to excess zinc.
Volume of hydrogen
(cm3)
0 20 35 46 56 72 79 79
Time (s) 0 10 20 30 40 60 80 90
Kidegalize @Chemistry Archive Network +256(0)702816081
(a)Plot a graph of volume of hydrogen
evolved against time.
(b)Using the graph, determine the time
taken to collect 60 cm3 of hydrogen
gas.
(c)Draw tangents on your graph at points
when the time is 20 and 60 seconds
and determine the gradient of each
tangent.
(d)Compare the rate of reaction at 20
seconds and 60 seconds.
Kidegalize @Chemistry Archive Network +256(0)702816081
Question 3
Dilute hydrochloric acid reacts with
zinc according to the equation.
Zn(s) + 2HCl(aq) ZnCl2(aq) + H2(g)
25cm3 of dilute hydrochloric acid of
different concentration were
separately placed in six beakers. The
same mass of zinc powder was added
to each beaker and the time taken for
effervescence to stop
Kidegalize @Chemistry Archive Network +256(0)702816081
was recorded as shown in the table below.
(a)Plot a graph of concentration against
time.
(b) Use the graph to determine the
(i) concentration of hydrochloric acid
Concentration of HCl
(moldm-3)
0.25 0.50 0.75 1.00 1.25 1.50
Time taken(s) 32.0 22.0 14.5 9.5 6.0 3.0
Kidegalize @Chemistry Archive Network +256(0)702816081
for which the reaction stops after
10s.
(ii) rate of reaction with 0.50M and
1.25M hydrochloric acid.
(c) Compare the reaction rate in (b)(ii).
Explain your answer.
Kidegalize @Chemistry Archive Network +256(0)702816081
Factors affecting rate of
reaction
The factors that affect the rate of
chemical reactions are concentration,
temperature, pressure, catalyst,
surface area and light.
The effect of each factor on the rate
of reaction is explained by the collision
theory which states that chemical
reactions take place when reactant
particles collide.
Kidegalize @Chemistry Archive Network +256(0)702816081
Thus rate of reaction is directly
proportional to the number of
collisions per unit time (frequency of
collisions).
• Effect of temperature
The rate of reaction increases with
increase in temperature OR
The higher the temperature, the
faster the rate of a chemical reaction
Kidegalize @Chemistry Archive Network +256(0)702816081
At high temperature, more particles
acquire more kinetic energy.
Particles with high kinetic energy
move at increased velocities resulting
into more particles colliding with one
another more frequently and
vigorously. Hence the reaction
proceeds at a faster rate.
Kidegalize @Chemistry Archive Network +256(0)702816081
A graph showing volume of gas evolved
against time at different temperatures.
Time(s)
Volume
of
CO
2
(cm
3
)
High Lower
Kidegalize @Chemistry Archive Network +256(0)702816081
Note
The curves eventually end at the same
level.
This is because the same mass of
reactant is used and all have been
used up.
Kidegalize @Chemistry Archive Network +256(0)702816081
Expt. To show the effect of temperature
on the rate of reaction between sodium
thiosulphate and dilute acid
Standard solutions of thiosulphate and
hydrochloric acid are made.
Equal volumes of thiosulphate solutions
are taken in five different conical flasks.
Temperature of the solution in one of the
conical flasks is recorded and the
Kidegalize @Chemistry Archive Network +256(0)702816081
conical flask placed over a cross
marked on a piece of paper on a table.
A known volume of hydrochloric acid is
added and at the same time a stop is
started.
Time taken for the cross to just be
covered is noted.
The procedure is repeated with the
second conical flask heated to a
Kidegalize @Chemistry Archive Network +256(0)702816081
temperature slightly above room
temperature. This is done with the
3rd,4th and 5th conical flasks with
temperature in each case higher than
the preceding one.
Graph of temperature against
reciprocal of time is plotted which
gives a straight line. This shows that
rate of reaction increases with
increase in temperature.
Kidegalize @Chemistry Archive Network +256(0)702816081
• Effect of concentration of
reactants
The rate of reaction increases with
increase in concentration of
reactants OR
The higher the concentration of
reactants, the faster the rate of
reaction.
Kidegalize @Chemistry Archive Network +256(0)702816081
At higher concentration, more particles
are brought together and are close to
each other. Thus the chances of collisions
are higher and more frequent.
For example: when equal masses of
excess magnesium ribbon were
separately reacted with sulphuric acid of
different concentration, different volume
of hydrogen was evolved.
Kidegalize @Chemistry Archive Network +256(0)702816081
Graphs showing effect of
concentration on rates of reaction.
(i) Concentration against time
Time(second)
Concentration
(moldm
-3
)
Kidegalize @Chemistry Archive Network +256(0)702816081
Initially the concentration of
reactants is high leading to a faster
rate of reaction.
As the reactants get used up, their
concentration decreases and the
rate of reaction slows down since
there are fewer particles colliding
until it finally stops and becomes
constant.
Kidegalize @Chemistry Archive Network +256(0)702816081
(ii) Rate against concentration
Concentration(moldm-3)
Rate
of
reaction,
1
time
(s
-1
)
Kidegalize @Chemistry Archive Network +256(0)702816081
The graph is a straight line passing
through the origin.
It shows that the rate of reaction is
directly proportional to the
concentration of reactants.
Kidegalize @Chemistry Archive Network +256(0)702816081
• Effect of surface area/particle size
The smaller the particle size the
faster the rate of reaction.
Small sized particles e.g. powdered,
provide large surface area on which
reaction can occur. This provides
greater chances for more particles to
participate in the reaction.
Kidegalize @Chemistry Archive Network +256(0)702816081
Note
• Surface area affects the rate of
reaction involving solid reactant(s)
only.
• For example, reaction between zinc
and dilute hydrochloric acid shows
that the reaction is faster with
zinc powder than with zinc granules.
Kidegalize @Chemistry Archive Network +256(0)702816081
• A reaction between marble chips
(lumps of calcium carbonate) and
dilute hydrochloric acid is slow
compared to that with powdered
calcium carbonate.
Kidegalize @Chemistry Archive Network +256(0)702816081
• Thus the rate of reaction is
measured as the rate of change in
mass of the apparatus and its
content.
Kidegalize @Chemistry Archive Network +256(0)702816081
A graph of change in mass against
time
X
Y
Time(s)
Mass
of
content(g)
Curve I: Powdered calcium carbonate
Curve II: Marble chips
Z
Kidegalize @Chemistry Archive Network +256(0)702816081
In curve I, there is a rapid decrease in
the mass from X to Y due to large
surface area provided by the
powdered calcium carbonate hence
the reaction rate is very fast.
From Y to Z, the mass remains
constant because the reaction has
reached completion.
Kidegalize @Chemistry Archive Network +256(0)702816081
In curve II, the mass decreases slowly
and the rate of the reaction is slower
hence less carbon dioxide is produced
and it takes a longer time for the
reaction to reach completion.
This is because of the small surface
area of the marble chips which are in
large lumps.
Kidegalize @Chemistry Archive Network +256(0)702816081
A graph of volume of carbon dioxide
evolved against time
Time(s)
Volume
of
CO
2
(cm
3
)
Curve I Curve II
Curve I: Powdered calcium carbonate
Curve II: Marble chips
t1 t2
Kidegalize @Chemistry Archive Network +256(0)702816081
In curve I, there is a rapid increase in
the volume of carbon dioxide evolved
due to the large surface area provided
by the powdered calcium carbonate,
hence the reaction rate is very fast
until it reaches its completion and
becomes constant.
Kidegalize @Chemistry Archive Network +256(0)702816081
In curve II, there is a gradual increase
in the volume of carbon dioxide
produced and the rate of reaction
slower and it takes a lot of time for
the reaction to reach its completion.
This is because of the smaller surface
area of the marble chips which are in
large lumps.
Kidegalize @Chemistry Archive Network +256(0)702816081
Expt. To show how surface area can
affect the rate of the reaction between
calcium carbonate and hydrochloric acid
A given volume of hydrochloric acid of
known concentration is put in a conical
flask and the flask is loosely plugged with
a piece of cotton wool.
The flask with its contents is placed on a
direct weighing balance and the mass
recorded.
Kidegalize @Chemistry Archive Network +256(0)702816081
The cotton wool is slightly displaced and
a known mass of lumps of calcium
carbonate is added to the acid and
simultaneously a stop clock is started.
The mass of the flask and its content is
recorded after fixed intervals of time
until there is no further change.
The experiment is repeated using fresh
acid of the same volume and same mass
Kidegalize @Chemistry Archive Network +256(0)702816081
of calcium carbonate powder.
The change in mass is due to the carbon
dioxide lost during the reaction.
CaCO3(s) + 2HCl(aq) CaCl2(aq) + CO2(g) + H2O(l)
On the same axes, a graph of mass
against time for the reaction between
the acid and lumps of calcium
carbonate(curve II), the acid and calcium
carbonate powder(curve I)
Kidegalize @Chemistry Archive Network +256(0)702816081
is plotted.
The graph shows that the big size of
lumps of calcium carbonate offers a small
surface area for the reaction with
Time(s)
Mass
of
content(g)
Kidegalize @Chemistry Archive Network +256(0)702816081
the acid compared to the powdered
calcium carbonate with small sized
particles that offer a large surface
area and the latter reaction reaches
completion in a shorter time.
Therefore, the larger the surface area,
the faster is the rate of reaction.
Kidegalize @Chemistry Archive Network +256(0)702816081
• Effect of catalyst
The rate of reaction increases with
addition of a catalyst.
This is because in the presence of a
catalyst, the number of collisions per
unit time increases and the
activation energy is lowered, hence
increased rate of reaction.
Kidegalize @Chemistry Archive Network +256(0)702816081
Note
• A catalyst is a substance that alters
the rate of chemical reaction but it
remains chemically unchanged.
• Powdered catalyst are more effective
because the powder presents a large
surface area compared to lumps.
Kidegalize @Chemistry Archive Network +256(0)702816081
A graph showing catalysed and
uncatalysed reaction
Time(s)
Volume
of
O
2
(cm
3
)
t
Kidegalize @Chemistry Archive Network +256(0)702816081
At any time, t, the volume of oxygen
produced is higher in catalysed
reaction than in uncatalysed
reaction.
Kidegalize @Chemistry Archive Network +256(0)702816081
• Effect of pressure
A change in pressure affects
reactions which occur in gaseous
state.
When pressure of a gas mixture is
increased, the gases are compressed
and this brings the gas particles
closer together thus increasing the
frequency of collision between the
reacting particles,
Kidegalize @Chemistry Archive Network +256(0)702816081
therefore rate of reaction increases.
Examples of reactions affected by
pressure are:
N2(g) +H2(g) 2NH3(g)
2SO2(g) +O2(g) 2SO3(g)
Kidegalize @Chemistry Archive Network +256(0)702816081
• Effect of light
Some reactions are photosensitive.
For example silver chloride darkens
when exposed to light due to its
decomposition to silver metal and
chlorine gas.
2AgCl(s) 2Ag(s) + Cl2(g)
Kidegalize @Chemistry Archive Network +256(0)702816081
Checkpoint-3
Question 1 (2013/P2/14)
Sodium thiosulphate reacts with dilute
acids according to the following equation.
(a)State what would be observed if
dilute hydrochloric acid was added to
sodium thiosulphate solution.
(b)The rate of the reaction is affected by
the concentration of sodium
thiosulphate.
(i) State one factor other than
concentration that can affect the
rate of the reaction.
Kidegalize @Chemistry Archive Network +256(0)702816081
(ii) Briefly explain the effect of the
factor you have stated in b(i) on the
rate of the reaction.
(iii) Describe an experiment that can be
carried out in the laboratory to show
the effect of the factor you have
stated in b(i) on the rate of the
reaction. (Diagram not required)
Kidegalize @Chemistry Archive Network +256(0)702816081
Question 2 (2010/P2/14)
State and explain the effect of each
of the following conditions on the rate
of a chemical reaction.
(a) Particle size.
(b)Concentration of reactants.
(c)Temperature.
Kidegalize @Chemistry Archive Network +256(0)702816081
Question 3 (2005/P2/13)
(a) Describe an experiment to show how
surface area can affect the rate of the
reaction between calcium carbonate and
2M hydrochloric acid. Your answer must
include:
a labelled diagram of the apparatus.
sketch of expected graphs.
mention of how the graphs can be used to
make conclusions.
Kidegalize @Chemistry Archive Network +256(0)702816081
(b) Briefly explain why, when a 4M
hydrochloric acid was used instead of
2M acid, the rate of the reaction was
faster. Explain the observation.
(c) State one factor other than those
mentioned above that can affect the
rate of the reaction between
hydrochloric acid and calcium chloride.
Kidegalize @Chemistry Archive Network +256(0)702816081
UNEB Questions
2003/P2/11
2007/P2/13
2009/P2/13
2013/P2/14
2015/P2/9
2018/P2/11
2019/P2/9
Kidegalize @Chemistry Archive Network +256(0)702816081

Rates of reaction (1).pdf

  • 1.
    RATES OF REACTION RATESOF REACTION Charles Kidega St. Gonzaga Budini Sec. Sch.  c.kidega17@gmail.com  +256(0)702816081
  • 2.
    Kidegalize @Chemistry ArchiveNetwork +256(0)702816081 Introduction to rate of reaction Rate of reaction is the change in the mass/ concentration/ volume of a given reactant/ product during the course of reaction per unit time. Rate of reaction = change in amount change in time The rate of reaction with respect to reactant is NEGATIVE because its amount decreases with time.
  • 3.
    Kidegalize @Chemistry ArchiveNetwork +256(0)702816081 A graph of concentration of reactant against time Time(second) Concentration (moldm -3 )
  • 4.
    Kidegalize @Chemistry ArchiveNetwork +256(0)702816081 A graph of concentration of product against time Time(second) Concentration (moldm -3 )
  • 5.
    Kidegalize @Chemistry ArchiveNetwork +256(0)702816081 Rate of reaction is inversely proportional to the time of reaction. Rate 1 time Thus a fast reaction takes a short time and a slow reaction takes a long time to reach completion.
  • 6.
    Kidegalize @Chemistry ArchiveNetwork +256(0)702816081 Determination of rate of reaction The rate of reaction can be determined by: (a)Measuring the volume of gaseous product at different time intervals, for example: Mg(s) + 2HCl(aq) MgCl2(aq) + H2(g) 2H2O2(aq) 2H2O(l) + O2(g) MnO2
  • 7.
    Kidegalize @Chemistry ArchiveNetwork +256(0)702816081 The volume of gas can be measured using a gas syringe with a frictionless piston. For example, Gas syringe Oxygen Hydrogen peroxide Manganese(IV) oxide
  • 8.
    Kidegalize @Chemistry ArchiveNetwork +256(0)702816081 Manganese(IV) oxide is taken in the flask in the set up of apparatus shown in the diagram above. The stopper is opened and hydrogen peroxide is added onto the manganese(IV) oxide. The stopper is quickly fitted back. Volume of oxygen evolved is measured from the gas syringe.
  • 9.
    Kidegalize @Chemistry ArchiveNetwork +256(0)702816081 (b) Measuring mass of the reaction mixture at different time intervals. This method applies to reactions in which a gas is given off and it is allowed to escape. For example, CaCO3(s) + 2HCl(aq) CaCl2(aq) + CO2(g) + H2O(l)
  • 10.
    Kidegalize @Chemistry ArchiveNetwork +256(0)702816081 Set up of apparatus Reaction mixture Bubbles of gas Cotton wool Direct weighing balance
  • 11.
    Kidegalize @Chemistry ArchiveNetwork +256(0)702816081 (c) Measuring the time taken for the reaction to reach a specific stage. (i) Time taken for effervescence to stop e.g. Mg(s) + 2HCl(aq) MgCl2(aq) + H2(g) (ii) Time taken to precipitate sulphur. S2O3 2 – (aq) + 2H+(aq) S(s) + SO2(g) + H2O(l)
  • 12.
    Kidegalize @Chemistry ArchiveNetwork +256(0)702816081 (iii) Time taken for the brown color to appear in solution. H2O2(aq) + 2I – (aq) + 2H+(aq) I2(aq) + 2H2O(l)
  • 13.
    Kidegalize @Chemistry ArchiveNetwork +256(0)702816081 Check Point-1 Question 1 1999/P2/11(a)(i) What is the rate of reaction? OR 2003/P2/11(a) What is meant by rate of a chemical reaction? OR 2007/P2/13(a) Define the term rate of reaction.
  • 14.
    Kidegalize @Chemistry ArchiveNetwork +256(0)702816081 Question 2 (2002/P2/12 ) When a certain volume of 0.1M hydrochloric acid was reacted at room temperature with excess of iron fillings, 120cm3 of a gas were produced. (a) Draw a labelled diagram to show how the rate of reaction was determined.
  • 15.
    Kidegalize @Chemistry ArchiveNetwork +256(0)702816081 (b) Write equation for the reaction that took place. (c) Draw a sketch graph of the volume of the gas against time.
  • 16.
    Kidegalize @Chemistry ArchiveNetwork +256(0)702816081 Question 3 (1987/P2/7(a) ) A given mass of magnesium strips was reacted with dilute hydrochloric acid at room temperature. The volume of the gas produced was measured at various intervals. (i) Write equation for the reaction. (ii) Sketch a graph to show variations of the volume of the gas produced with time.
  • 17.
    Kidegalize @Chemistry ArchiveNetwork +256(0)702816081 Rate curves A rate curve is a graph obtained when volume of gas/ concentration of the reactant/ mass of the reaction mixture / loss in mass/ temperature of reaction is plotted against time/ reciprocal of time or vice versa. To determine the rate of reaction at any time, t, on the graph:
  • 18.
    Kidegalize @Chemistry ArchiveNetwork +256(0)702816081 • Draw a tangent line at the time given. • Complete it to obtain a right-angled triangle. • Then calculate the gradient/slope of the tangent and this is equal to the rate of reaction at time, t.
  • 19.
    Kidegalize @Chemistry ArchiveNetwork +256(0)702816081 Calculating rate of reaction at time, t, from the graph Time(s) Volume of CO 2 (cm 3 ) t Δt ΔV Rate = ΔV Δt cm3s-1
  • 20.
    Kidegalize @Chemistry ArchiveNetwork +256(0)702816081 • To find the volume of a gas/ mass of reactant/ concentration of reactant at a given time from the graph, draw a perpendicular line from the time axis at the given time, to meet the curve. Read off the value where the perpendicular line meets the rate curve.
  • 21.
    Kidegalize @Chemistry ArchiveNetwork +256(0)702816081 Note • Show evidence of value obtained from the graph, use dotted lines or triangle in case of slope. • To explain the shape of the graph: State the relationship and give reason(s) for the shape.
  • 22.
    Kidegalize @Chemistry ArchiveNetwork +256(0)702816081 • Where necessary, tabulate the rate of reaction, 1 t , giving the values in scientific notation, for example, 0.0068 is recorded as 6.8 × 10⁻³.
  • 23.
    Kidegalize @Chemistry ArchiveNetwork +256(0)702816081 Checkpoint-2 Question 1 The table below shows the variation in the concentration of hydrogen peroxide with time when a sample of hydrogen peroxide was mixed with iron(III) chloride at room temperature. Concentration of S2O3 2- (M) 0.2 0.6 0.8 1.2 1.6 Time for sulphur to form (s) 60 20 15 10 7.5 1 t (s-1)
  • 24.
    Kidegalize @Chemistry ArchiveNetwork +256(0)702816081 (a)Copy and complete the table above by computing and filling in the values of 1 t (b)Plot a graph of 1 t against concentration of hydrogen peroxide. (c)Using a graph, deduce how the rate of the reaction varies with the concentration of hydrogen peroxide. (d)Determine the slope of the graph.
  • 25.
    Kidegalize @Chemistry ArchiveNetwork +256(0)702816081 Question 2 The table below shows the variation in volume of hydrogen evolved with time when dilute hydrochloric acid was added to excess zinc. Volume of hydrogen (cm3) 0 20 35 46 56 72 79 79 Time (s) 0 10 20 30 40 60 80 90
  • 26.
    Kidegalize @Chemistry ArchiveNetwork +256(0)702816081 (a)Plot a graph of volume of hydrogen evolved against time. (b)Using the graph, determine the time taken to collect 60 cm3 of hydrogen gas. (c)Draw tangents on your graph at points when the time is 20 and 60 seconds and determine the gradient of each tangent. (d)Compare the rate of reaction at 20 seconds and 60 seconds.
  • 27.
    Kidegalize @Chemistry ArchiveNetwork +256(0)702816081 Question 3 Dilute hydrochloric acid reacts with zinc according to the equation. Zn(s) + 2HCl(aq) ZnCl2(aq) + H2(g) 25cm3 of dilute hydrochloric acid of different concentration were separately placed in six beakers. The same mass of zinc powder was added to each beaker and the time taken for effervescence to stop
  • 28.
    Kidegalize @Chemistry ArchiveNetwork +256(0)702816081 was recorded as shown in the table below. (a)Plot a graph of concentration against time. (b) Use the graph to determine the (i) concentration of hydrochloric acid Concentration of HCl (moldm-3) 0.25 0.50 0.75 1.00 1.25 1.50 Time taken(s) 32.0 22.0 14.5 9.5 6.0 3.0
  • 29.
    Kidegalize @Chemistry ArchiveNetwork +256(0)702816081 for which the reaction stops after 10s. (ii) rate of reaction with 0.50M and 1.25M hydrochloric acid. (c) Compare the reaction rate in (b)(ii). Explain your answer.
  • 30.
    Kidegalize @Chemistry ArchiveNetwork +256(0)702816081 Factors affecting rate of reaction The factors that affect the rate of chemical reactions are concentration, temperature, pressure, catalyst, surface area and light. The effect of each factor on the rate of reaction is explained by the collision theory which states that chemical reactions take place when reactant particles collide.
  • 31.
    Kidegalize @Chemistry ArchiveNetwork +256(0)702816081 Thus rate of reaction is directly proportional to the number of collisions per unit time (frequency of collisions). • Effect of temperature The rate of reaction increases with increase in temperature OR The higher the temperature, the faster the rate of a chemical reaction
  • 32.
    Kidegalize @Chemistry ArchiveNetwork +256(0)702816081 At high temperature, more particles acquire more kinetic energy. Particles with high kinetic energy move at increased velocities resulting into more particles colliding with one another more frequently and vigorously. Hence the reaction proceeds at a faster rate.
  • 33.
    Kidegalize @Chemistry ArchiveNetwork +256(0)702816081 A graph showing volume of gas evolved against time at different temperatures. Time(s) Volume of CO 2 (cm 3 ) High Lower
  • 34.
    Kidegalize @Chemistry ArchiveNetwork +256(0)702816081 Note The curves eventually end at the same level. This is because the same mass of reactant is used and all have been used up.
  • 35.
    Kidegalize @Chemistry ArchiveNetwork +256(0)702816081 Expt. To show the effect of temperature on the rate of reaction between sodium thiosulphate and dilute acid Standard solutions of thiosulphate and hydrochloric acid are made. Equal volumes of thiosulphate solutions are taken in five different conical flasks. Temperature of the solution in one of the conical flasks is recorded and the
  • 36.
    Kidegalize @Chemistry ArchiveNetwork +256(0)702816081 conical flask placed over a cross marked on a piece of paper on a table. A known volume of hydrochloric acid is added and at the same time a stop is started. Time taken for the cross to just be covered is noted. The procedure is repeated with the second conical flask heated to a
  • 37.
    Kidegalize @Chemistry ArchiveNetwork +256(0)702816081 temperature slightly above room temperature. This is done with the 3rd,4th and 5th conical flasks with temperature in each case higher than the preceding one. Graph of temperature against reciprocal of time is plotted which gives a straight line. This shows that rate of reaction increases with increase in temperature.
  • 38.
    Kidegalize @Chemistry ArchiveNetwork +256(0)702816081 • Effect of concentration of reactants The rate of reaction increases with increase in concentration of reactants OR The higher the concentration of reactants, the faster the rate of reaction.
  • 39.
    Kidegalize @Chemistry ArchiveNetwork +256(0)702816081 At higher concentration, more particles are brought together and are close to each other. Thus the chances of collisions are higher and more frequent. For example: when equal masses of excess magnesium ribbon were separately reacted with sulphuric acid of different concentration, different volume of hydrogen was evolved.
  • 40.
    Kidegalize @Chemistry ArchiveNetwork +256(0)702816081 Graphs showing effect of concentration on rates of reaction. (i) Concentration against time Time(second) Concentration (moldm -3 )
  • 41.
    Kidegalize @Chemistry ArchiveNetwork +256(0)702816081 Initially the concentration of reactants is high leading to a faster rate of reaction. As the reactants get used up, their concentration decreases and the rate of reaction slows down since there are fewer particles colliding until it finally stops and becomes constant.
  • 42.
    Kidegalize @Chemistry ArchiveNetwork +256(0)702816081 (ii) Rate against concentration Concentration(moldm-3) Rate of reaction, 1 time (s -1 )
  • 43.
    Kidegalize @Chemistry ArchiveNetwork +256(0)702816081 The graph is a straight line passing through the origin. It shows that the rate of reaction is directly proportional to the concentration of reactants.
  • 44.
    Kidegalize @Chemistry ArchiveNetwork +256(0)702816081 • Effect of surface area/particle size The smaller the particle size the faster the rate of reaction. Small sized particles e.g. powdered, provide large surface area on which reaction can occur. This provides greater chances for more particles to participate in the reaction.
  • 45.
    Kidegalize @Chemistry ArchiveNetwork +256(0)702816081 Note • Surface area affects the rate of reaction involving solid reactant(s) only. • For example, reaction between zinc and dilute hydrochloric acid shows that the reaction is faster with zinc powder than with zinc granules.
  • 46.
    Kidegalize @Chemistry ArchiveNetwork +256(0)702816081 • A reaction between marble chips (lumps of calcium carbonate) and dilute hydrochloric acid is slow compared to that with powdered calcium carbonate.
  • 47.
    Kidegalize @Chemistry ArchiveNetwork +256(0)702816081 • Thus the rate of reaction is measured as the rate of change in mass of the apparatus and its content.
  • 48.
    Kidegalize @Chemistry ArchiveNetwork +256(0)702816081 A graph of change in mass against time X Y Time(s) Mass of content(g) Curve I: Powdered calcium carbonate Curve II: Marble chips Z
  • 49.
    Kidegalize @Chemistry ArchiveNetwork +256(0)702816081 In curve I, there is a rapid decrease in the mass from X to Y due to large surface area provided by the powdered calcium carbonate hence the reaction rate is very fast. From Y to Z, the mass remains constant because the reaction has reached completion.
  • 50.
    Kidegalize @Chemistry ArchiveNetwork +256(0)702816081 In curve II, the mass decreases slowly and the rate of the reaction is slower hence less carbon dioxide is produced and it takes a longer time for the reaction to reach completion. This is because of the small surface area of the marble chips which are in large lumps.
  • 51.
    Kidegalize @Chemistry ArchiveNetwork +256(0)702816081 A graph of volume of carbon dioxide evolved against time Time(s) Volume of CO 2 (cm 3 ) Curve I Curve II Curve I: Powdered calcium carbonate Curve II: Marble chips t1 t2
  • 52.
    Kidegalize @Chemistry ArchiveNetwork +256(0)702816081 In curve I, there is a rapid increase in the volume of carbon dioxide evolved due to the large surface area provided by the powdered calcium carbonate, hence the reaction rate is very fast until it reaches its completion and becomes constant.
  • 53.
    Kidegalize @Chemistry ArchiveNetwork +256(0)702816081 In curve II, there is a gradual increase in the volume of carbon dioxide produced and the rate of reaction slower and it takes a lot of time for the reaction to reach its completion. This is because of the smaller surface area of the marble chips which are in large lumps.
  • 54.
    Kidegalize @Chemistry ArchiveNetwork +256(0)702816081 Expt. To show how surface area can affect the rate of the reaction between calcium carbonate and hydrochloric acid A given volume of hydrochloric acid of known concentration is put in a conical flask and the flask is loosely plugged with a piece of cotton wool. The flask with its contents is placed on a direct weighing balance and the mass recorded.
  • 55.
    Kidegalize @Chemistry ArchiveNetwork +256(0)702816081 The cotton wool is slightly displaced and a known mass of lumps of calcium carbonate is added to the acid and simultaneously a stop clock is started. The mass of the flask and its content is recorded after fixed intervals of time until there is no further change. The experiment is repeated using fresh acid of the same volume and same mass
  • 56.
    Kidegalize @Chemistry ArchiveNetwork +256(0)702816081 of calcium carbonate powder. The change in mass is due to the carbon dioxide lost during the reaction. CaCO3(s) + 2HCl(aq) CaCl2(aq) + CO2(g) + H2O(l) On the same axes, a graph of mass against time for the reaction between the acid and lumps of calcium carbonate(curve II), the acid and calcium carbonate powder(curve I)
  • 57.
    Kidegalize @Chemistry ArchiveNetwork +256(0)702816081 is plotted. The graph shows that the big size of lumps of calcium carbonate offers a small surface area for the reaction with Time(s) Mass of content(g)
  • 58.
    Kidegalize @Chemistry ArchiveNetwork +256(0)702816081 the acid compared to the powdered calcium carbonate with small sized particles that offer a large surface area and the latter reaction reaches completion in a shorter time. Therefore, the larger the surface area, the faster is the rate of reaction.
  • 59.
    Kidegalize @Chemistry ArchiveNetwork +256(0)702816081 • Effect of catalyst The rate of reaction increases with addition of a catalyst. This is because in the presence of a catalyst, the number of collisions per unit time increases and the activation energy is lowered, hence increased rate of reaction.
  • 60.
    Kidegalize @Chemistry ArchiveNetwork +256(0)702816081 Note • A catalyst is a substance that alters the rate of chemical reaction but it remains chemically unchanged. • Powdered catalyst are more effective because the powder presents a large surface area compared to lumps.
  • 61.
    Kidegalize @Chemistry ArchiveNetwork +256(0)702816081 A graph showing catalysed and uncatalysed reaction Time(s) Volume of O 2 (cm 3 ) t
  • 62.
    Kidegalize @Chemistry ArchiveNetwork +256(0)702816081 At any time, t, the volume of oxygen produced is higher in catalysed reaction than in uncatalysed reaction.
  • 63.
    Kidegalize @Chemistry ArchiveNetwork +256(0)702816081 • Effect of pressure A change in pressure affects reactions which occur in gaseous state. When pressure of a gas mixture is increased, the gases are compressed and this brings the gas particles closer together thus increasing the frequency of collision between the reacting particles,
  • 64.
    Kidegalize @Chemistry ArchiveNetwork +256(0)702816081 therefore rate of reaction increases. Examples of reactions affected by pressure are: N2(g) +H2(g) 2NH3(g) 2SO2(g) +O2(g) 2SO3(g)
  • 65.
    Kidegalize @Chemistry ArchiveNetwork +256(0)702816081 • Effect of light Some reactions are photosensitive. For example silver chloride darkens when exposed to light due to its decomposition to silver metal and chlorine gas. 2AgCl(s) 2Ag(s) + Cl2(g)
  • 66.
    Kidegalize @Chemistry ArchiveNetwork +256(0)702816081 Checkpoint-3 Question 1 (2013/P2/14) Sodium thiosulphate reacts with dilute acids according to the following equation. (a)State what would be observed if dilute hydrochloric acid was added to sodium thiosulphate solution. (b)The rate of the reaction is affected by the concentration of sodium thiosulphate. (i) State one factor other than concentration that can affect the rate of the reaction.
  • 67.
    Kidegalize @Chemistry ArchiveNetwork +256(0)702816081 (ii) Briefly explain the effect of the factor you have stated in b(i) on the rate of the reaction. (iii) Describe an experiment that can be carried out in the laboratory to show the effect of the factor you have stated in b(i) on the rate of the reaction. (Diagram not required)
  • 68.
    Kidegalize @Chemistry ArchiveNetwork +256(0)702816081 Question 2 (2010/P2/14) State and explain the effect of each of the following conditions on the rate of a chemical reaction. (a) Particle size. (b)Concentration of reactants. (c)Temperature.
  • 69.
    Kidegalize @Chemistry ArchiveNetwork +256(0)702816081 Question 3 (2005/P2/13) (a) Describe an experiment to show how surface area can affect the rate of the reaction between calcium carbonate and 2M hydrochloric acid. Your answer must include: a labelled diagram of the apparatus. sketch of expected graphs. mention of how the graphs can be used to make conclusions.
  • 70.
    Kidegalize @Chemistry ArchiveNetwork +256(0)702816081 (b) Briefly explain why, when a 4M hydrochloric acid was used instead of 2M acid, the rate of the reaction was faster. Explain the observation. (c) State one factor other than those mentioned above that can affect the rate of the reaction between hydrochloric acid and calcium chloride.
  • 71.
    Kidegalize @Chemistry ArchiveNetwork +256(0)702816081 UNEB Questions 2003/P2/11 2007/P2/13 2009/P2/13 2013/P2/14 2015/P2/9 2018/P2/11 2019/P2/9
  • 72.
    Kidegalize @Chemistry ArchiveNetwork +256(0)702816081