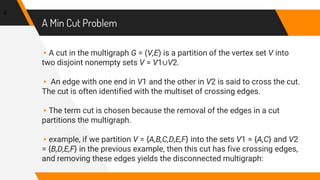
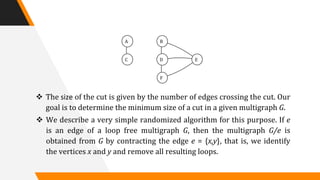
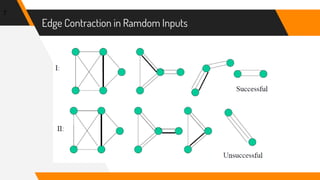
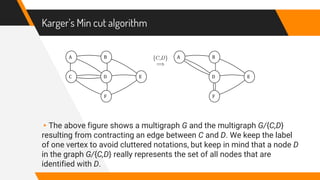
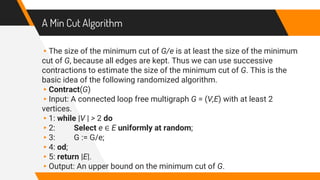
This document defines and provides examples of graphs and their representations. It discusses:
- Graphs are data structures consisting of nodes and edges connecting nodes.
- Examples of directed and undirected graphs are given.
- Graphs can be represented using adjacency matrices or adjacency lists. Adjacency matrices store connections in a grid and adjacency lists store connections as linked lists.
- Key graph terms are defined such as vertices, edges, paths, and degrees. Properties like connectivity and completeness are also discussed.
The document discusses VC dimension in machine learning. It introduces the concept of VC dimension as a measure of the capacity or complexity of a set of functions used in a statistical binary classification algorithm. VC dimension is defined as the largest number of points that can be shattered, or classified correctly, by the algorithm. The document notes that test error is related to both training error and model complexity, which can be measured by VC dimension. A low VC dimension or large training set size can help reduce the gap between training and test error.
BackTracking Algorithm: Technique and ExamplesFahim Ferdous
This slides gives a strong overview of backtracking algorithm. How it came and general approaches of the techniques. Also some well-known problem and solution of backtracking algorithm.
The document provides an overview of constraint satisfaction problems (CSPs). It defines a CSP as consisting of variables with domains of possible values, and constraints specifying allowed value combinations. CSPs can represent many problems using variables and constraints rather than explicit state representations. Backtracking search is commonly used to solve CSPs by trying value assignments and backtracking when constraints are violated.
This document discusses hierarchical clustering, which produces nested clusters organized as a hierarchical tree. It can be visualized using a dendrogram. There are two main types: agglomerative, which starts with each point as its own cluster and merges the closest pairs; and divisive, which starts with all points in one cluster and splits them. Hierarchical clustering does not require specifying the number of clusters upfront like partitional clustering but is generally slower and the dendrogram can be difficult to interpret. The document provides examples of applications and notes pros and cons.
K-means clustering is an unsupervised machine learning algorithm that groups unlabeled data points into a specified number of clusters (k) based on their similarity. It works by randomly assigning data points to k clusters and then iteratively updating cluster centroids and reassigning points until cluster membership stabilizes. K-means clustering aims to minimize intra-cluster variation while maximizing inter-cluster variation. There are various applications and variants of the basic k-means algorithm.
Hierarchical clustering methods group data points into a hierarchy of clusters based on their distance or similarity. There are two main approaches: agglomerative, which starts with each point as a separate cluster and merges them; and divisive, which starts with all points in one cluster and splits them. AGNES and DIANA are common agglomerative and divisive algorithms. Hierarchical clustering represents the hierarchy as a dendrogram tree structure and allows exploring data at different granularities of clusters.
Naive Bayes is a kind of classifier which uses the Bayes Theorem. It predicts membership probabilities for each class such as the probability that given record or data point belongs to a particular class.
Here is a randomized algorithm to estimate the number of vertices within distance d of each vertex in a directed graph with n vertices and m edges in fully polynomial time:
1. Repeat the following r times for a sufficiently large value of r:
2. Color each vertex randomly with probability 1/2d.
3. For each vertex v, count the number of colored vertices within distance d of v. Let this count be cv.
4. Return, for each vertex v, the estimate cvr/n as the number of vertices within distance d of v.
This algorithm runs in O(rm) time, which is fully polynomial for any fixed d, as r can be taken to be a polynomial in
This document describes a graduate course on computational complexity taught by Antonis Antonopoulos. It includes the course syllabus, which covers topics like Turing machines, complexity classes, randomized computation, interactive proofs, and derandomization of complexity classes. It also provides recommended textbooks and lecture notes. The document lists some of the major complexity classes like P, NP, BPP, and includes definitions of time-constructible and space-constructible functions, which are used to formally define complexity classes. It also discusses the relationships between different complexity classes and proves theorems like the time hierarchy theorem.
This document discusses various problems that can be solved using backtracking, including graph coloring, the Hamiltonian cycle problem, the subset sum problem, the n-queen problem, and map coloring. It provides examples of how backtracking works by constructing partial solutions and evaluating them to find valid solutions or determine dead ends. Key terms like state-space trees and promising vs non-promising states are introduced. Specific examples are given for problems like placing 4 queens on a chessboard and coloring a map of Australia.
Graph theory is the study of points and lines, and how sets of points called vertices can be connected by lines called edges. It involves types of graphs like regular graphs where each vertex has the same number of neighbors, and bipartite graphs where the vertices can be partitioned into two sets with no edges within each set. Graphs can be represented using adjacency matrices and adjacency lists. Basic graph algorithms include depth-first search, breadth-first search, and finding shortest paths between vertices. Graph coloring assigns colors to vertices so that no adjacent vertices have the same color.
Informed and Uninformed search StrategiesAmey Kerkar
1. The document discusses various search strategies used to solve problems including uninformed search strategies like breadth-first search and depth-first search, and informed search strategies like best-first search and A* search that use heuristics.
2. It provides examples and explanations of breadth-first search, depth-first search, hill climbing, and best-first search algorithms. Key advantages and disadvantages of each strategy are outlined.
3. The document focuses on explaining control strategies for problem solving, different types of search strategies classified as uninformed or informed, and algorithms for breadth-first search, depth-first search, hill climbing, and best-first search.
1. Asymptotic notation such as Big-O, Omega, and Theta are used to describe the running time of algorithms as the input size n approaches infinity, rather than giving the exact running time.
2. Big-O notation gives an upper bound and describes worst-case running time, Omega notation gives a lower bound and describes best-case running time, and Theta notation gives a tight bound where the worst and best cases are equal up to a constant.
3. Common examples of asymptotic running times include O(1) for constant time, O(log n) for logarithmic time, O(n) for linear time, and O(n^2) for quadratic time.
The document discusses greedy algorithms and their application to optimization problems. It provides examples of problems that can be solved using greedy approaches, such as fractional knapsack and making change. However, it notes that some problems like 0-1 knapsack and shortest paths on multi-stage graphs cannot be solved optimally with greedy algorithms. The document also describes various greedy algorithms for minimum spanning trees, single-source shortest paths, and fractional knapsack problems.
Outlier analysis is used to identify outliers, which are data objects that are inconsistent with the general behavior or model of the data. There are two main types of outlier detection - statistical distribution-based detection, which identifies outliers based on how far they are from the average statistical distribution, and distance-based detection, which finds outliers based on how far they are from other data objects. Outlier analysis is useful for tasks like fraud detection, where outliers may indicate fraudulent activity that is different from normal patterns in the data.
Linear regression is a supervised machine learning technique used to model the relationship between a continuous dependent variable and one or more independent variables. It is commonly used for prediction and forecasting. The regression line represents the best fit line for the data using the least squares method to minimize the distance between the observed data points and the regression line. R-squared measures how well the regression line represents the data, on a scale of 0-100%. Linear regression performs well when data is linearly separable but has limitations such as assuming linear relationships and being sensitive to outliers and multicollinearity.
A brief description of clustering, two relevant clustering algorithms(K-means and Fuzzy C-means), clustering validation, two inner validity indices(Dunn-n-Dunn and Devies Bouldin) .
this is a briefer overview about the Big O Notation. Big O Notaion are useful to check the Effeciency of an algorithm and to check its limitation at higher value. with big o notation some examples are also shown about its cases and some functions in c++ are also described.
Depth-first search (DFS) is an algorithm that explores all the vertices reachable from a starting vertex by traversing edges in a depth-first manner. DFS uses a stack data structure to keep track of vertices to visit. It colors vertices white, gray, and black to indicate their status. DFS runs in O(V+E) time and can be used for applications like topological sorting and finding strongly connected components. The edges discovered during DFS can be classified as tree, back, forward, or cross edges based on the order in which vertices are discovered.
This document discusses greedy algorithms and dynamic programming techniques for solving optimization problems. It covers the activity selection problem, which can be solved greedily by always selecting the shortest remaining activity. It also discusses the knapsack problem and how the fractional version can be solved greedily while the 0-1 version requires dynamic programming due to its optimal substructure but non-greedy nature. Dynamic programming builds up solutions by combining optimal solutions to overlapping subproblems.
This document discusses computational complexity and analyzing the running time of algorithms. It defines big-O notation, which is used to classify algorithms according to their worst-case performance as the problem size increases. Examples are provided of algorithms with running times that are O(1), O(log N), O(N), O(N log N), O(N^2), O(N^3), and O(2^N). The growth rates of these functions from slowest to fastest are also listed.
This document discusses various classification algorithms including k-nearest neighbors, decision trees, naive Bayes classifier, and logistic regression. It provides examples of how each algorithm works. For k-nearest neighbors, it shows how an unknown data point would be classified based on its nearest neighbors. For decision trees, it illustrates how a tree is built by splitting the data into subsets at each node until pure subsets are reached. It also provides an example decision tree to predict whether Amit will play cricket. For naive Bayes, it gives an example of calculating the probability of cancer given a patient is a smoker.
The document discusses the maximum subarray problem and different solutions to solve it. It defines the problem as finding a contiguous subsequence within a given array that has the largest sum. It presents a brute force solution with O(n2) time complexity and a more efficient divide and conquer solution with O(nlogn) time complexity. The divide and conquer approach recursively finds maximum subarrays in the left and right halves of the array and the maximum crossing subarray to return the overall maximum.
This document provides an overview of decision trees, including:
- Decision trees classify records by sorting them down the tree from root to leaf node, where each leaf represents a classification outcome.
- Trees are constructed top-down by selecting the most informative attribute to split on at each node, usually based on information gain.
- Trees can handle both numerical and categorical data and produce classification rules from paths in the tree.
- Examples of decision tree algorithms like ID3 that use information gain to select the best splitting attribute are described. The concepts of entropy and information gain are defined for selecting splits.
The document discusses the divide and conquer algorithm design technique. It begins by explaining the basic approach of divide and conquer which is to (1) divide the problem into subproblems, (2) conquer the subproblems by solving them recursively, and (3) combine the solutions to the subproblems into a solution for the original problem. It then provides merge sort as a specific example of a divide and conquer algorithm for sorting a sequence. It explains that merge sort divides the sequence in half recursively until individual elements remain, then combines the sorted halves back together to produce the fully sorted sequence.
This document is a project report submitted by S. Manikanta in partial fulfillment of the requirements for a Master of Science degree in Mathematics. The report discusses applications of graph theory. It provides an overview of graph theory concepts such as definitions of graphs, terminology used in graph theory, different types of graphs, trees and forests, graph isomorphism and operations, walks and paths in graphs, representations of graphs using matrices, applications of graphs in areas like computer science, fingerprint recognition, security, and more. The document also includes examples and illustrations to explain various graph theory concepts.
The document discusses various topics related to algorithms including introduction to algorithms, algorithm design, complexity analysis, asymptotic notations, and data structures. It provides definitions and examples of algorithms, their properties and categories. It also covers algorithm design methods and approaches. Complexity analysis covers time and space complexity. Asymptotic notations like Big-O, Omega, and Theta notations are introduced to analyze algorithms. Examples are provided to find the upper and lower bounds of algorithms.
The document discusses approximation algorithms and genetic algorithms for solving optimization problems like the traveling salesman problem (TSP) and vertex cover problem. It provides examples of approximation algorithms for these NP-hard problems, including algorithms that find near-optimal solutions within polynomial time. Genetic algorithms are also presented as an approach to solve TSP and other problems by encoding potential solutions and applying genetic operators like crossover and mutation.
This document discusses different types of randomized algorithms. It begins by defining randomized algorithms as algorithms that can access random bits during execution. It then discusses reasons for using randomized algorithms, including simplicity and speed advantages over deterministic algorithms. It describes Las Vegas algorithms as randomized algorithms that always produce the correct output or indicate failure. As an example, it summarizes the randomized quicksort algorithm and how it makes random choices during partitioning. It also briefly discusses Monte Carlo algorithms that can produce incorrect outputs with bounded error probabilities for decision problems. Finally, it provides an overview of the min-cut algorithm for finding the minimum cut in a graph by randomly contracting edges.
Contents of the presentation:
- ABOUT ME
- Bisection Method using C#
- False Position Method using C#
- Gauss Seidel Method using MATLAB
- Secant Mod Method using MATLAB
- Report on Numerical Errors
- Optimization using Golden-Section Algorithm with Application on MATLAB
The document discusses algorithms and their analysis. It begins by defining an algorithm and listing requirements like being unambiguous and finite. It describes writing algorithms using pseudocode or flowcharts and proving their correctness. The document then discusses analyzing algorithms by measuring their time and space efficiency using orders of growth. It explains analyzing best, worst, and average cases and counting basic operations. Finally, it provides examples of analyzing simple algorithms involving if statements and loops.
The document summarizes key concepts in design analysis and algorithms including:
1. Number theory problems like the Chinese Remainder Theorem and GCD algorithms. Approximate algorithms for set cover and vertex cover problems are also discussed.
2. The Chinese Remainder Theorem allows determining solutions based on remainders when numbers are divided. Pseudocode and a program demonstrate its use.
3. Modular arithmetic operations like addition, multiplication, and exponentiation along with their properties and programs are outlined.
The document discusses algorithms and the greedy method. It provides examples of problems that can be solved using greedy algorithms, including job sequencing with deadlines and finding minimum spanning trees. It then provides details of algorithms to solve these problems greedily. The job sequencing algorithm sequences jobs by deadline to maximize total profit. Prim's algorithm is described for finding minimum spanning trees by gradually building up the tree from the minimum cost edge at each step.
Cs6402 design and analysis of algorithms may june 2016 answer keyappasami
The document discusses algorithms and complexity analysis. It provides Euclid's algorithm for computing greatest common divisor, compares the orders of growth of n(n-1)/2 and n^2, and describes the general strategy of divide and conquer methods. It also defines problems like the closest pair problem, single source shortest path problem, and assignment problem. Finally, it discusses topics like state space trees, the extreme point theorem, and lower bounds.
The document introduces algorithms and their role in computing. It defines computational problems as relationships between inputs and outputs. Algorithms are tools used to solve well-specified computational problems and must be correct and efficient. Examples of algorithms are given for common problems like determining if a number is prime or sorting a list alphabetically. Key aspects of algorithms like variables, instructions, selection, repetition and documentation are outlined. Examples are provided of analyzing algorithm efficiency based on runtime. Pseudo-code conventions for writing algorithms are also presented.
CP4151 ADSA unit1 Advanced Data Structures and AlgorithmsSheba41
The document introduces algorithms and their role in computing. It defines computational problems as relationships between inputs and outputs. Algorithms are tools used to solve well-specified computational problems and must be correct and efficient. Examples of algorithms are provided, along with their components like variables, instructions, selections, and repetitions. The document also discusses algorithm efficiency and provides examples comparing the efficiencies of different sorting algorithms. Pseudo-code conventions for writing algorithms are also outlined.
The document discusses weighted secure domination in graphs. It begins by defining domination number and weighted domination number. It proposes a greedy algorithm that provides a 1 + log(n) approximation for weighted domination number. The algorithm works by iteratively selecting the unselected vertex with the minimum ratio of weight to number of uncovered neighbors. This achieves an approximation ratio of H(n), which is at most 1 + log(n). The algorithm runs in polynomial time.
ICML2013読み会 Large-Scale Learning with Less RAM via RandomizationHidekazu Oiwa
Large-Scale Learning with Less RAM via Randomization proposes algorithms that reduce memory usage for machine learning models during training and prediction while maintaining prediction accuracy. It introduces a method called randomized rounding that represents model weights with fewer bits by randomly rounding values to the nearest representation. An algorithm is proposed that uses randomized rounding and adaptive learning rates on a per-coordinate basis, providing theoretical guarantees on regret bounds. Memory usage is reduced by 50% during training and 95% during prediction compared to standard floating point representation.
The document discusses dynamic programming techniques for finding the optimal number of scalar multiplications in matrix multiplication. It provides an example of calculating the optimal parenthesization of matrix multiplications using a 6x6 matrix. The complexity of the algorithm is O(n^3). Dynamic programming is more efficient than brute force or divide and conquer approaches for this problem. Optimal substructure and overlapping subproblems are elements that allow dynamic programming to be applied. Proofs are given that the unweighted shortest path problem has optimal substructure but the unweighted longest path problem may not.
An Analysis of Graph Cut Size for Transductive Learningbutest
This document presents error bounds for transductive learning algorithms based on graph cut size. It defines the cut size of a vertex labeling as the number of edges connecting differently labeled vertices. Many transductive learning algorithms aim to minimize cut size. The document derives PAC-style error bounds relating the cut size of a labeling to its expected test error. It improves prior bounds by relating cut size to graph-theoretic quantities like minimum k-cut size. The tightest bounds show that with high probability, labelings with smaller relative cut size will have lower test error.
A Branch And Bound Algorithm For The Maximum Clique ProblemSara Alvarez
This document presents a branch and bound algorithm for solving the maximum clique problem based on modeling it as an equivalent quadratic zero-one programming formulation. The algorithm uses dynamic variable selection to order the branching tree. Two different rules for selecting vertices/variables are compared: 1) a greedy approach that selects high connectivity vertices first, and 2) a non-greedy approach that selects low connectivity vertices first. While the greedy approach finds a maximum clique solution sooner, the non-greedy approach typically verifies optimality with a smaller search tree. Computational results on randomly generated graphs with up to 1000 vertices and 150,000 edges demonstrate the effectiveness of the algorithms.
The document discusses approximation algorithms for NP-complete problems. It introduces the concept of approximation ratios, which measure how close an approximate solution from a polynomial-time algorithm is to the optimal solution. The document then provides examples of approximation algorithms with a ratio of 2 for the vertex cover and traveling salesman problems. It also discusses using backtracking to find all possible solutions to the subset sum problem.
My talk at the International Conference on Monte Carlo Methods and Applications (MCM2032) related to advances in mathematical aspects of stochastic simulation and Monte Carlo methods at Sorbonne Université June 28, 2023, about my recent works (i) "Numerical Smoothing with Hierarchical Adaptive Sparse Grids and Quasi-Monte Carlo Methods for Efficient Option Pricing" (link: https://doi.org/10.1080/14697688.2022.2135455), and (ii) "Multilevel Monte Carlo with Numerical Smoothing for Robust and Efficient Computation of Probabilities and Densities" (link: https://arxiv.org/abs/2003.05708).
Perimetric Complexity of Binary Digital ImagesRSARANYADEVI
Perimetric complexity is a measure of the complexity of binary pictures. It is defined as the sum of inside and outside perimeters of the foreground, squared, divided by the foreground area, divided by . Difficulties arise when this definition is applied to digital images composed of binary pixels. In this article we identify these problems and propose solutions. Perimetric complexity is often used as a measure of visual complexity, in which case it should take into account the limited resolution of the visual system. We propose a measure of visual perimetric complexity that meets this requirement.
The document discusses greedy algorithms and provides examples of minimum spanning tree (MST) algorithms. It begins by defining greedy algorithms as making locally optimal choices at each step to arrive at a global solution. Two common MST algorithms, Kruskal's and Prim's, are described. Kruskal's builds the tree by sorting edges by weight and adding the lowest weight edge at each step if it does not form a cycle. Prim's grows the tree from one vertex, always adding the lowest weight edge connecting a tree vertex to a non-tree vertex. The document provides examples of each algorithm applied to weighted graphs.
Similar to Randomized algorithm min cut problem and its solution using karger's algorithm (20)
Elevate Your Nonprofit's Online Presence_ A Guide to Effective SEO Strategies...TechSoup
Whether you're new to SEO or looking to refine your existing strategies, this webinar will provide you with actionable insights and practical tips to elevate your nonprofit's online presence.
Gender and Mental Health - Counselling and Family Therapy Applications and In...PsychoTech Services
A proprietary approach developed by bringing together the best of learning theories from Psychology, design principles from the world of visualization, and pedagogical methods from over a decade of training experience, that enables you to: Learn better, faster!
This document provides an overview of wound healing, its functions, stages, mechanisms, factors affecting it, and complications.
A wound is a break in the integrity of the skin or tissues, which may be associated with disruption of the structure and function.
Healing is the body’s response to injury in an attempt to restore normal structure and functions.
Healing can occur in two ways: Regeneration and Repair
There are 4 phases of wound healing: hemostasis, inflammation, proliferation, and remodeling. This document also describes the mechanism of wound healing. Factors that affect healing include infection, uncontrolled diabetes, poor nutrition, age, anemia, the presence of foreign bodies, etc.
Complications of wound healing like infection, hyperpigmentation of scar, contractures, and keloid formation.
Beyond Degrees - Empowering the Workforce in the Context of Skills-First.pptxEduSkills OECD
Iván Bornacelly, Policy Analyst at the OECD Centre for Skills, OECD, presents at the webinar 'Tackling job market gaps with a skills-first approach' on 12 June 2024
Andreas Schleicher presents PISA 2022 Volume III - Creative Thinking - 18 Jun...EduSkills OECD
Andreas Schleicher, Director of Education and Skills at the OECD presents at the launch of PISA 2022 Volume III - Creative Minds, Creative Schools on 18 June 2024.
Philippine Edukasyong Pantahanan at Pangkabuhayan (EPP) CurriculumMJDuyan
(𝐓𝐋𝐄 𝟏𝟎𝟎) (𝐋𝐞𝐬𝐬𝐨𝐧 𝟏)-𝐏𝐫𝐞𝐥𝐢𝐦𝐬
𝐃𝐢𝐬𝐜𝐮𝐬𝐬 𝐭𝐡𝐞 𝐄𝐏𝐏 𝐂𝐮𝐫𝐫𝐢𝐜𝐮𝐥𝐮𝐦 𝐢𝐧 𝐭𝐡𝐞 𝐏𝐡𝐢𝐥𝐢𝐩𝐩𝐢𝐧𝐞𝐬:
- Understand the goals and objectives of the Edukasyong Pantahanan at Pangkabuhayan (EPP) curriculum, recognizing its importance in fostering practical life skills and values among students. Students will also be able to identify the key components and subjects covered, such as agriculture, home economics, industrial arts, and information and communication technology.
𝐄𝐱𝐩𝐥𝐚𝐢𝐧 𝐭𝐡𝐞 𝐍𝐚𝐭𝐮𝐫𝐞 𝐚𝐧𝐝 𝐒𝐜𝐨𝐩𝐞 𝐨𝐟 𝐚𝐧 𝐄𝐧𝐭𝐫𝐞𝐩𝐫𝐞𝐧𝐞𝐮𝐫:
-Define entrepreneurship, distinguishing it from general business activities by emphasizing its focus on innovation, risk-taking, and value creation. Students will describe the characteristics and traits of successful entrepreneurs, including their roles and responsibilities, and discuss the broader economic and social impacts of entrepreneurial activities on both local and global scales.
Leveraging Generative AI to Drive Nonprofit InnovationTechSoup
In this webinar, participants learned how to utilize Generative AI to streamline operations and elevate member engagement. Amazon Web Service experts provided a customer specific use cases and dived into low/no-code tools that are quick and easy to deploy through Amazon Web Service (AWS.)
Randomized algorithm min cut problem and its solution using karger's algorithm
1. Randomized Algorithm
Min-cut Problem and it’s solution using Karger’s Algorithm
Guided By :-
👩 Prof. Sonia Mittal
👦 Gaurang Savaliya (16MCA058)
Nirma University, Ahmedabad,
Gujarat,India
2. Introduction
2
A randomized algorithm is an algorithm that receives, in addition to its
input, a stream of random bits which is used to make random choices.
The random bits are assumed to be independent of the input.
A salient feature is that repeated runs of a randomized algorithm with
fixed input data will, in general, not produce the same result.
You might be perplexed that such a lack of definiteness is desirable,
but consider that this feature allows to transform deterministic
algorithms with bad worst case behaviour into randomized algorithms
that perform well with high probability on any input.
I hope that the next example can convey that randomized algorithms
are often simple and efficient.
3. “Let G = (V,E) be a connected, undirected, loop free multigraph with n
vertices. A multigraph is like a graph but may contain multiple edges
between two vertices, as the following example shows.
A Min Cut Algorithm
A B
C D E
F
4. A Min Cut Problem
▸A cut in the multigraph G = (V,E) is a partition of the vertex set V into
two disjoint nonempty sets V = V1∪V2.
▸ An edge with one end in V1 and the other in V2 is said to cross the cut.
The cut is often identified with the multiset of crossing edges.
▸The term cut is chosen because the removal of the edges in a cut
partitions the multigraph.
▸example, if we partition V = {A,B,C,D,E,F} into the sets V1 = {A,C} and V2
= {B,D,E,F} in the previous example, then this cut has five crossing edges,
and removing these edges yields the disconnected multigraph:
4
5. A B
C D E
F
The size of the cut is given by the number of edges crossing the cut. Our
goal is to determine the minimum size of a cut in a given multigraph G.
We describe a very simple randomized algorithm for this purpose. If e
is an edge of a loop free multigraph G, then the multigraph G/e is
obtained from G by contracting the edge e = {x,y}, that is, we identify
the vertices x and y and remove all resulting loops.
8. Karger’s Min cut algorithm
▸The above figure shows a multigraph G and the multigraph G/{C,D}
resulting from contracting an edge between C and D. We keep the label
of one vertex to avoid cluttered notations, but keep in mind that a node D
in the graph G/{C,D} really represents the set of all nodes that are
identified with D.
A B
C D E
F
A B
D E
F
9. A Min Cut Algorithm
▸The size of the minimum cut of G/e is at least the size of the minimum
cut of G, because all edges are kept. Thus we can use successive
contractions to estimate the size of the minimum cut of G. This is the
basic idea of the following randomized algorithm.
▸Contract(G)
▸Input: A connected loop free multigraph G = (V,E) with at least 2
vertices.
▸1: while |V | > 2 do
▸2: Select e ∈ E uniformly at random;
▸3: G := G/e;
▸4: od;
▸5: return |E|.
▸Output: An upper bound on the minimum cut of G.
10. Two different runs of the
Contract algorithm. The
algorithm does not always
produce the correct result.
The run shown in the left
column correctly determines
the minimum cut size to be 3.
The run shown in the right
column fails to produce the
correct result; here the
algorithm will claim that the
size of the minimum cut is 6.
11. Analysis
▸It is not difficult to show that the correct size of a minimum cut will be
found by the algorithm Contract with probability Ω(n), where n denotes
the number of vertices of the multigraph.
▸ Repeating the algorithm O(n2 logn) times and choosing the smallest
value returned by the runs yields the correct size of the minimum cut
with high probability.
12. Analysis
The beauty of this scheme is its simplicity.
If G is represented as a labeled graph, where the labels denote
the multiplicity of the edges, then Contract can be implemented
with O(n2) operations; running the algorithm repeatedly, as
suggested before, yields at total of O(n4 logn) operations.
13. Remarks
The running time of the best deterministic minimum cut
algorithm is O(nm + n2 logn), where m denotes the number of
edges, that is, in the labeled graph representation the running
time is at most O(n3), see for instance [2]. It turns out that size
of the minimum cut can be determined with high probability in
O(n2 log3 n) steps using a refined version of the contraction
algorithm, see [1].