Download as PDF, PPTX
![Operators
● Grouping: ()
● Assignment: to<-from AND from->to
● Vectorized: + - ! * / ^ %% & |
● ~ ? : %/% %*% %o% %x% %in% < > == >=
<= && ||
● Element access: [[]] [] $
● Function argument types:
– symbol, symbol=default, ...](https://image.slidesharecdn.com/r-150517174529-lva1-app6892/85/R-the-language-12-320.jpg)


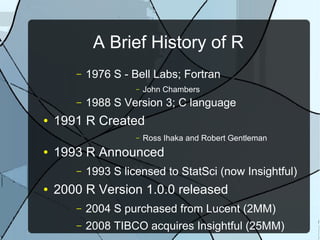
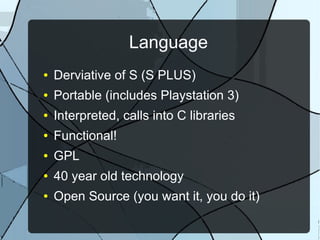
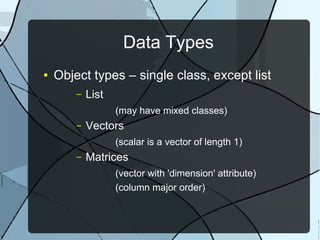
The document provides a comprehensive history and overview of the R programming language, detailing its origins, development, and applications in statistical analysis and data visualization. It outlines various data types, control structures, and key packages used in R, including tools for reproducible research and data exploration. Additionally, it highlights resources for sharing research findings and creating interactive visualizations with R.


![제 23회 보아즈(BOAZ) 빅데이터 컨퍼런스 - [MBOAX] : ABSA를 활용한 소비자 반응 분석 기반 운영 효율화 대시보드 설계](https://cdn.slidesharecdn.com/ss_thumbnails/3-1boaz23rdconferencemboax-260203102709-9d519923-thumbnail.jpg?width=640&height=640&fit=bounds)


