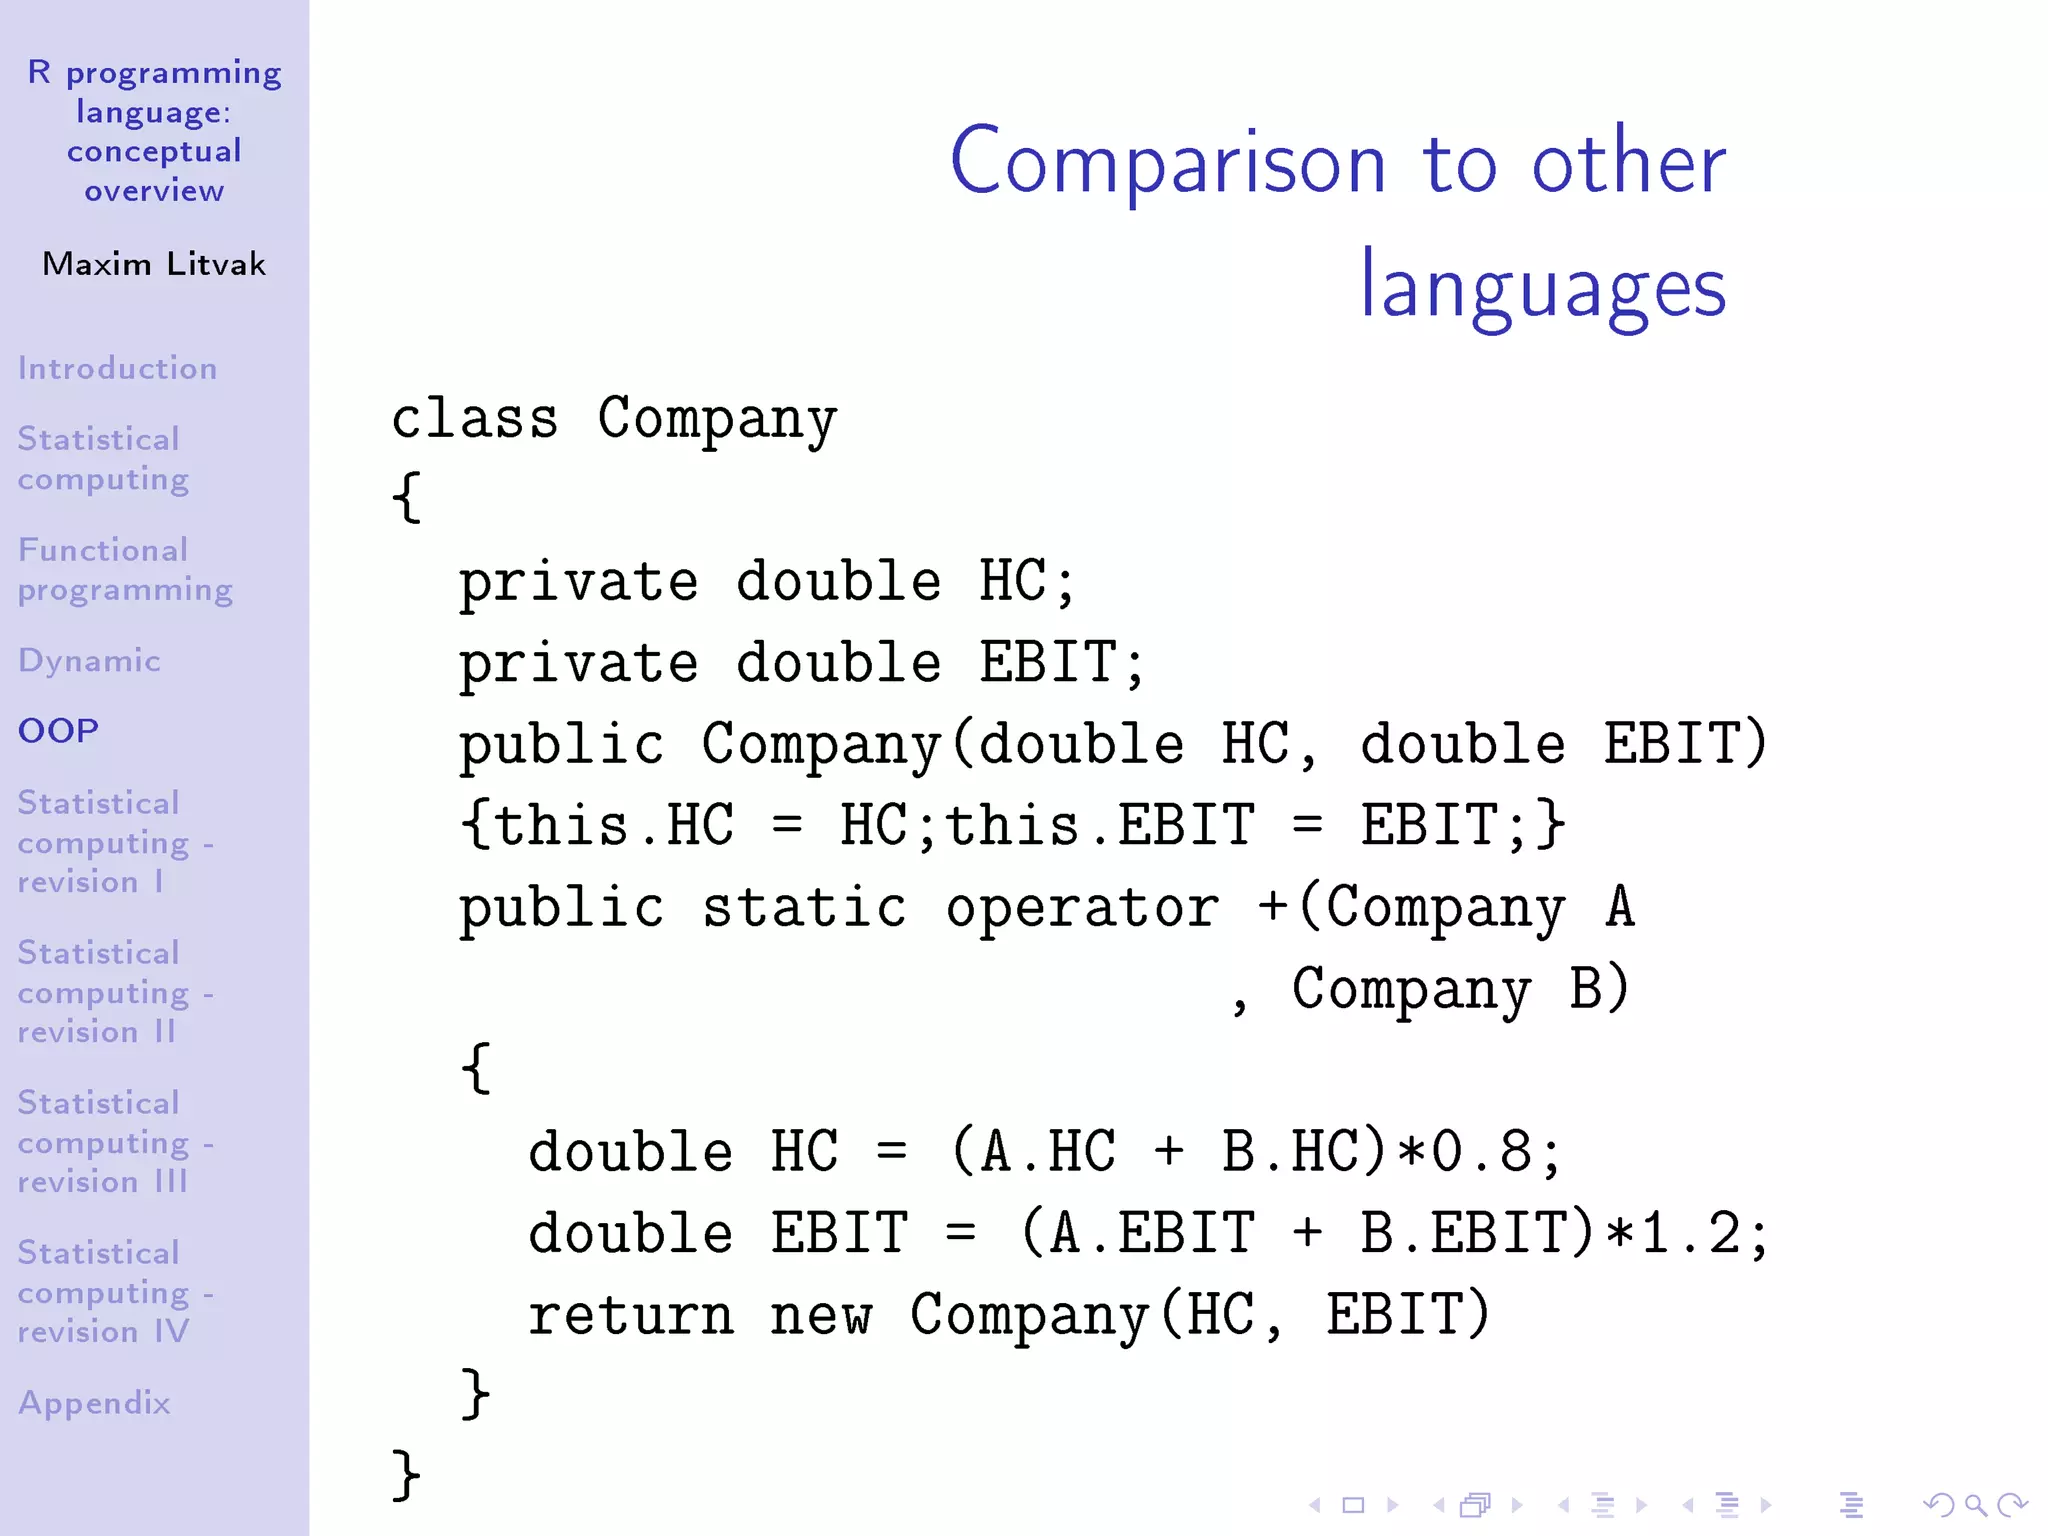
The document provides a conceptual overview of the R programming language, emphasizing its dynamic nature, statistical computing capabilities, and features of functional and object-oriented programming. It discusses key properties of R, the importance of understanding its paradigms, and includes examples of function behavior and design principles. The document also compares R's object-oriented features with those of other programming languages and references further readings and resources.
![R programming
language:
conceptual
overview
Maxim Litvak
Introduction
Statistical
computing
Functional
programming
Dynamic
OOP
Statistical
computing -
revision I
Statistical
computing -
revision II
Statistical
computing -
revision III
Statistical
computing -
revision IV
Appendix
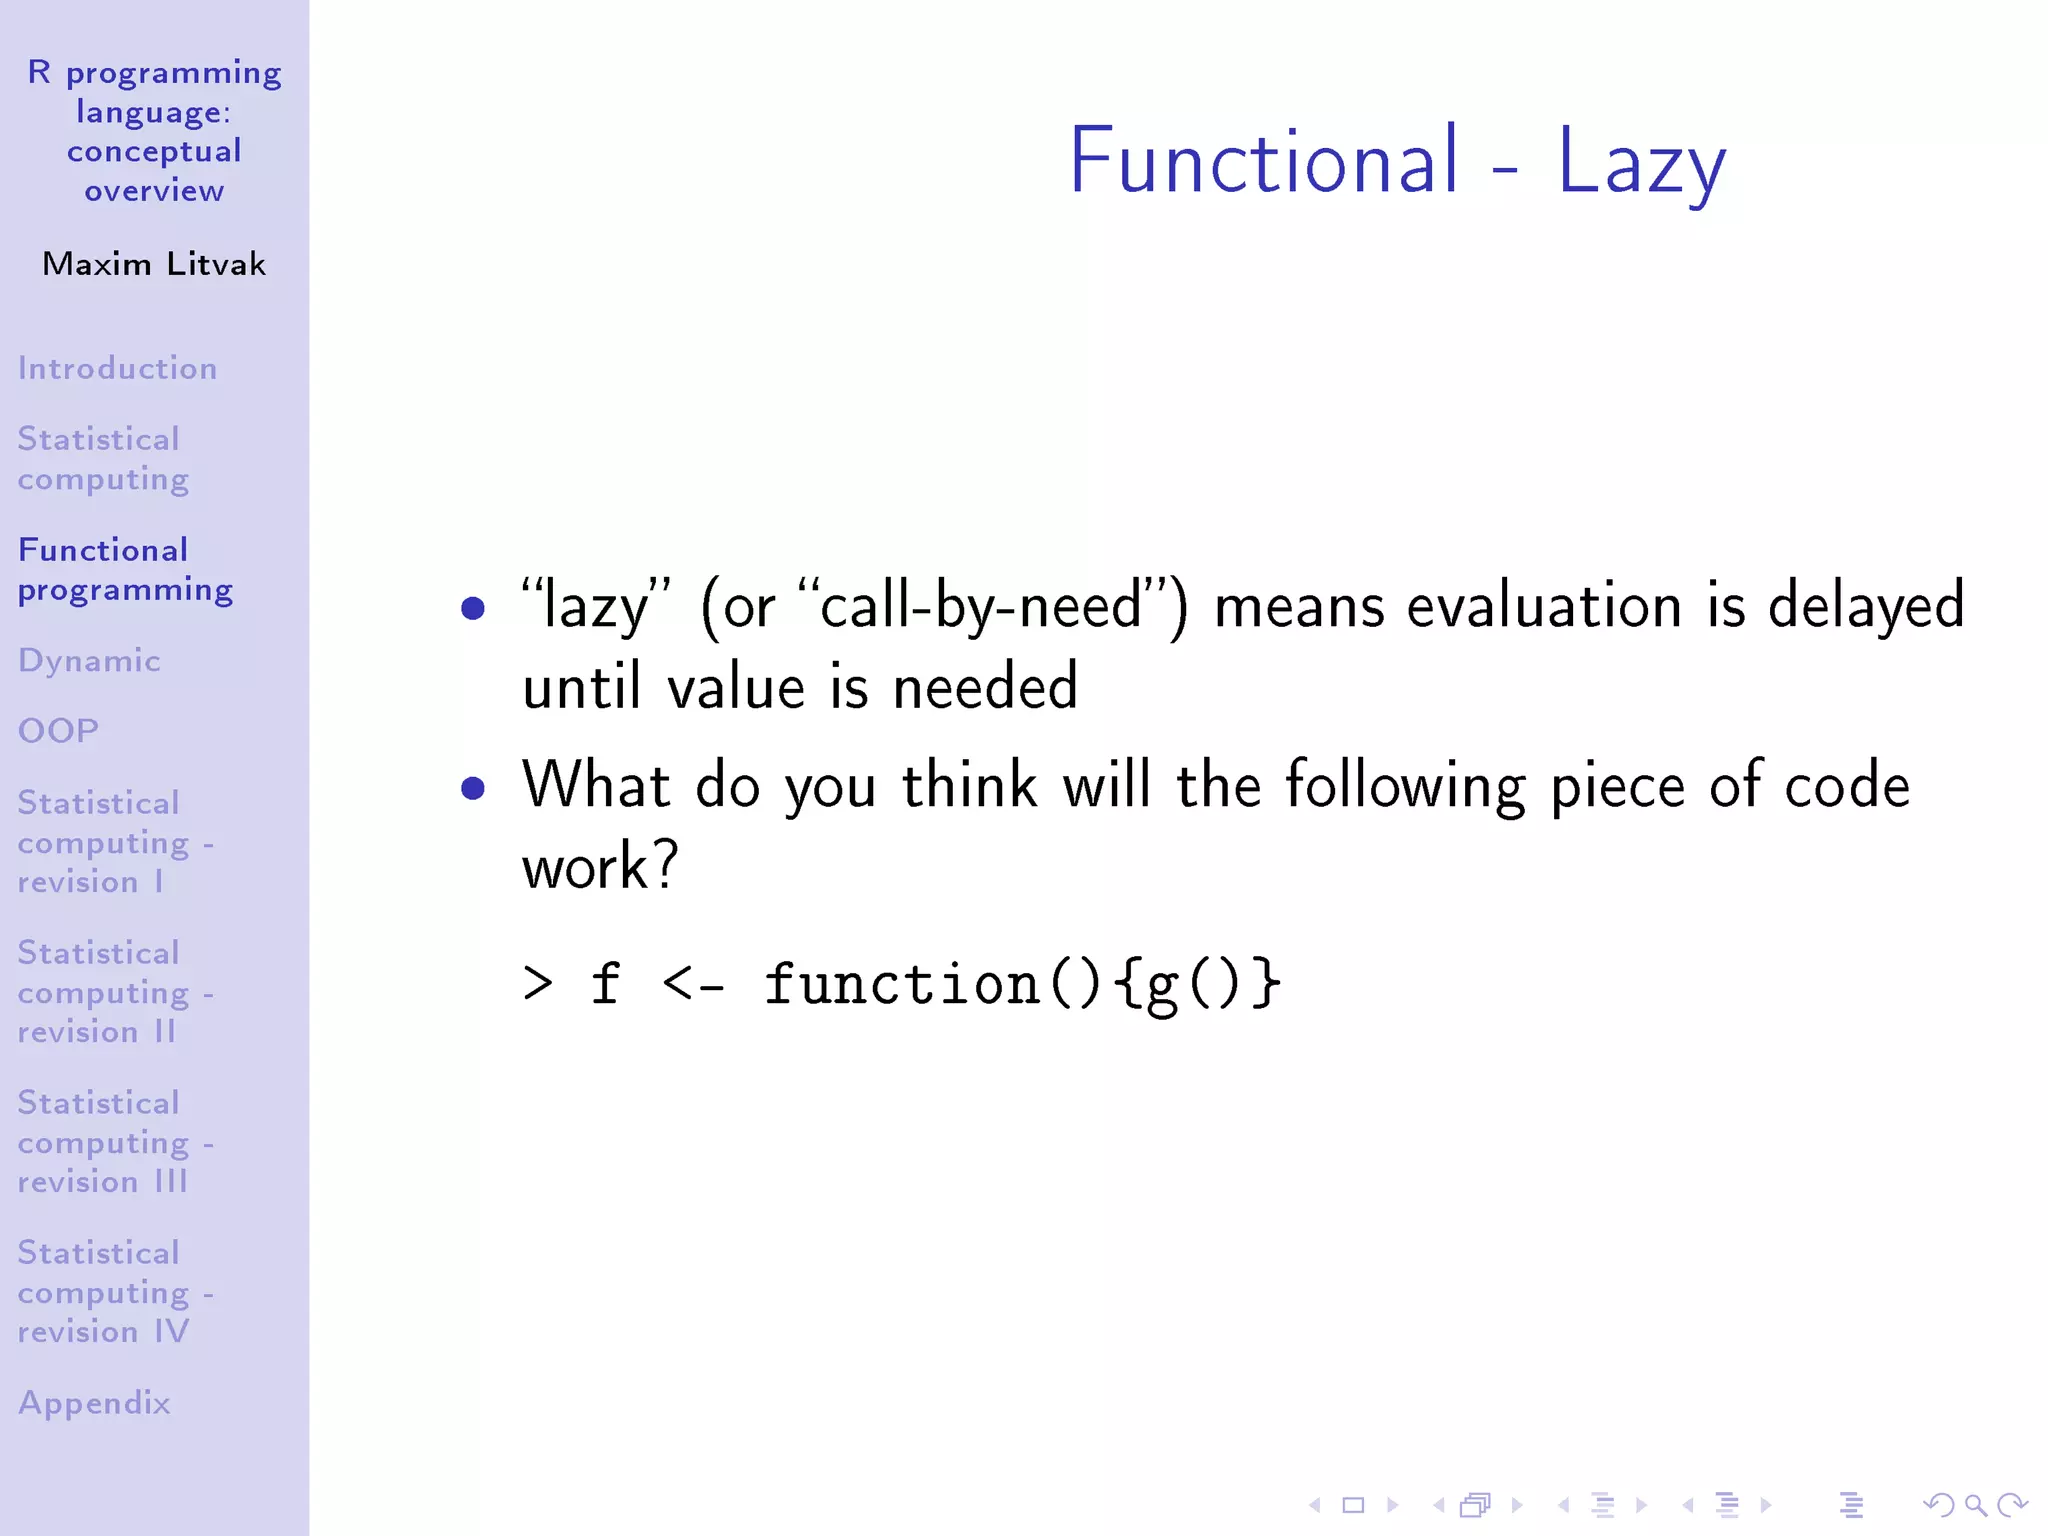
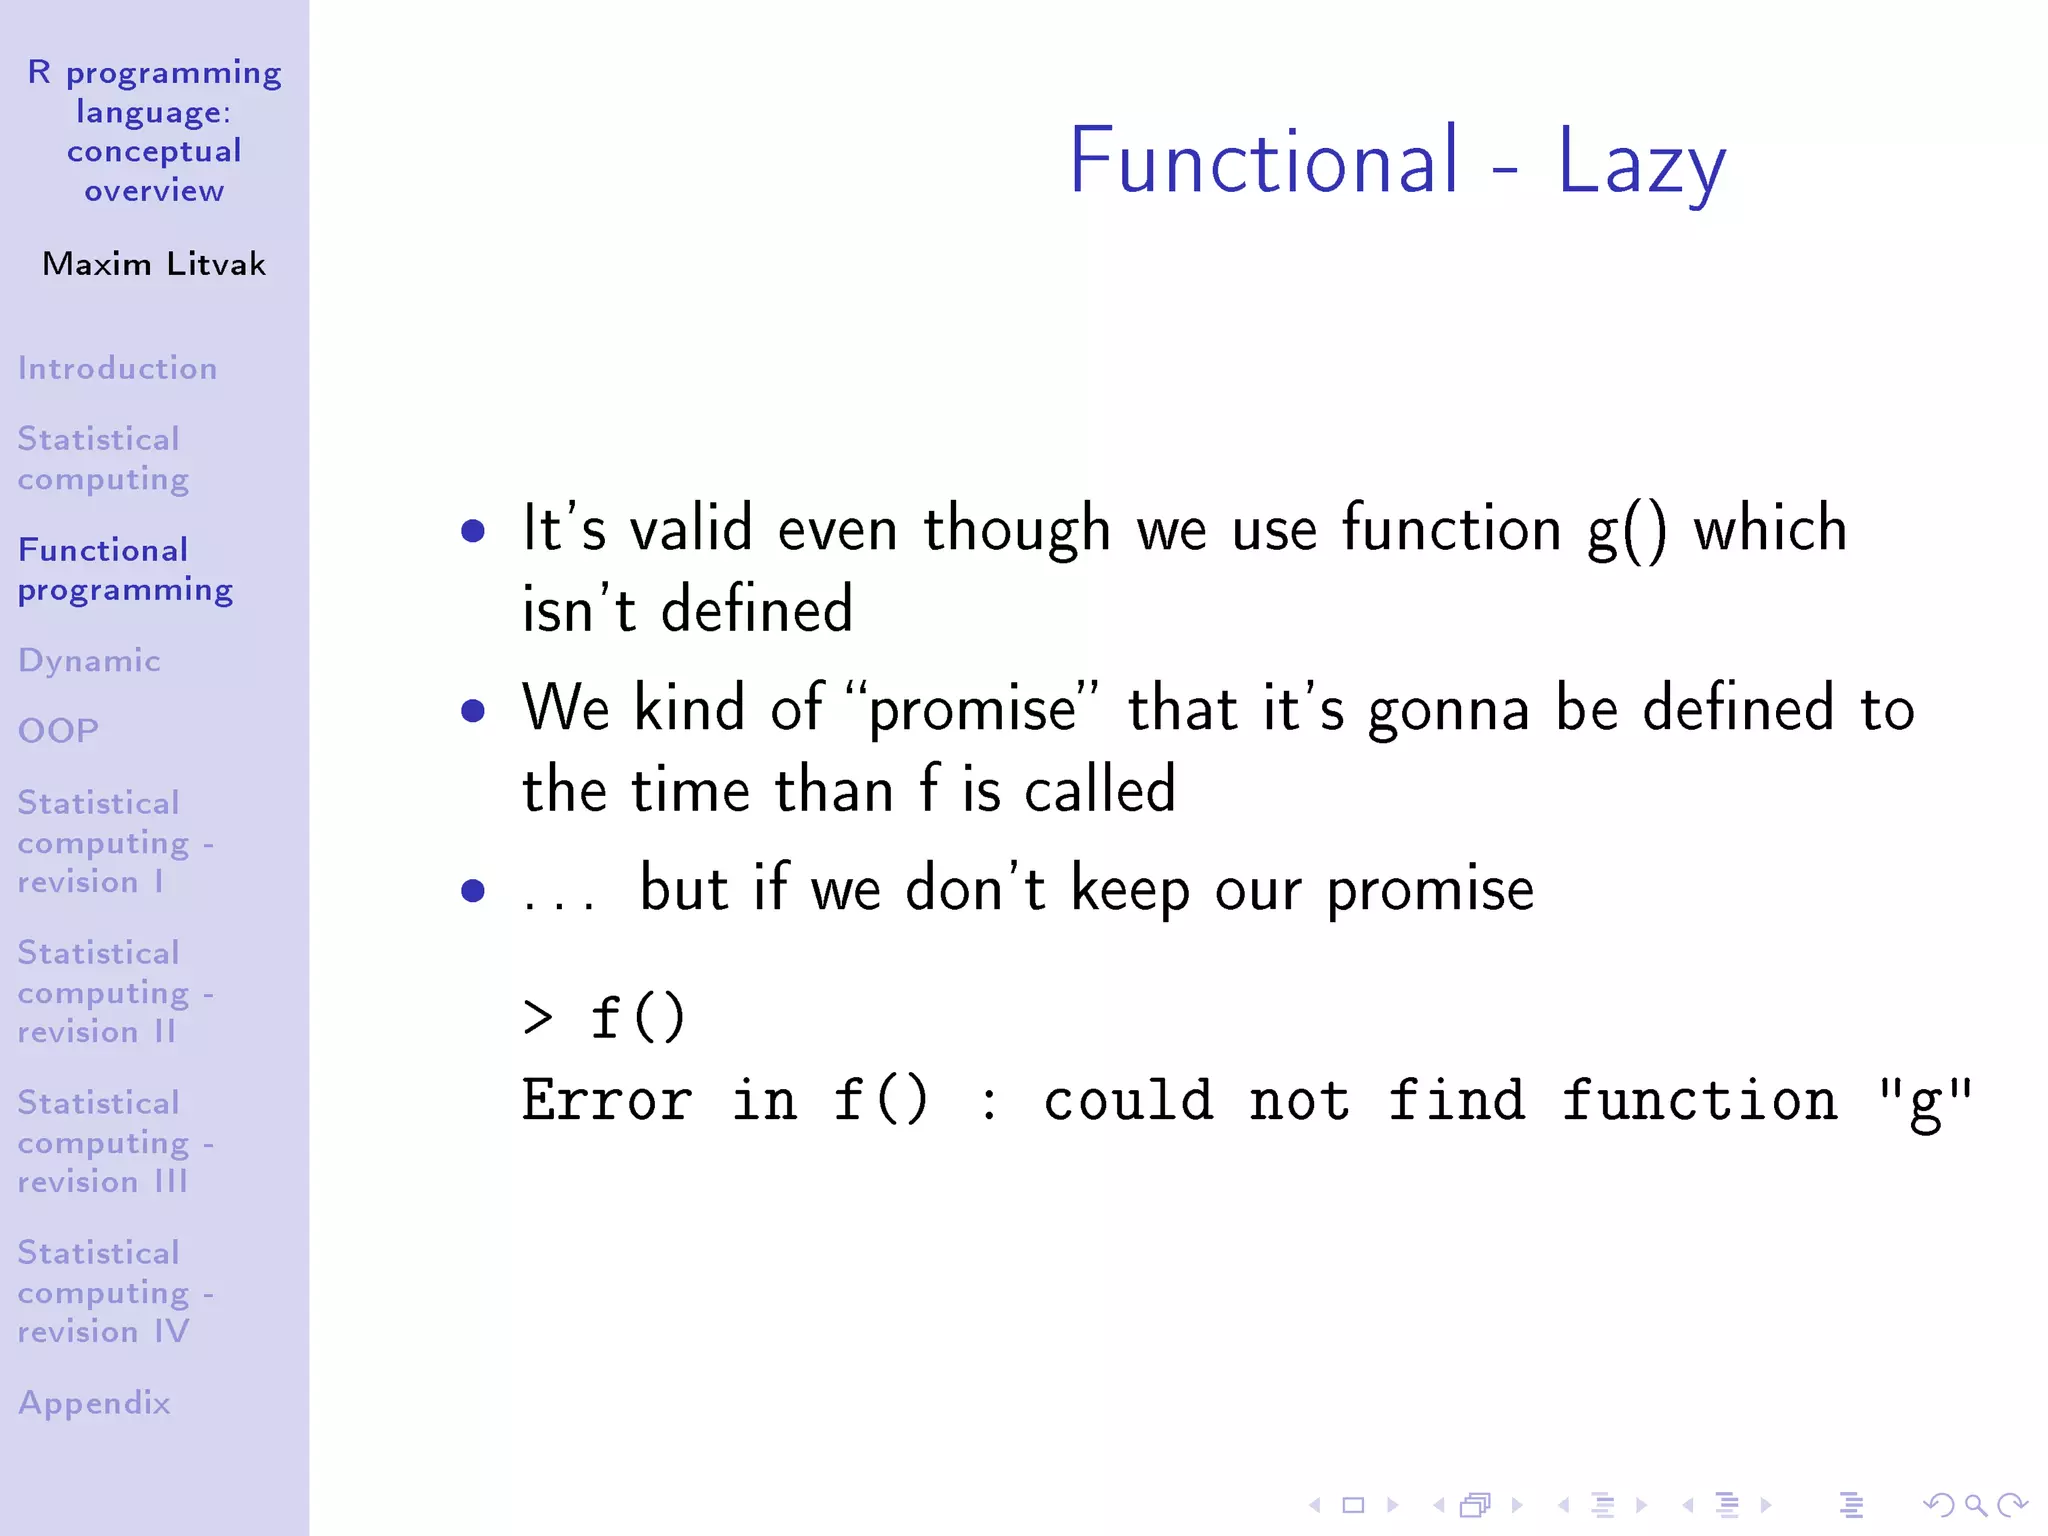
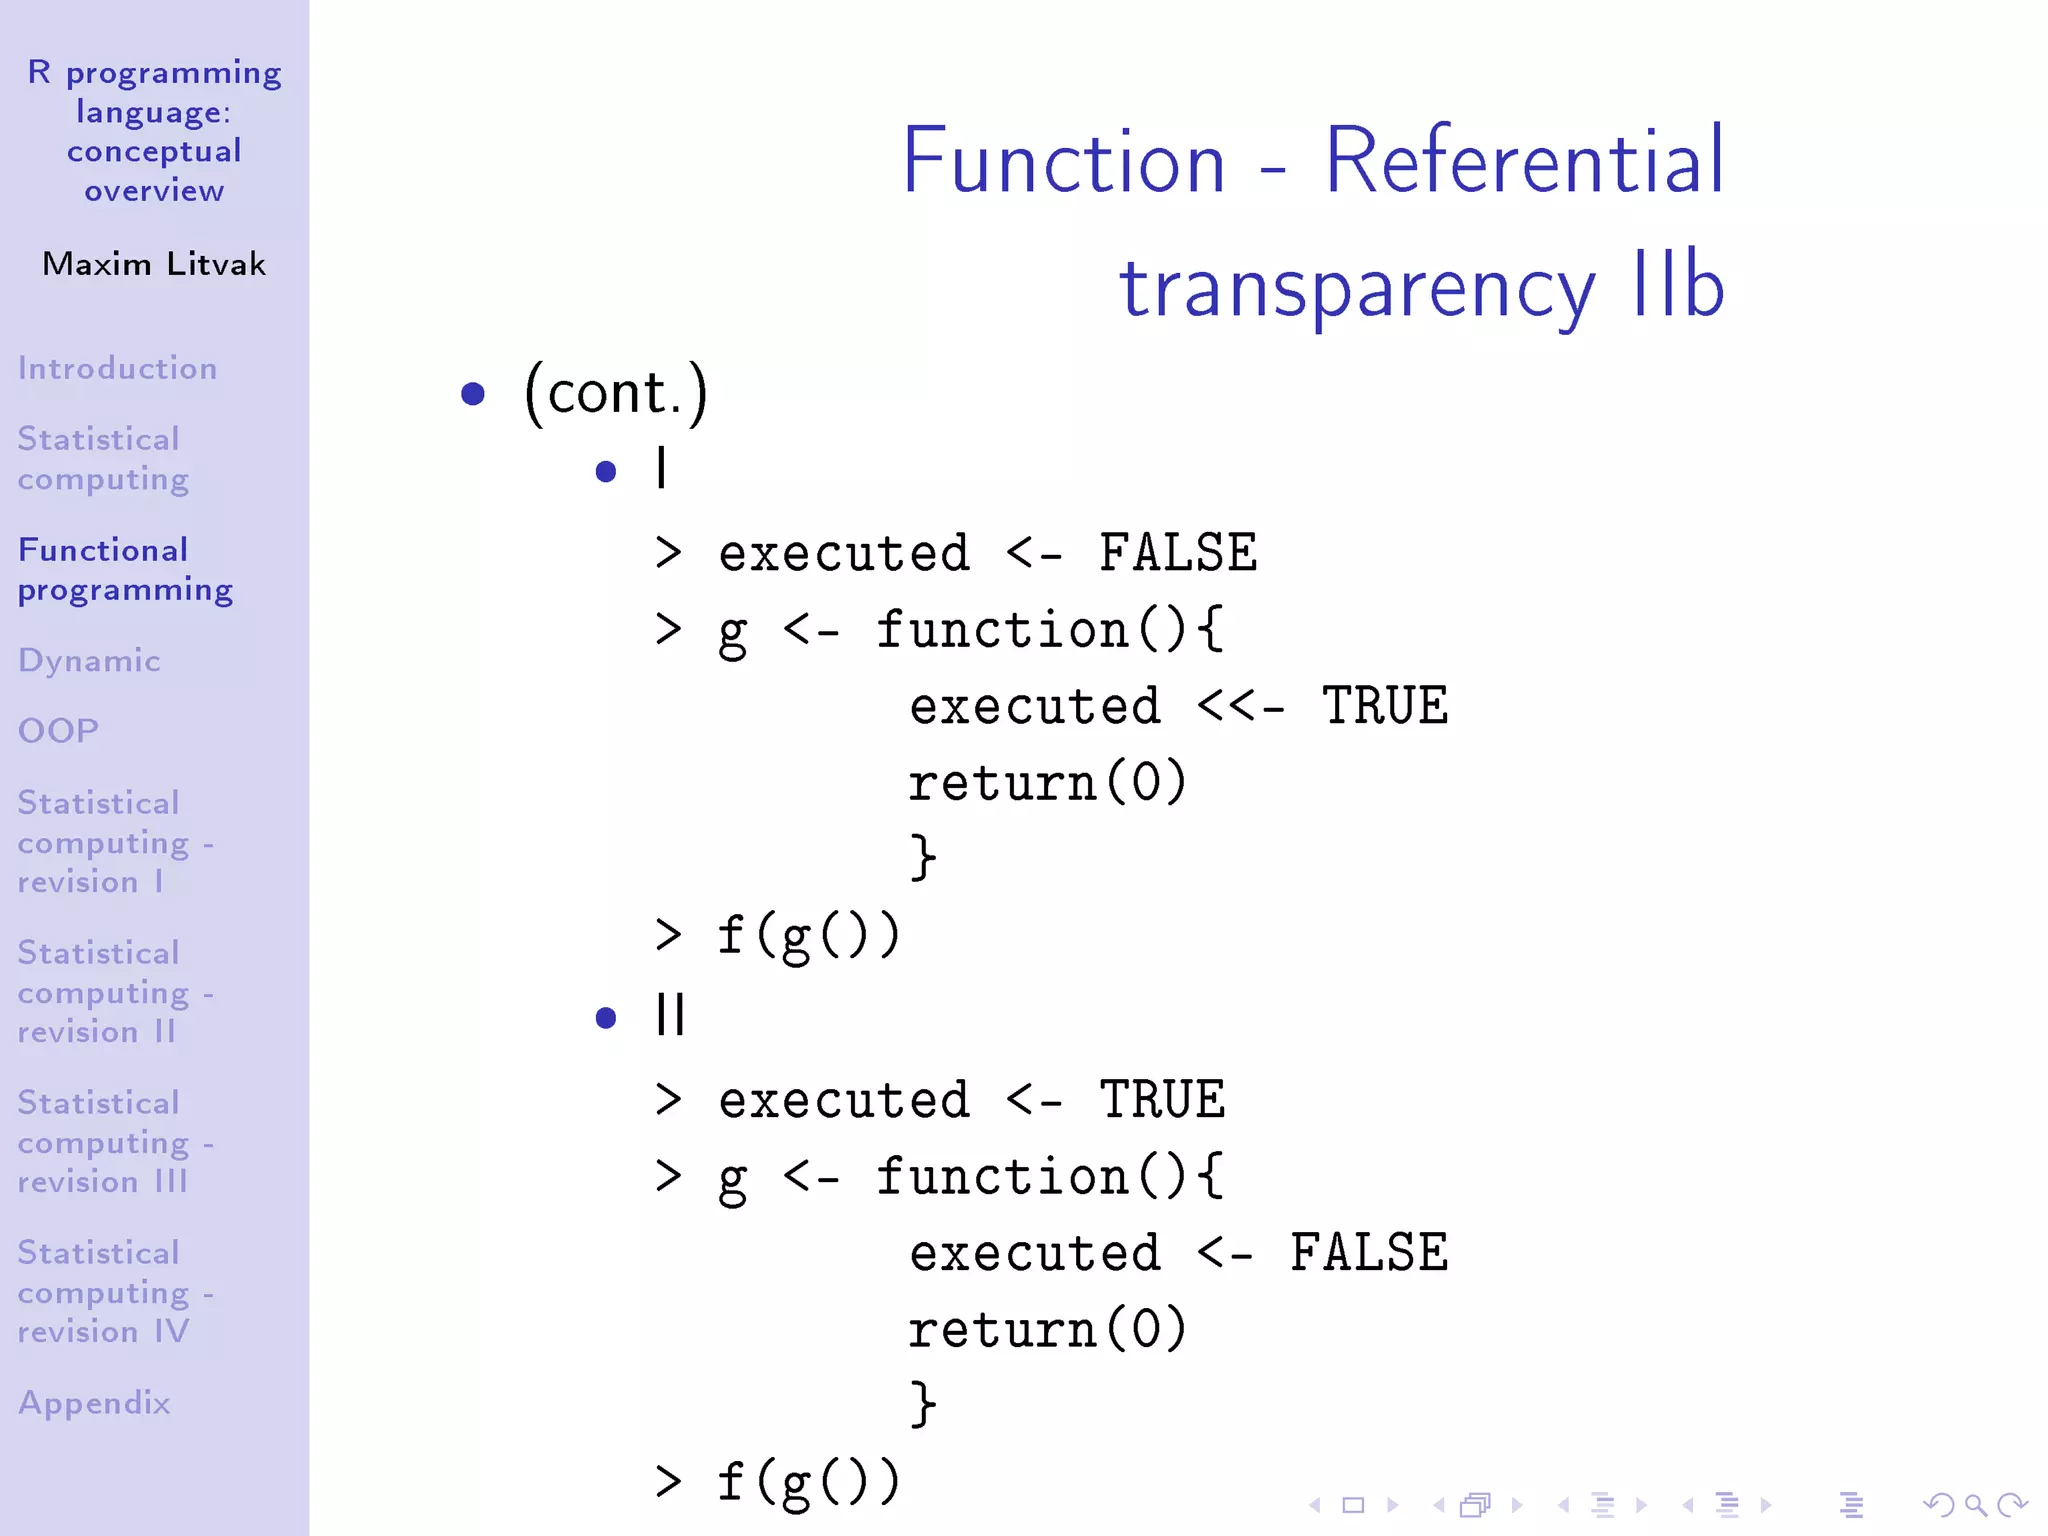
Functional - Lazy
ˆ Now, let's dene the function g() before calling the
function f()
g - function() 0 # now g() is defined
f()
[1] 0
ˆ Now it works](https://image.slidesharecdn.com/r-workshop-general-overview-160711203525/75/R-programming-language-conceptual-overview-11-2048.jpg)
![R programming
language:
conceptual
overview
Maxim Litvak
Introduction
Statistical
computing
Functional
programming
Dynamic
OOP
Statistical
computing -
revision I
Statistical
computing -
revision II
Statistical
computing -
revision III
Statistical
computing -
revision IV
Appendix
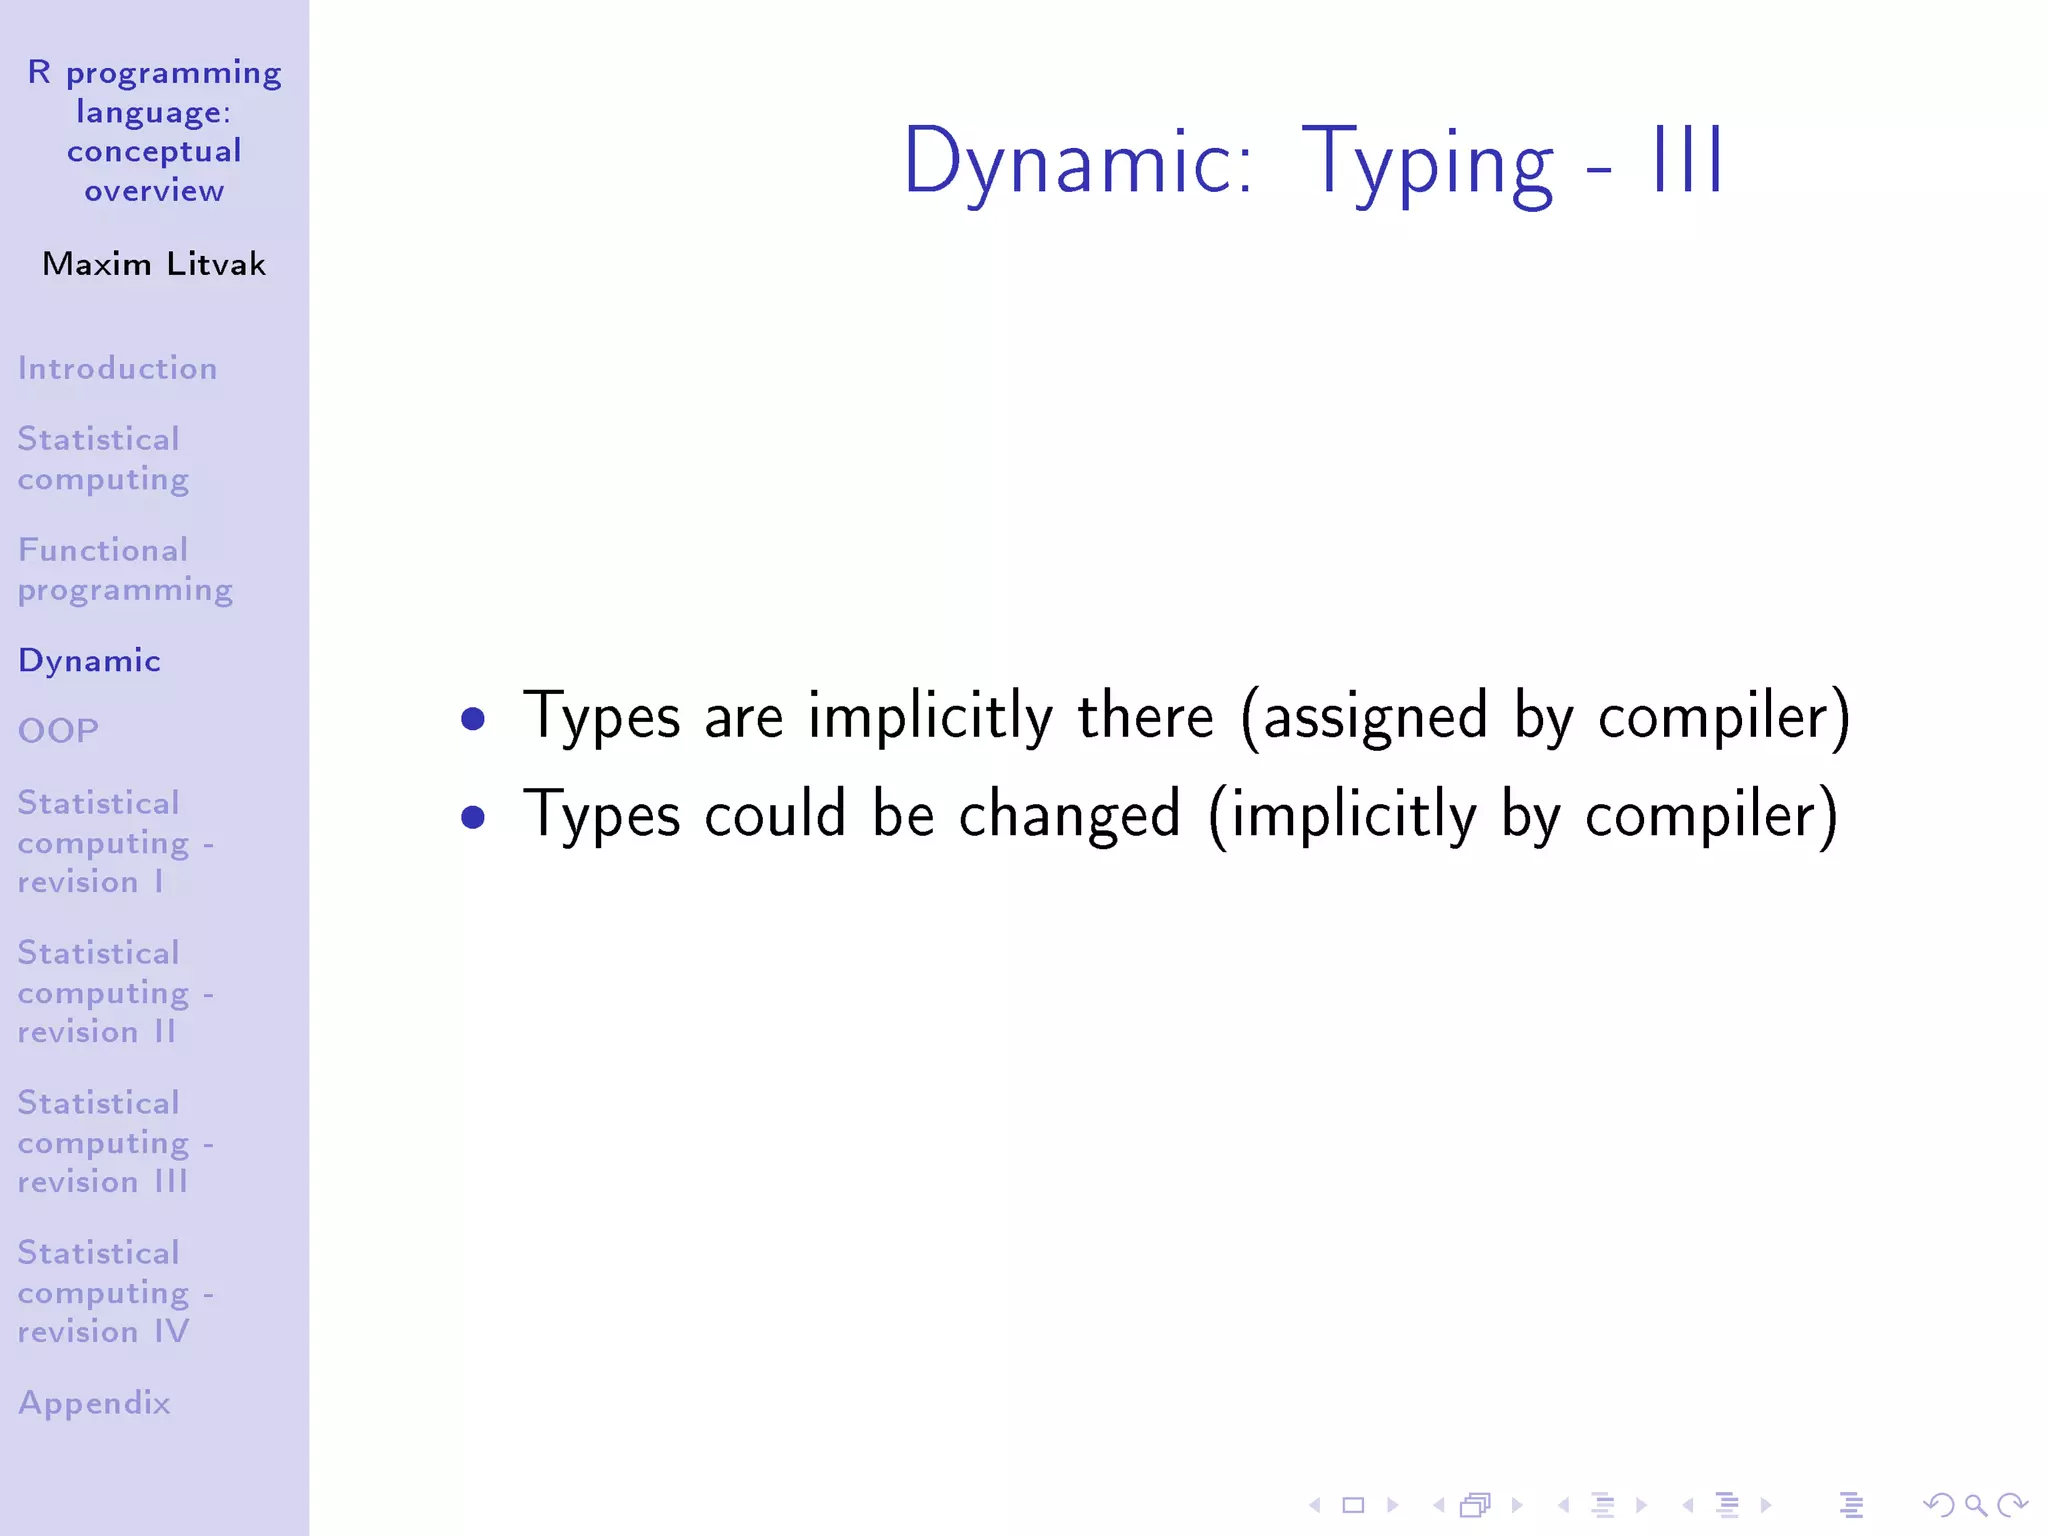
Dynamic: Typing - I
ˆ Types are optional and could be changed
Code
var - FALSE
class(var)
[1] logical
var
[1] FALSE
var[3] - 1
class(var)
numeric
var
[1] 0 NA 1](https://image.slidesharecdn.com/r-workshop-general-overview-160711203525/75/R-programming-language-conceptual-overview-15-2048.jpg)
![R programming
language:
conceptual
overview
Maxim Litvak
Introduction
Statistical
computing
Functional
programming
Dynamic
OOP
Statistical
computing -
revision I
Statistical
computing -
revision II
Statistical
computing -
revision III
Statistical
computing -
revision IV
Appendix
Dynamic: Typing - II
ˆ What do you think would be the type of var
variable after the following action?
var - !
var[3] - 1](https://image.slidesharecdn.com/r-workshop-general-overview-160711203525/75/R-programming-language-conceptual-overview-16-2048.jpg)
![R programming
language:
conceptual
overview
Maxim Litvak
Introduction
Statistical
computing
Functional
programming
Dynamic
OOP
Statistical
computing -
revision I
Statistical
computing -
revision II
Statistical
computing -
revision III
Statistical
computing -
revision IV
Appendix
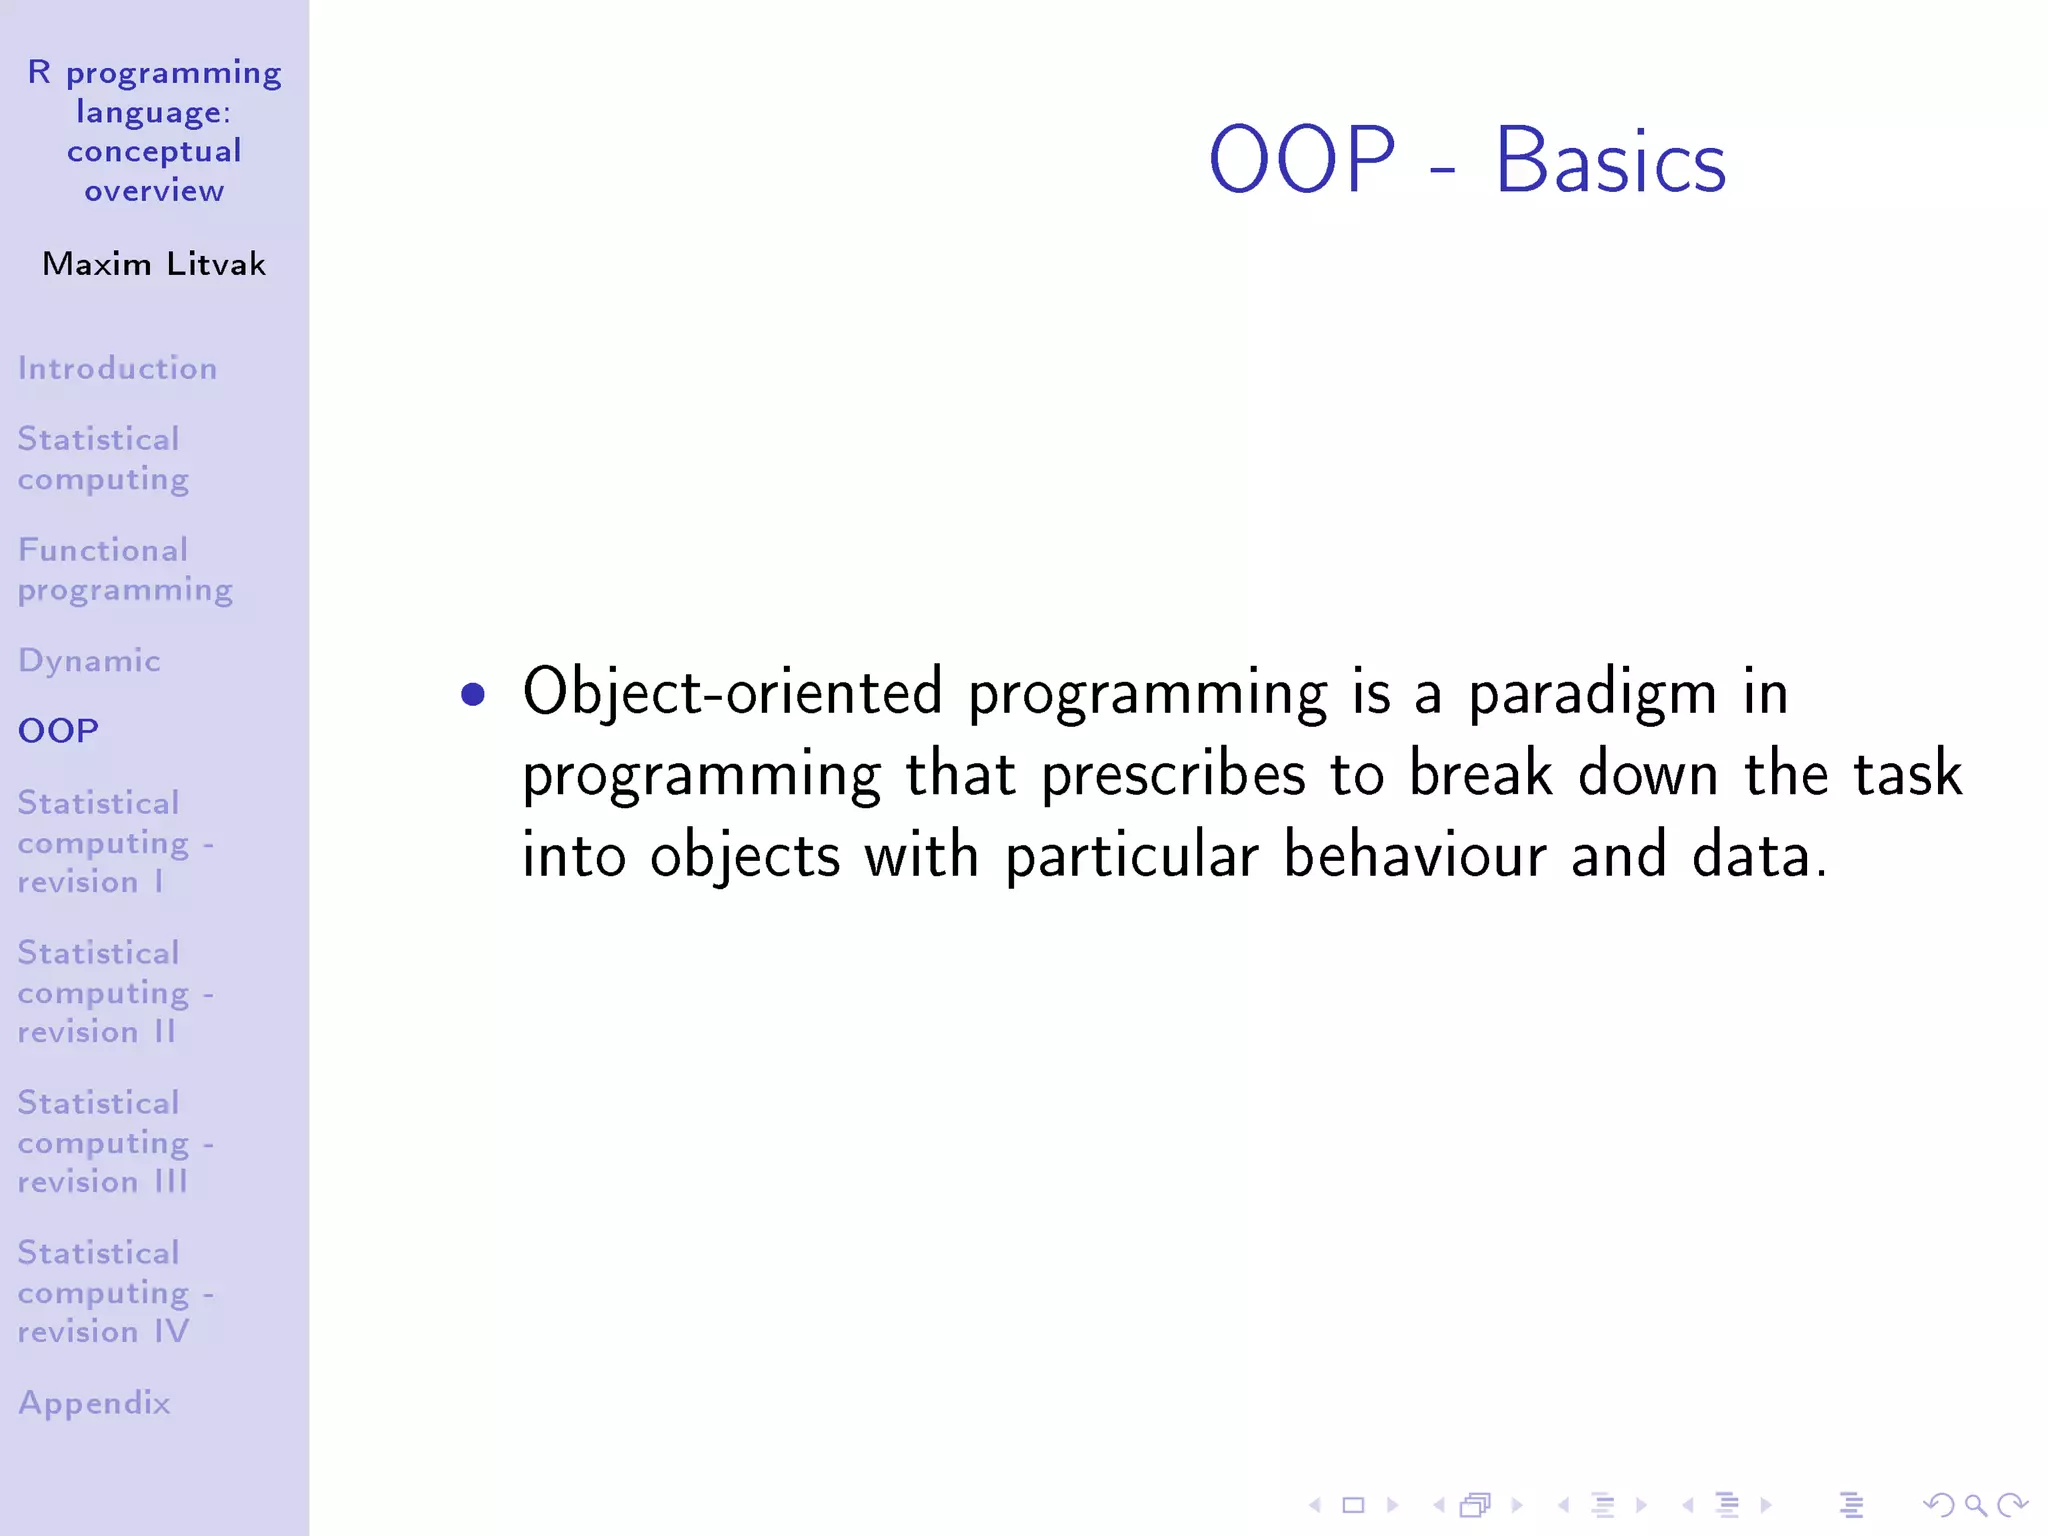
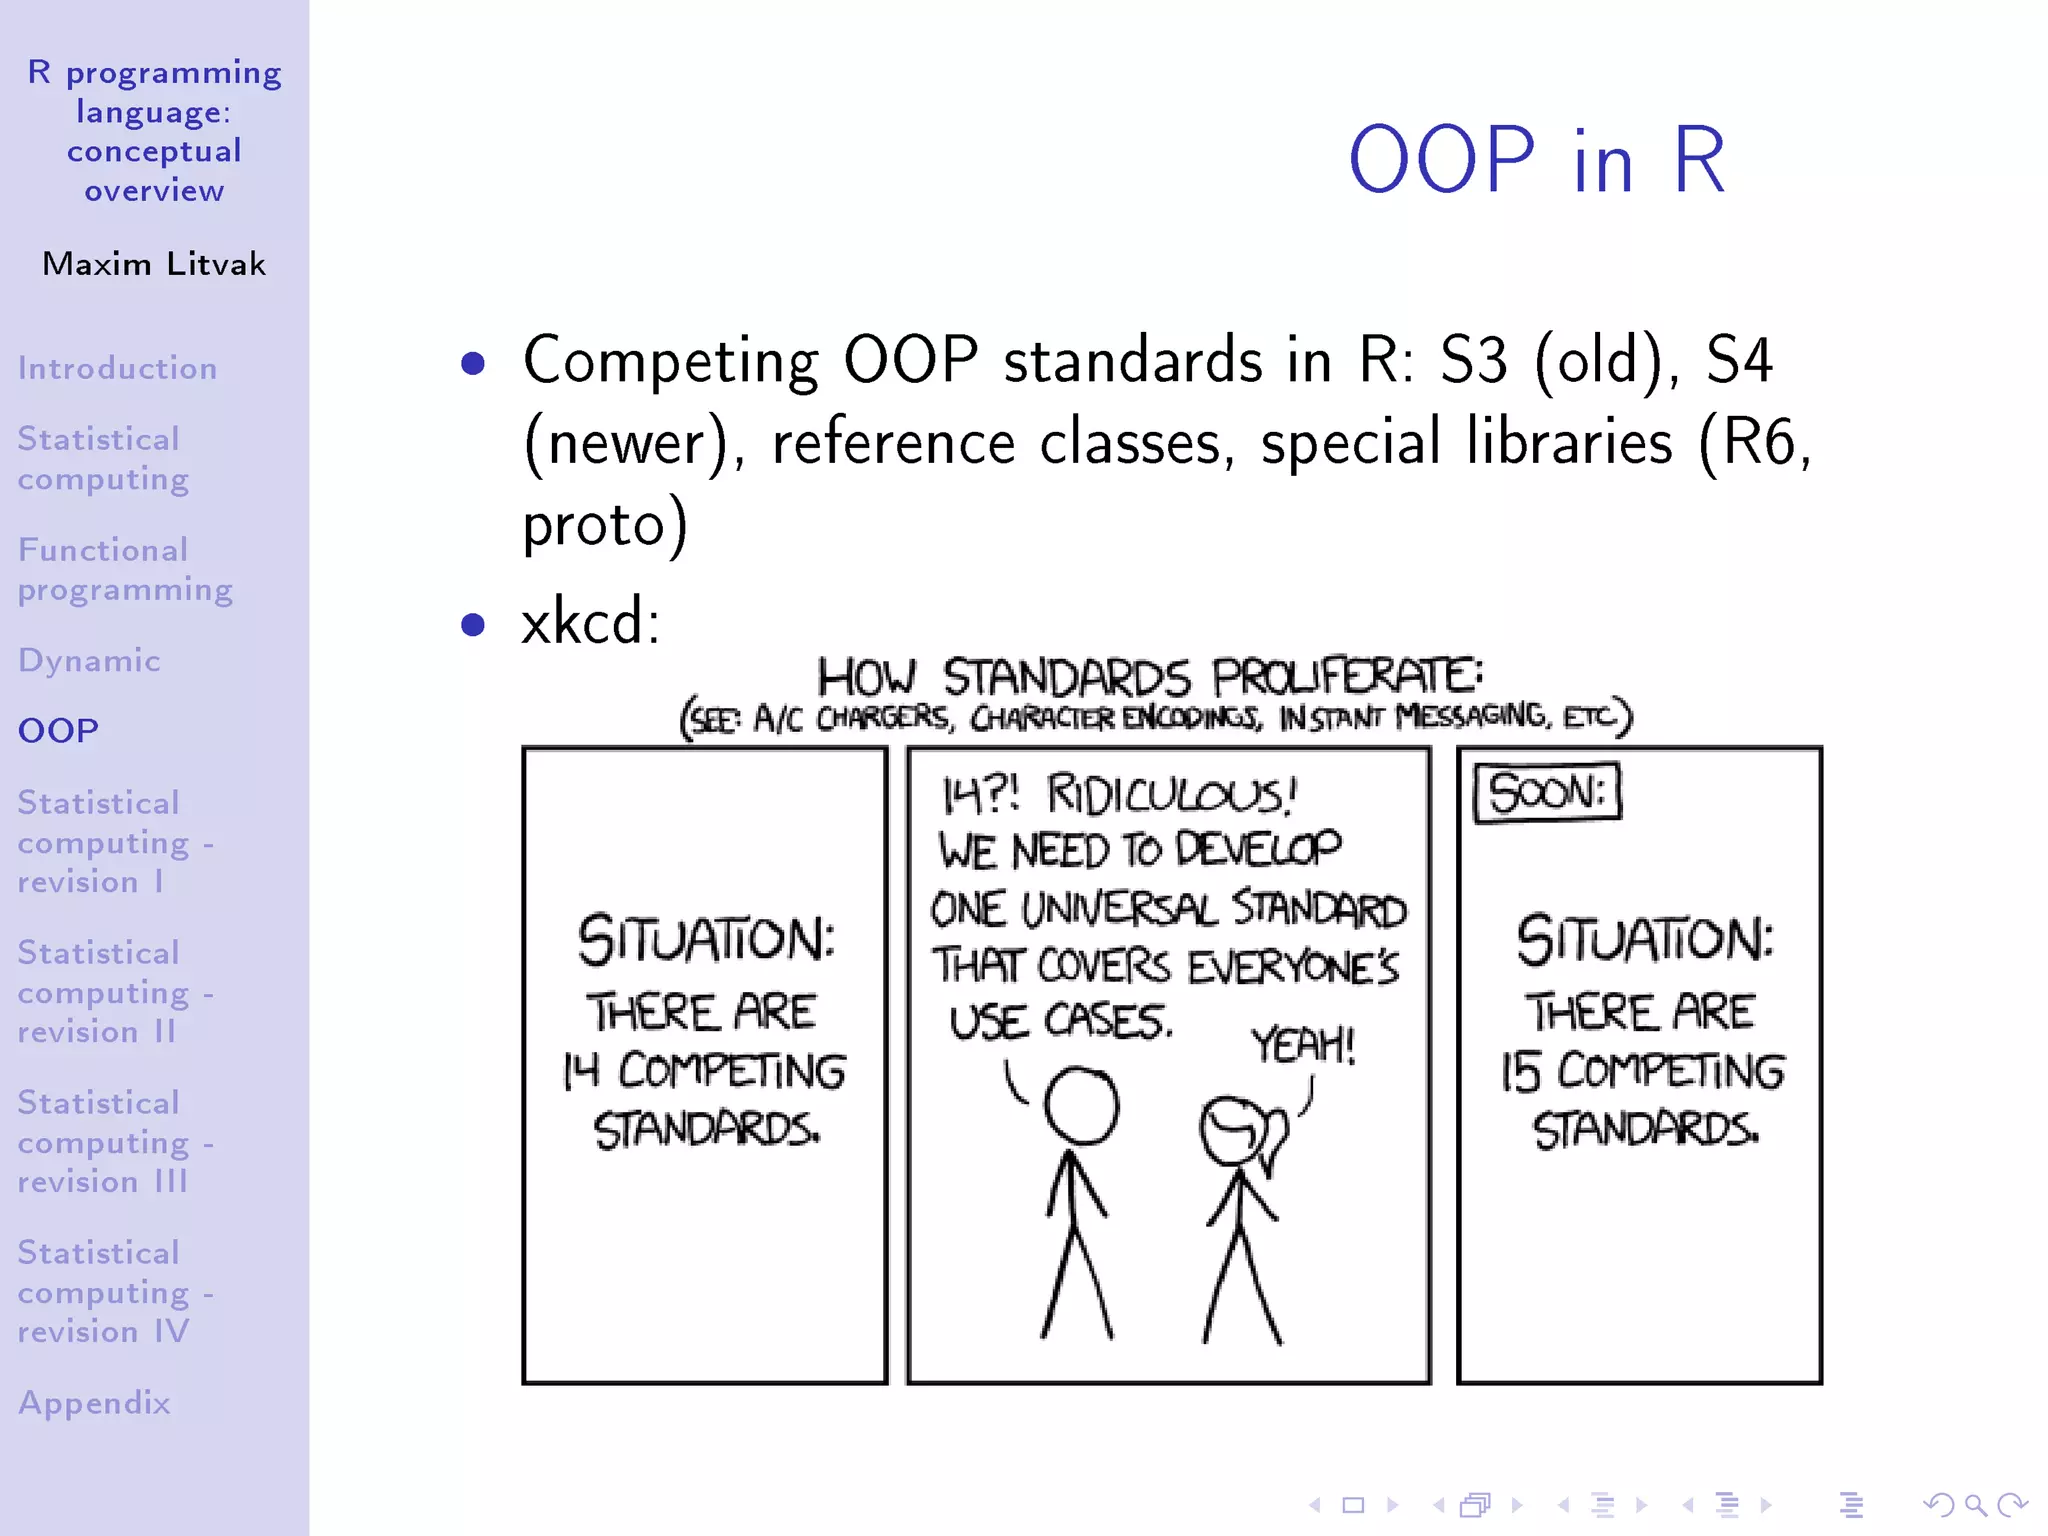
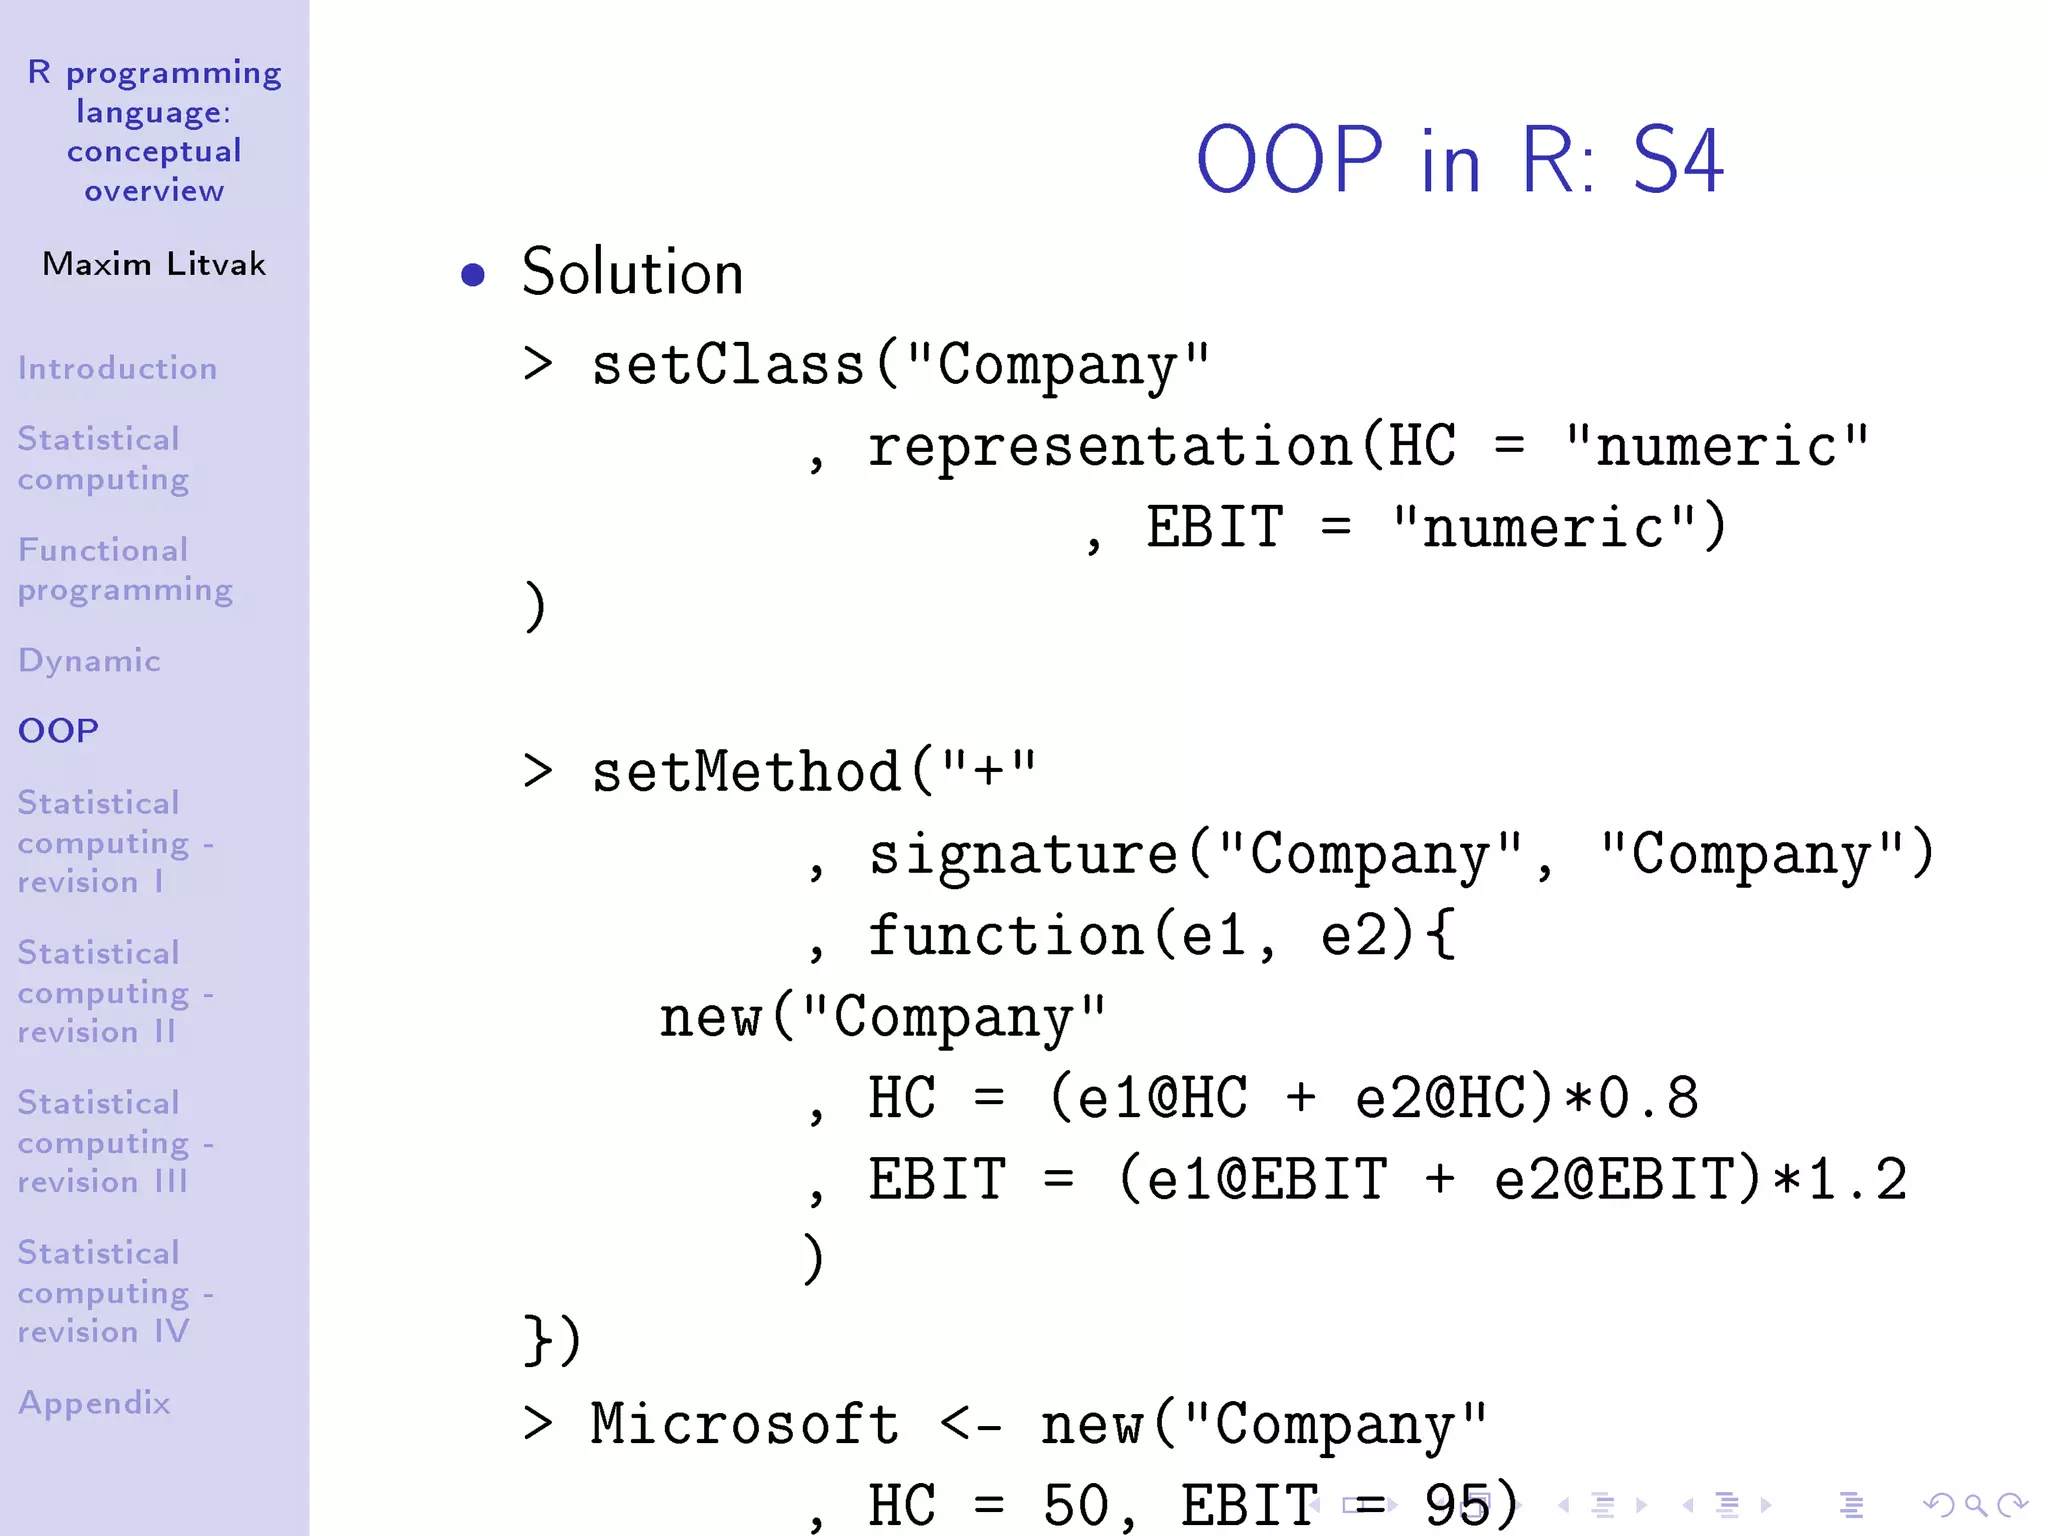
OOP in R: S4
ˆ Result
Microsoft + LinkedIn
An object of class Company
Slot HC:
[1] 41.6
Slot EBIT:
[1] 120](https://image.slidesharecdn.com/r-workshop-general-overview-160711203525/75/R-programming-language-conceptual-overview-23-2048.jpg)
![R programming
language:
conceptual
overview
Maxim Litvak
Introduction
Statistical
computing
Functional
programming
Dynamic
OOP
Statistical
computing -
revision I
Statistical
computing -
revision II
Statistical
computing -
revision III
Statistical
computing -
revision IV
Appendix
Statistical computing -
revision
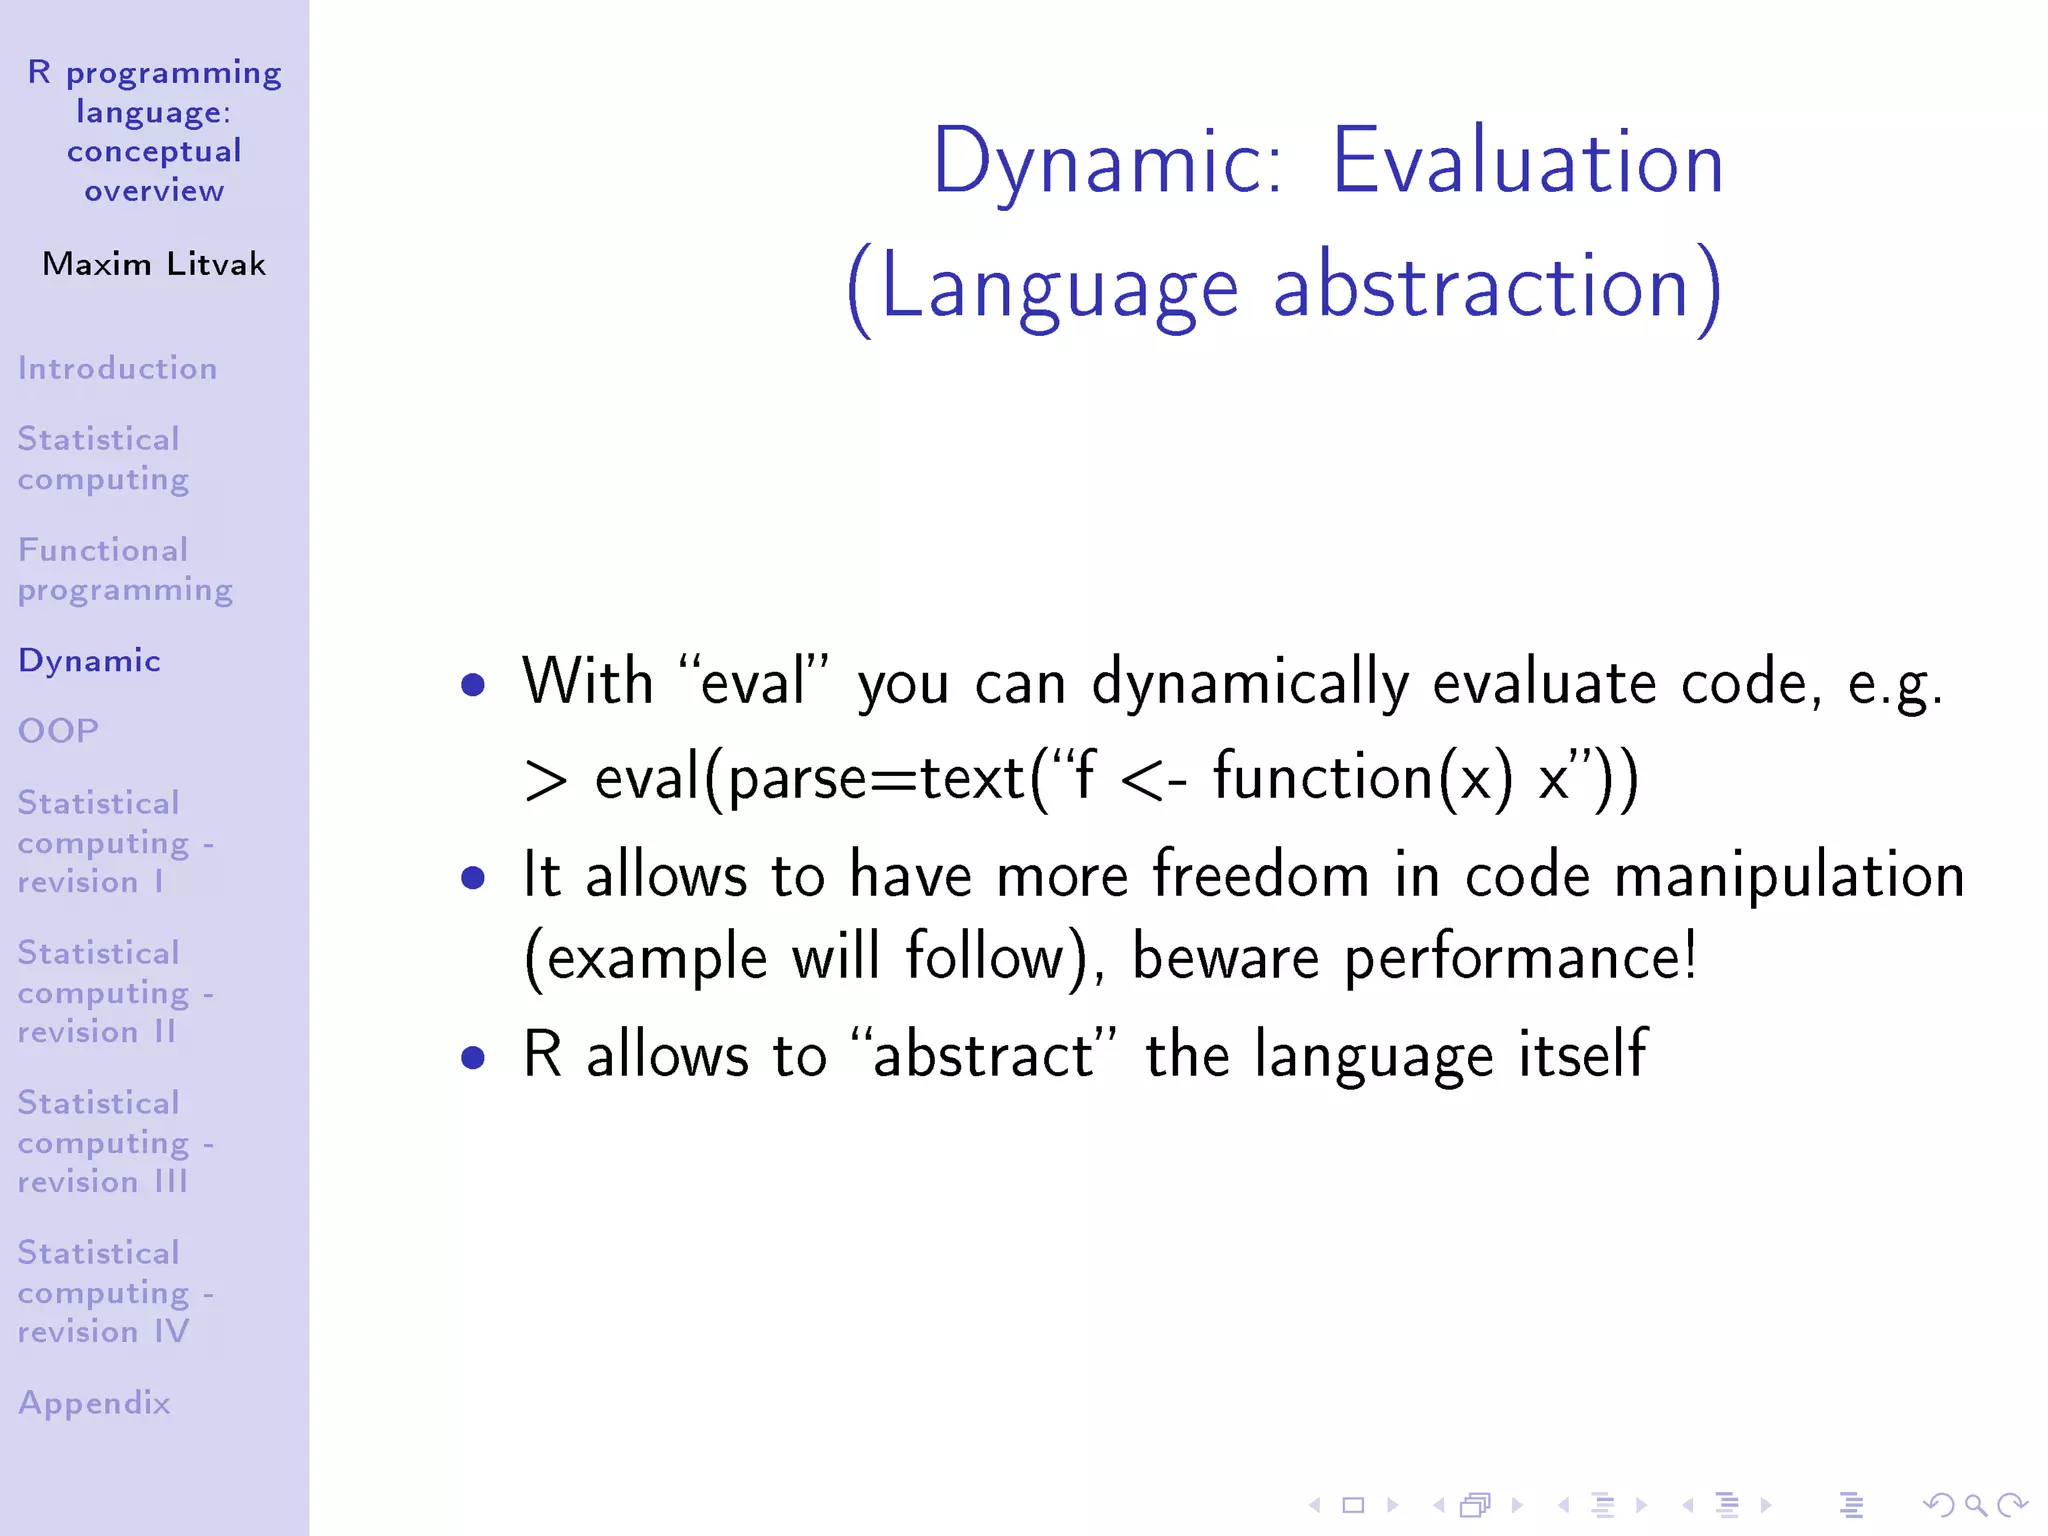
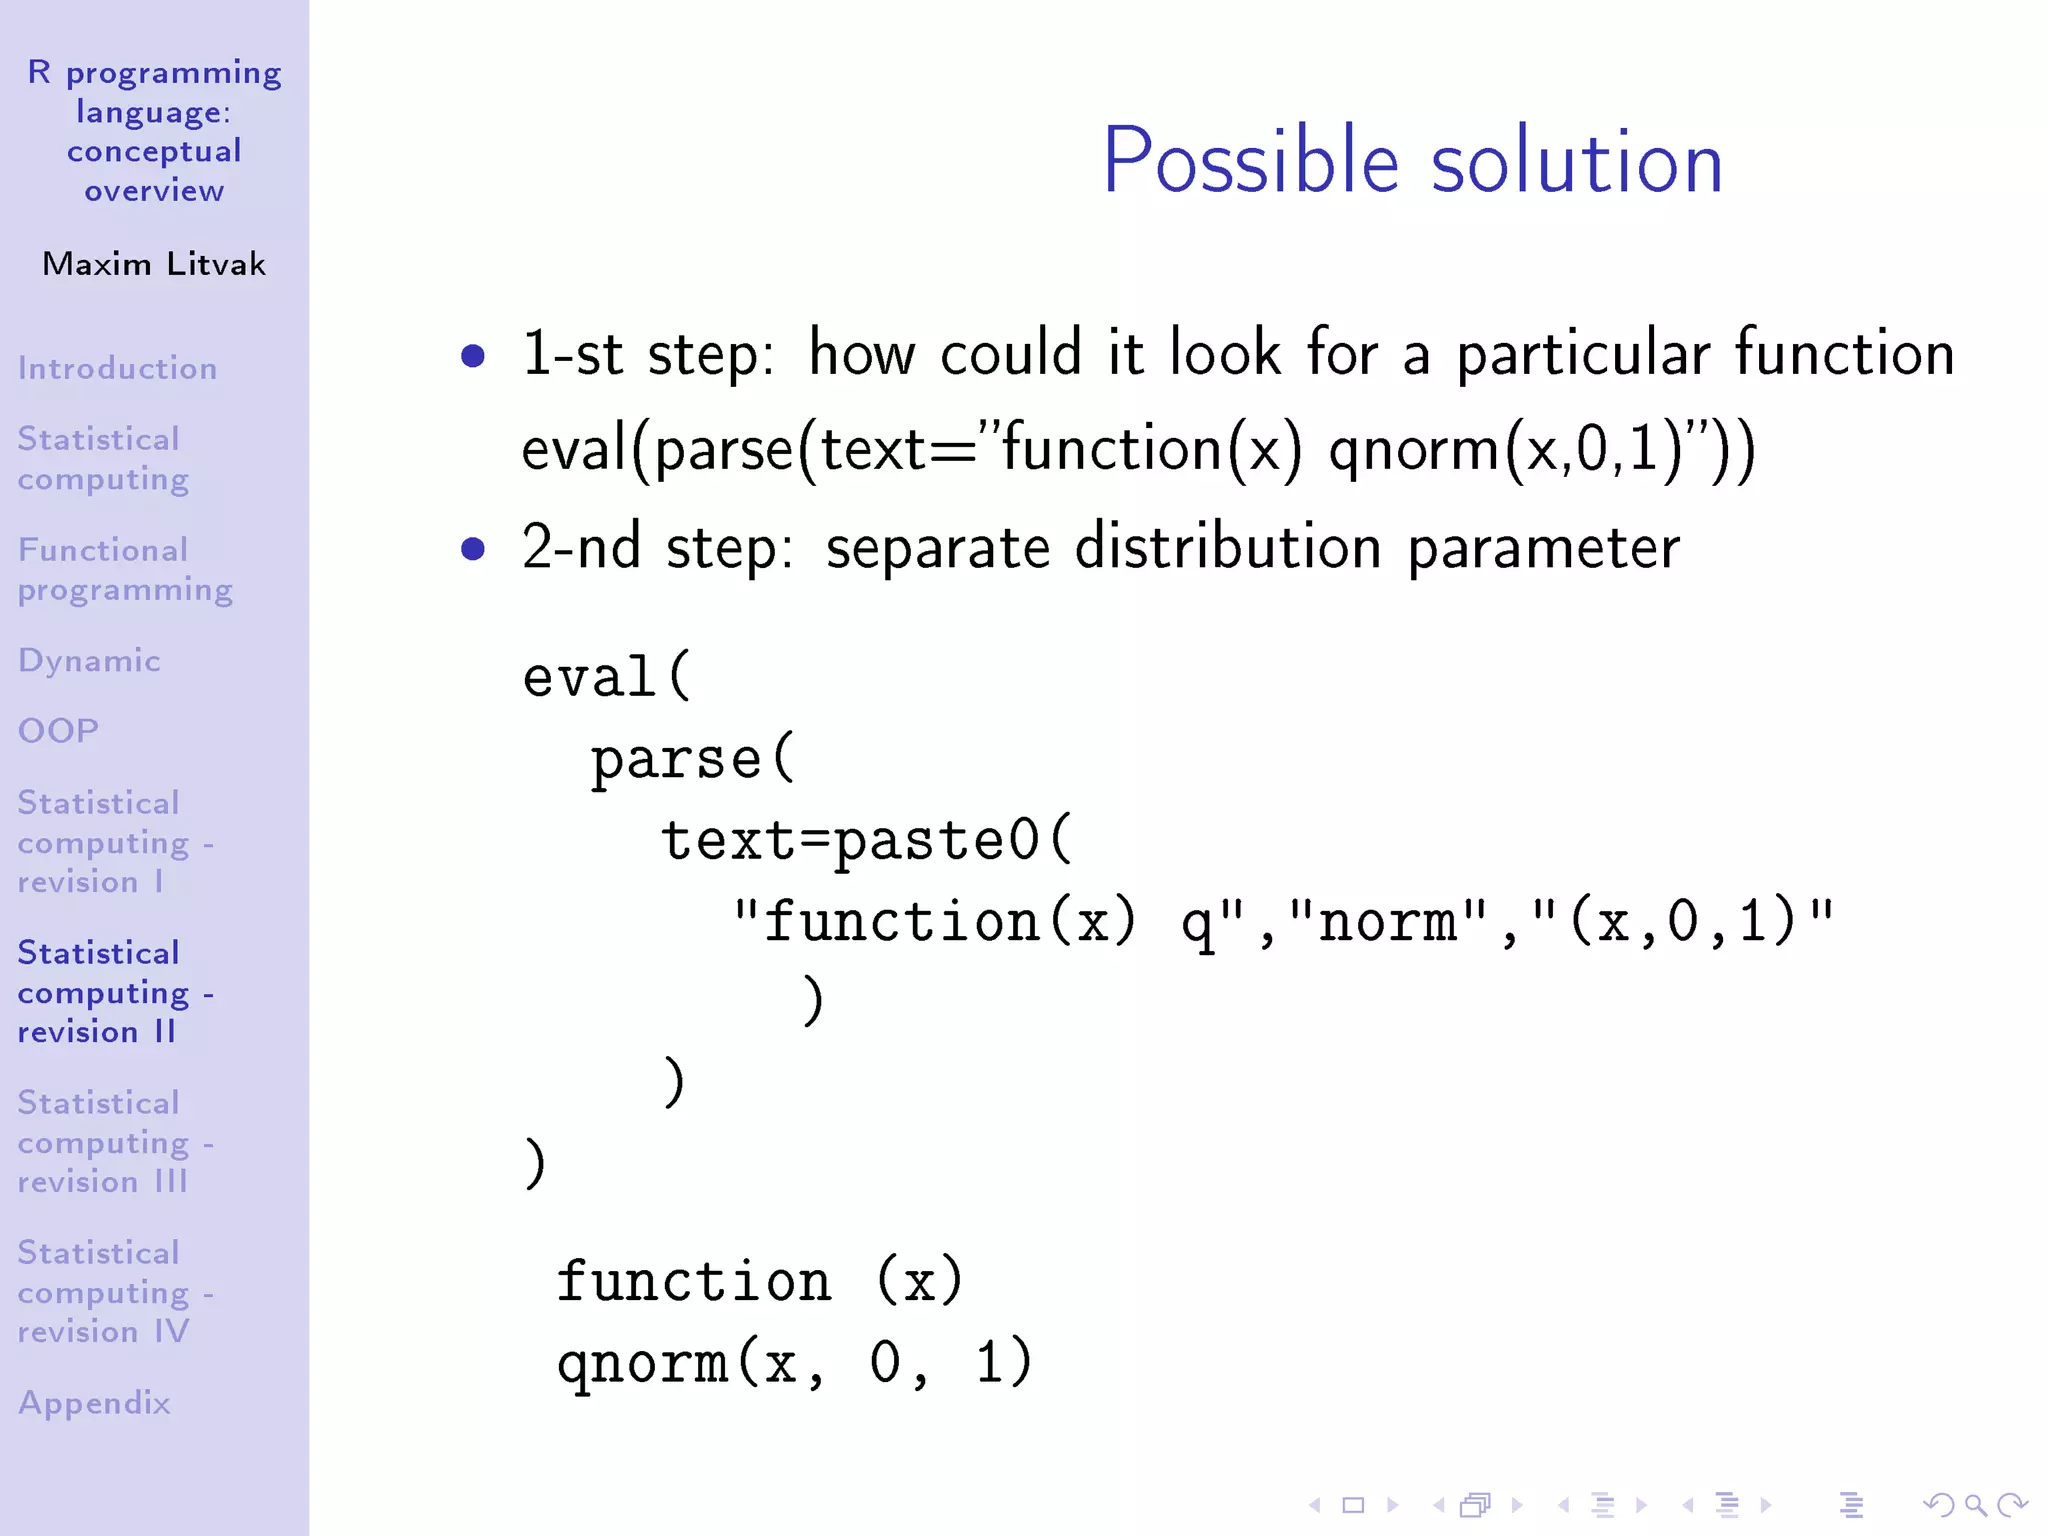
ˆ Example: given X (e.g. norm) distribution
ˆ pX is its probability function
ˆ dX is its density function
ˆ qX is its quantile function
ˆ How to abstract X?
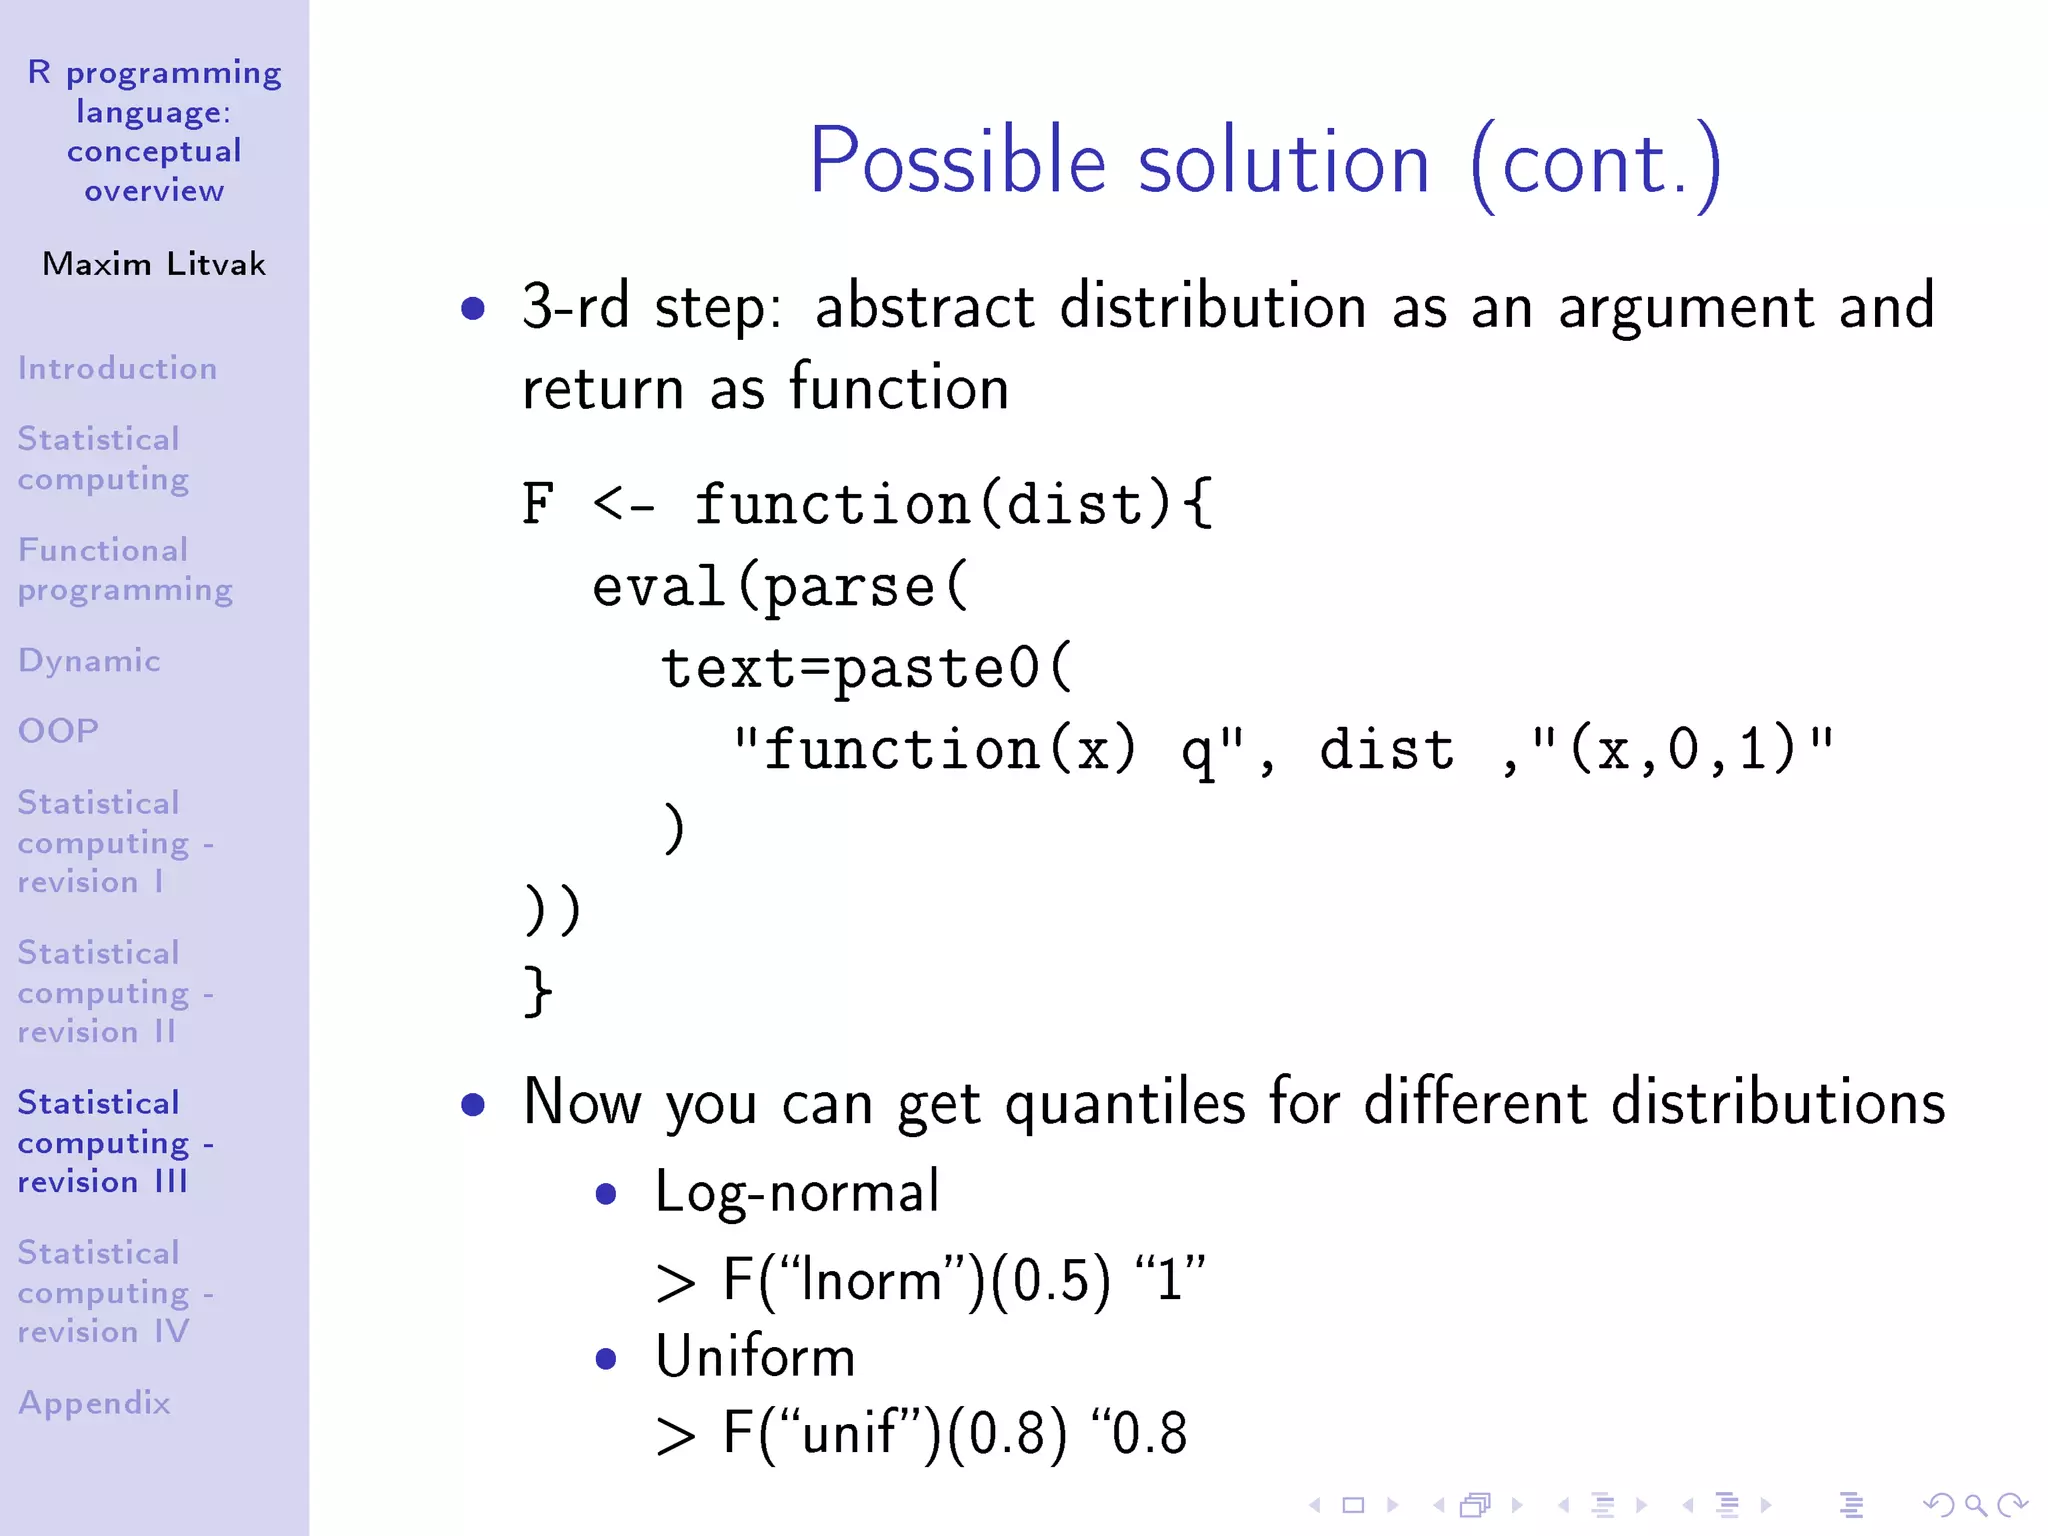
ˆ Construct a function that takes name of the
distribution with 2 parameters as an argument (e.g.
norm, unif) and returns its quantile function
parametrized with [0;1] (hint: use eval)](https://image.slidesharecdn.com/r-workshop-general-overview-160711203525/75/R-programming-language-conceptual-overview-26-2048.jpg)


![R basics for MBA Students[1].pptx](https://cdn.slidesharecdn.com/ss_thumbnails/rbasicsformbastudents1-240213044033-aee3b8d3-thumbnail.jpg?width=640&height=640&fit=bounds)