Monitoring your
Infrastructure using Open
Source ToolsSource Tools
by Greg Greenlee
greg@blacksintechnology:~$ whoami
● Founder of Blacks In Technology
organization
● Systems Engineer● Systems Engineer
● FOSS lover
● Avid comic book reader (Marvel)
● Father
● Husband
What is Open Source Software?
● Source code is openly shared
● Licensed to allow freedom to modify, copy,● Licensed to allow freedom to modify, copy,
study
Why Open Source?
● Pros
o Free (as in beer) and sometimes not
o code open to modification
o vulns are detected and fixed quickero vulns are detected and fixed quicker
o entire community working on it (depends on
popularity)
● Cons
o documentation sometimes lacks
o may prove difficult to implement
Why monitor?
● You want to know when something goes wrong
● Insight into your environment
o proactive
● Business needs● Business needs
o analytics
o trending data
● Event correlation
Tools to monitor your infrastructure
● Nagios (monitoring and alerting)
● ELK Stack (log aggregation, search and analysis)
o ElasticSearch (search engine based on Lucene)
Logstasho Logstash (log aggregator and manipulator)
o Kibana (front end)
● Cacti (data graphing)
● NagVis (visualization)
● nTopNG (protocol analyzer)
Nagios
● Created by Ethan Galstad (1999) - originally called NetSaint
● http://www.nagios.org
● http://www.nagios.org/download
● Very customizable
● Nagios XI
o standard and enterprise edition (http://www.nagios.com/products/nagiosxi/edition-comparison)
o aids in large scale configuration, reporting
o includes support services (http://www.nagios.com/products/nagiosxi/pricing)
● Nagios core
o free
o can purchase support
What does Nagios do?
Monitors and alerts
What can Nagios monitor?
1. Applications
2. Network services (smtp, http, dns, ssh….)
3. Hosts
4. Host resources (disk, cpu, memory, processes)4. Host resources (disk, cpu, memory, processes)
5. Web sites
6. Sensors (temperature, humidity, power consumption..)
7. Just about anything you can write a script for!!!
How does Nagios monitor?
● Local plugins
o network services are running
● Remote plugins (NRPE NSClient++)
o disk utilizationo disk utilization
o memory utilization
o cpu utiliziation
● Custom Scripts (Perl, Python, Bash, etc.)
● More plugins and nagios goodness
o http://exchange.nagios.org/#/
How does it work?
Uses a host to service relationship
● Hosts (switch, router, server, sensors)
● Service (http, dns, temperature, ping, ftp)
Uses traffic light system to indicate stateUses traffic light system to indicate state
● Red - critical
● Yellow - warning
● Green - ok
How does it work cont’d
Makes use of configuration files
● templates
● hosts and host groups● hosts and host groups
● services and services groups
● contacts and contact groups
● notifications
● escalations
Host and service config file
# Host definition
define host{
use generic-host ; Name of host template to
use
host_name domain-
server-1
alias Name
Server
address x.x.x.x
check_command check-host-
alive
hostgroups fakegroup
# Service definition
define service{
use generic-service ; Name of service template to
use
host_name domain-server-1
service_description DNS
is_volatile
0
check_period 24x7
max_check_attempts 3
normal_check_interval 1
retry_check_interval 1
# 'check_dns' command definition
define command{
command_name check_dns
command_line $USER1$/check_dns
-H www.profitability.net -s $HOSTADDRESS$
}
hostgroups fakegroup
contact_groups novell-
admins
max_check_attempts 10
notification_interval 30
notification_period 24x7
notification_options d,u,r
parents internalswitch-4-3-7-1
}
retry_check_interval 1
contact_groups novell-admins
notification_interval 30
notification_period 24x7
notification_options w,u,c,r,f,s
check_command check_dns
}
How does it look?
ping check
ping check
● service check
○ http
○ ftp
How do I get alerts?
email
text
IMIM
Nagios demoNagios demo
ELK Stack (log aggregation and analysis)
● Elasticsearch (Apache Lucene search engine)
● Logstash (collects and parses logs)● Logstash
● Kibana (front end gui allows you to visualize data)
Why do we need centralized log server?
● Easy to find stuff
● Everything has logs
o operating systemso operating systems
o applications
o devices
● Correlation of events
● Insight into environment
Elasticsearch
● http://www.elasticsearch.org/
● based on Apache Lucene
● indexes data
● full text search
● distributed (scales out)
● highly available (can build clusters)
● schema free (tries to structure data)
● real time data
Elasticsearch DemoElasticsearch Demo
look at Elasticsearch Head
Logstash
Created by Jordan Sissel
Allows you to ingest data from anywhere (input)Allows you to ingest data from anywhere (input)
Centralizes and parses log data (filter)
Display data (output)
logstash
● input
o syslog
o file
o tcp
o udp
o eventlog
o twitter
o irco irc
● filter (modifies)
o grok (parses unstructured data)
o mutate (mutates your events such as renaming, replacing, modifying fields)
● output
o csv
o email
o file
o elasticsearch
o http
flow of data
input
(tcp, syslog, file)
filter
(grok, mutate)
output
(stdout,
elasticsearch)
Logstash format
input {
tcp {
port => 5000
type => syslog
}
udp {
port => 5000
type => syslog
}
}
filter {
if [type] == "syslog" {if [type] == "syslog" {
grok {
match => { "message" => "%{SYSLOGTIMESTAMP:syslog_timestamp} %{SYSLOGHOST:syslog_hostname} %{DATA:syslog_program}(?:[%{POSINT:syslog_pid}])?:
%{GREEDYDATA:syslog_message}" }
add_field => [ "received_at", "%{@timestamp}" ]
add_field => [ "received_from", "%{host}" ]
}
syslog_pri { }
date {
match => [ "syslog_timestamp", "MMM d HH:mm:ss", "MMM dd HH:mm:ss" ]
}
}
}
output {
elasticsearch { host => localhost }
stdout { codec => rubydebug }
}
Kibana
● visualization tool
● interact with your data in real time● interact with your data in real time
● drill down and view only data you want
● make sense of your data
o bar or line graphs, maps and pie charts
ELK stack demoELK stack demo
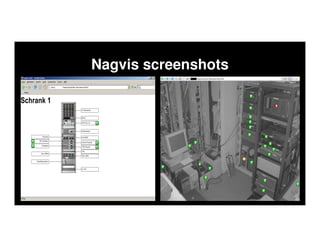
NagVis
● http://www.nagvis.org/
● Nagios add on visualisation tool
o allows you to visualize Nagios data
● Allows you to create maps of your IT environment● Allows you to create maps of your IT environment
● Allows you to visualize work flows and processes
● create graphic out of performance data
o disk usage
o cpu usage
Nagvis screenshots
Nagvis demoNagvis demo
Cacti
● http://www.cacti.net/
● front end for RRDTool (Round Robin Database)
o records data in intervals
o graphs data pointso graphs data points
● Useful for seeing data trends
o bandwidth
o power consumption
o cpu usage
o memory usage
Cacti demoCacti demo
nTOPng
http://www.ntop.org/
Network traffic probe and analyzer
Based on original ntop
Supported platforms (Windows and Unix)
● Sort network traffic according to many protocols
● Show network traffic and IPv4/v6 active hosts
● Store on disk persistent traffic statistics in RRD format
● Geolocate hosts
● Analyse IP traffic and sort it according to the source/destination
● Display IP Traffic Subnet matrix (who’s talking to who?)
● Report IP protocol usage sorted by protocol type
● Act as a NetFlow/sFlow collector for flows generated by routers (e.g. Cisco and Juniper) or switches (e.g.
Foundry Networks) when used together with nProbe.
● Produce HTML5/AJAX network traffic statistics
What can you do with nTOPng?
● Network troubleshooting
● Drill down into traffic flows
o source and destination ip address
o source and destination porto source and destination port
o bandwidth
o protocol
o application
nTOPng screen shotsnTOPng screen shots
nTopNG set up
Thank you!!!
email: greg@blacksintechnology.net
twitter: @blkintechnology
facebook: http://www.facebook.com/blacksintechnology
website: http://www.blacksintechnology.netwebsite: http://www.blacksintechnology.net
LinkedIn: Blacks In Technology
????????????

Handout: 'Open Source Tools & Resources'

  • 1.
    Monitoring your Infrastructure usingOpen Source ToolsSource Tools by Greg Greenlee
  • 2.
    greg@blacksintechnology:~$ whoami ● Founderof Blacks In Technology organization ● Systems Engineer● Systems Engineer ● FOSS lover ● Avid comic book reader (Marvel) ● Father ● Husband
  • 3.
    What is OpenSource Software? ● Source code is openly shared ● Licensed to allow freedom to modify, copy,● Licensed to allow freedom to modify, copy, study
  • 4.
    Why Open Source? ●Pros o Free (as in beer) and sometimes not o code open to modification o vulns are detected and fixed quickero vulns are detected and fixed quicker o entire community working on it (depends on popularity) ● Cons o documentation sometimes lacks o may prove difficult to implement
  • 5.
    Why monitor? ● Youwant to know when something goes wrong ● Insight into your environment o proactive ● Business needs● Business needs o analytics o trending data ● Event correlation
  • 6.
    Tools to monitoryour infrastructure ● Nagios (monitoring and alerting) ● ELK Stack (log aggregation, search and analysis) o ElasticSearch (search engine based on Lucene) Logstasho Logstash (log aggregator and manipulator) o Kibana (front end) ● Cacti (data graphing) ● NagVis (visualization) ● nTopNG (protocol analyzer)
  • 7.
    Nagios ● Created byEthan Galstad (1999) - originally called NetSaint ● http://www.nagios.org ● http://www.nagios.org/download ● Very customizable ● Nagios XI o standard and enterprise edition (http://www.nagios.com/products/nagiosxi/edition-comparison) o aids in large scale configuration, reporting o includes support services (http://www.nagios.com/products/nagiosxi/pricing) ● Nagios core o free o can purchase support
  • 8.
    What does Nagiosdo? Monitors and alerts
  • 9.
    What can Nagiosmonitor? 1. Applications 2. Network services (smtp, http, dns, ssh….) 3. Hosts 4. Host resources (disk, cpu, memory, processes)4. Host resources (disk, cpu, memory, processes) 5. Web sites 6. Sensors (temperature, humidity, power consumption..) 7. Just about anything you can write a script for!!!
  • 10.
    How does Nagiosmonitor? ● Local plugins o network services are running ● Remote plugins (NRPE NSClient++) o disk utilizationo disk utilization o memory utilization o cpu utiliziation ● Custom Scripts (Perl, Python, Bash, etc.) ● More plugins and nagios goodness o http://exchange.nagios.org/#/
  • 11.
    How does itwork? Uses a host to service relationship ● Hosts (switch, router, server, sensors) ● Service (http, dns, temperature, ping, ftp) Uses traffic light system to indicate stateUses traffic light system to indicate state ● Red - critical ● Yellow - warning ● Green - ok
  • 12.
    How does itwork cont’d Makes use of configuration files ● templates ● hosts and host groups● hosts and host groups ● services and services groups ● contacts and contact groups ● notifications ● escalations
  • 13.
    Host and serviceconfig file # Host definition define host{ use generic-host ; Name of host template to use host_name domain- server-1 alias Name Server address x.x.x.x check_command check-host- alive hostgroups fakegroup # Service definition define service{ use generic-service ; Name of service template to use host_name domain-server-1 service_description DNS is_volatile 0 check_period 24x7 max_check_attempts 3 normal_check_interval 1 retry_check_interval 1 # 'check_dns' command definition define command{ command_name check_dns command_line $USER1$/check_dns -H www.profitability.net -s $HOSTADDRESS$ } hostgroups fakegroup contact_groups novell- admins max_check_attempts 10 notification_interval 30 notification_period 24x7 notification_options d,u,r parents internalswitch-4-3-7-1 } retry_check_interval 1 contact_groups novell-admins notification_interval 30 notification_period 24x7 notification_options w,u,c,r,f,s check_command check_dns }
  • 14.
    How does itlook? ping check ping check ● service check ○ http ○ ftp
  • 15.
    How do Iget alerts? email text IMIM
  • 16.
  • 17.
    ELK Stack (logaggregation and analysis) ● Elasticsearch (Apache Lucene search engine) ● Logstash (collects and parses logs)● Logstash ● Kibana (front end gui allows you to visualize data)
  • 18.
    Why do weneed centralized log server? ● Easy to find stuff ● Everything has logs o operating systemso operating systems o applications o devices ● Correlation of events ● Insight into environment
  • 19.
    Elasticsearch ● http://www.elasticsearch.org/ ● basedon Apache Lucene ● indexes data ● full text search ● distributed (scales out) ● highly available (can build clusters) ● schema free (tries to structure data) ● real time data
  • 20.
  • 21.
    Logstash Created by JordanSissel Allows you to ingest data from anywhere (input)Allows you to ingest data from anywhere (input) Centralizes and parses log data (filter) Display data (output)
  • 22.
    logstash ● input o syslog ofile o tcp o udp o eventlog o twitter o irco irc ● filter (modifies) o grok (parses unstructured data) o mutate (mutates your events such as renaming, replacing, modifying fields) ● output o csv o email o file o elasticsearch o http
  • 23.
    flow of data input (tcp,syslog, file) filter (grok, mutate) output (stdout, elasticsearch)
  • 24.
    Logstash format input { tcp{ port => 5000 type => syslog } udp { port => 5000 type => syslog } } filter { if [type] == "syslog" {if [type] == "syslog" { grok { match => { "message" => "%{SYSLOGTIMESTAMP:syslog_timestamp} %{SYSLOGHOST:syslog_hostname} %{DATA:syslog_program}(?:[%{POSINT:syslog_pid}])?: %{GREEDYDATA:syslog_message}" } add_field => [ "received_at", "%{@timestamp}" ] add_field => [ "received_from", "%{host}" ] } syslog_pri { } date { match => [ "syslog_timestamp", "MMM d HH:mm:ss", "MMM dd HH:mm:ss" ] } } } output { elasticsearch { host => localhost } stdout { codec => rubydebug } }
  • 25.
    Kibana ● visualization tool ●interact with your data in real time● interact with your data in real time ● drill down and view only data you want ● make sense of your data o bar or line graphs, maps and pie charts
  • 26.
  • 27.
    NagVis ● http://www.nagvis.org/ ● Nagiosadd on visualisation tool o allows you to visualize Nagios data ● Allows you to create maps of your IT environment● Allows you to create maps of your IT environment ● Allows you to visualize work flows and processes ● create graphic out of performance data o disk usage o cpu usage
  • 28.
  • 29.
  • 30.
    Cacti ● http://www.cacti.net/ ● frontend for RRDTool (Round Robin Database) o records data in intervals o graphs data pointso graphs data points ● Useful for seeing data trends o bandwidth o power consumption o cpu usage o memory usage
  • 31.
  • 34.
    nTOPng http://www.ntop.org/ Network traffic probeand analyzer Based on original ntop Supported platforms (Windows and Unix) ● Sort network traffic according to many protocols ● Show network traffic and IPv4/v6 active hosts ● Store on disk persistent traffic statistics in RRD format ● Geolocate hosts ● Analyse IP traffic and sort it according to the source/destination ● Display IP Traffic Subnet matrix (who’s talking to who?) ● Report IP protocol usage sorted by protocol type ● Act as a NetFlow/sFlow collector for flows generated by routers (e.g. Cisco and Juniper) or switches (e.g. Foundry Networks) when used together with nProbe. ● Produce HTML5/AJAX network traffic statistics
  • 35.
    What can youdo with nTOPng? ● Network troubleshooting ● Drill down into traffic flows o source and destination ip address o source and destination porto source and destination port o bandwidth o protocol o application
  • 36.
  • 37.
  • 41.
    Thank you!!! email: greg@blacksintechnology.net twitter:@blkintechnology facebook: http://www.facebook.com/blacksintechnology website: http://www.blacksintechnology.netwebsite: http://www.blacksintechnology.net LinkedIn: Blacks In Technology
  • 42.