


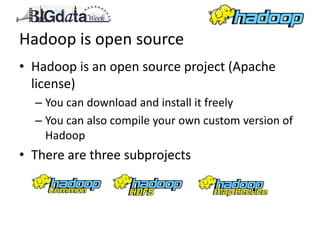


![A Java example (Mapper)
public class exampleMapper
extends MapReduceBase
implements Mapper<LongWritable, Text, Text, Text> {
public void map(LongWritable key, Text value,
OutputCollector<Text, Text> output,
Reporter reporter) throws IOException {
String line = value.toString();
String[] values = line.split(",");
Long timeStampLong = Long.parseLong(values[0]);
DateTime timeStamp = new DateTime(timeStampLong);
DateTimeFormatter dateFormat =
ISODateTimeFormat.date();
output.collect(new
Text(dateFormat.print(timeStamp)),
new Text(line));
}
}](https://image.slidesharecdn.com/bigdataweekpres-120523234002-phpapp01/85/Big-data-week-presentation-21-320.jpg)
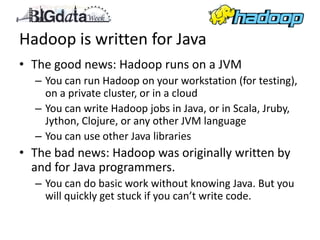
![A Java example (job file)
public class exampleJob extends Configured implements Tool {
@Override
public int run(String[] arg0) throws Exception {
// TODO Auto-generated method stub
JobConf conf = new JobConf(getConf(), getClass());
conf.setJobName("Count events by date");
conf.setInputFormat(TextInputFormat.class);
TextInputFormat.addInputPath(conf, new Path(arg0[0]));
conf.setOutputFormat(TextOutputFormat.class);
conf.setOutputKeyClass(Text.class);
conf.setOutputValueClass(LongWritable.class);
TextOutputFormat.setOutputPath(conf, new Path(arg0[1]));
conf.setMapperClass(exampleMapper.class);
conf.setReducerClass(exampleReducer.class);
JobClient.runJob(conf);
return 0;
}
}](https://image.slidesharecdn.com/bigdataweekpres-120523234002-phpapp01/85/Big-data-week-presentation-23-320.jpg)


This document provides an overview of Apache Hadoop, including what it is, how it works using MapReduce, and when it may be a good solution. Hadoop is an open-source framework for distributed storage and processing of large datasets across clusters of commodity servers. It allows for the parallel processing of large datasets in a reliable, fault-tolerant manner. The document discusses how Hadoop is used by many large companies, how it works based on the MapReduce paradigm, and recommends Hadoop for problems involving big data that can be modeled with MapReduce.