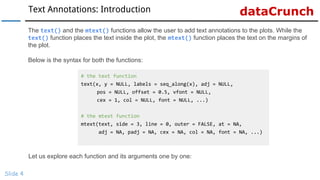
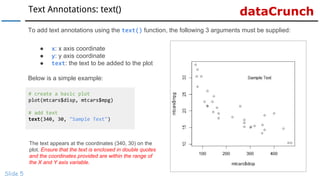
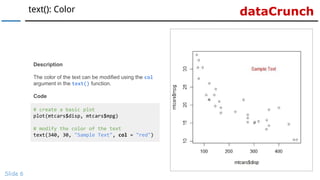
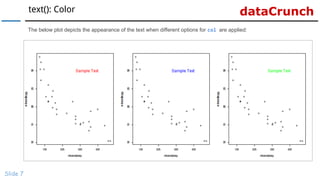
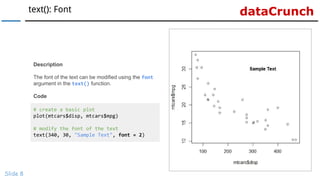
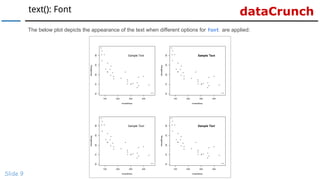
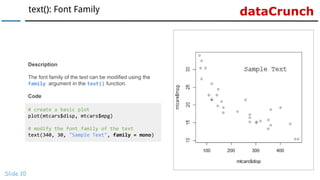
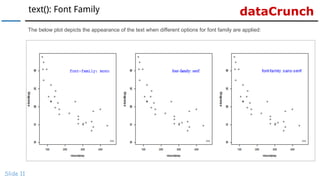
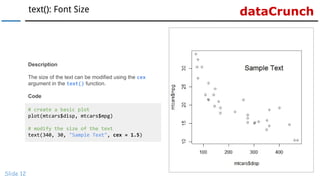
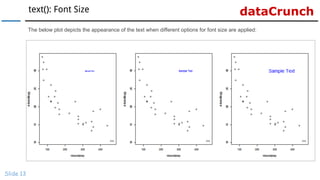
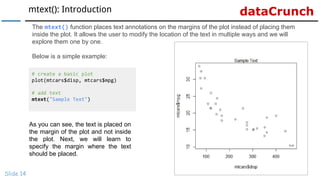
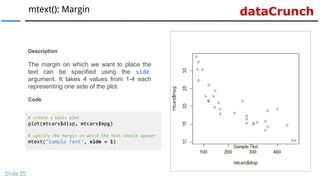
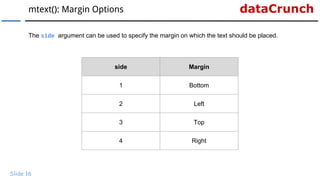
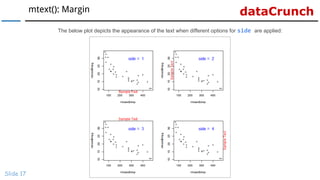
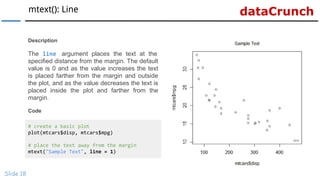
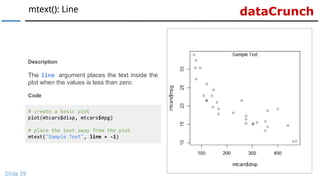
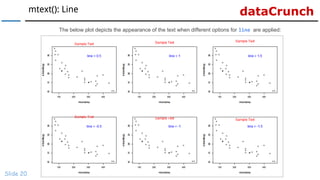
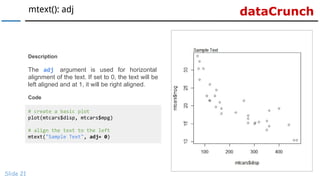
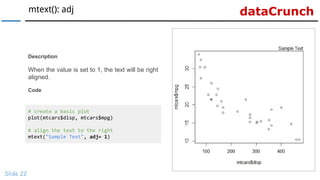
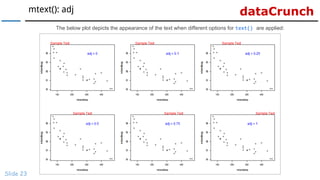
www.r-squared.in/git-hub
dataCrunch Data Visualization With R
Learn To Add Text Annotations To Plots
dataCrunch
Text Annotations
Slide 2
dataCrunchText Annotations: Objectives
Slide 3
In this section, we will learn to:
Add text annotations to the plots using
● text() function
● mtext() function
dataCrunchText Annotations: Introduction
Slide 4
The text() and the mtext() functions allow the user to add text annotations to the plots. While the
text() function places the text inside the plot, the mtext() function places the text on the margins of
the plot.
Below is the syntax for both the functions:
# the text function
text(x, y = NULL, labels = seq_along(x), adj = NULL,
pos = NULL, offset = 0.5, vfont = NULL,
cex = 1, col = NULL, font = NULL, ...)
# the mtext function
mtext(text, side = 3, line = 0, outer = FALSE, at = NA,
adj = NA, padj = NA, cex = NA, col = NA, font = NA, ...)
Let us explore each function and its arguments one by one:
dataCrunchText Annotations: text()
Slide 5
To add text annotations using the text() function, the following 3 arguments must be supplied:
● x: x axis coordinate
● y: y axis coordinate
● text: the text to be added to the plot
Below is a simple example:
# create a basic plot
plot(mtcars$disp, mtcars$mpg)
# add text
text(340, 30, "Sample Text")
The text appears at the coordinates (340, 30) on the
plot. Ensure that the text is enclosed in double quotes
and the coordinates provided are within the range of
the X and Y axis variable.
dataCrunchtext(): Color
Slide 6
# create a basic plot
plot(mtcars$disp, mtcars$mpg)
# modify the color of the text
text(340, 30, "Sample Text", col = "red")
Description
The color of the text can be modified using the col
argument in the text() function.
Code
dataCrunchtext(): Color
Slide 7
The below plot depicts the appearance of the text when different options for col are applied:
dataCrunchtext(): Font
Slide 8
# create a basic plot
plot(mtcars$disp, mtcars$mpg)
# modify the font of the text
text(340, 30, "Sample Text", font = 2)
Description
The font of the text can be modified using the font
argument in the text() function.
Code
dataCrunchtext(): Font
Slide 9
The below plot depicts the appearance of the text when different options for font are applied:
dataCrunchtext(): Font Family
Slide 10
# create a basic plot
plot(mtcars$disp, mtcars$mpg)
# modify the font family of the text
text(340, 30, "Sample Text", family = mono)
Description
The font family of the text can be modified using the
family argument in the text() function.
Code
dataCrunchtext(): Font Family
Slide 11
The below plot depicts the appearance of the text when different options for font family are applied:
dataCrunchtext(): Font Size
Slide 12
# create a basic plot
plot(mtcars$disp, mtcars$mpg)
# modify the size of the text
text(340, 30, "Sample Text", cex = 1.5)
Description
The size of the text can be modified using the cex
argument in the text() function.
Code
dataCrunchtext(): Font Size
Slide 13
The below plot depicts the appearance of the text when different options for font size are applied:
dataCrunchmtext(): Introduction
Slide 14
The mtext() function places text annotations on the margins of the plot instead of placing them
inside the plot. It allows the user to modify the location of the text in multiple ways and we will
explore them one by one.
Below is a simple example:
# create a basic plot
plot(mtcars$disp, mtcars$mpg)
# add text
mtext("Sample Text")
As you can see, the text is placed on
the margin of the plot and not inside
the plot. Next, we will learn to
specify the margin where the text
should be placed.
dataCrunchmtext(): Margin
Slide 15
# create a basic plot
plot(mtcars$disp, mtcars$mpg)
# specify the margin on which the text should appear
mtext("Sample Text", side = 1)
Description
The margin on which we want to place the
text can be specified using the side
argument. It takes 4 values from 1-4 each
representing one side of the plot.
Code
dataCrunchmtext(): Margin Options
Slide 16
The side argument can be used to specify the margin on which the text should be placed.
side Margin
1 Bottom
2 Left
3 Top
4 Right
dataCrunchmtext(): Margin
Slide 17
The below plot depicts the appearance of the text when different options for side are applied:
dataCrunchmtext(): Line
Slide 18
# create a basic plot
plot(mtcars$disp, mtcars$mpg)
# place the text away from the margin
mtext("Sample Text", line = 1)
Description
The line argument places the text at the
specified distance from the margin. The default
value is 0 and as the value increases the text
is placed farther from the margin and outside
the plot, and as the value decreases the text is
placed inside the plot and farther from the
margin.
Code
dataCrunchmtext(): Line
Slide 19
# create a basic plot
plot(mtcars$disp, mtcars$mpg)
# place the text away from the plot
mtext("Sample Text", line = -1)
Description
The line argument places the text inside the
plot when the values is less than zero.
Code
dataCrunchmtext(): Line
Slide 20
The below plot depicts the appearance of the text when different options for line are applied:
dataCrunchmtext(): adj
Slide 21
# create a basic plot
plot(mtcars$disp, mtcars$mpg)
# align the text to the left
mtext("Sample Text", adj= 0)
Description
The adj argument is used for horizontal
alignment of the text. If set to 0, the text will be
left aligned and at 1, it will be right aligned.
Code
dataCrunchmtext(): adj
Slide 22
# create a basic plot
plot(mtcars$disp, mtcars$mpg)
# align the text to the right
mtext("Sample Text", adj= 1)
Description
When the value is set to 1, the text will be right
aligned.
Code
dataCrunchmtext(): adj
Slide 23
The below plot depicts the appearance of the text when different options for text() are applied:
dataCrunch
Slide 24
Visit dataCrunch for
tutorials on:
→ R Programming
→ Business Analytics
→ Data Visualization
→ Web Applications
→ Package Development
→ Git & GitHub

R Data Visualization: Learn To Add Text Annotations To Plots

  • 1.
    www.r-squared.in/git-hub dataCrunch Data VisualizationWith R Learn To Add Text Annotations To Plots
  • 2.
  • 3.
    dataCrunchText Annotations: Objectives Slide3 In this section, we will learn to: Add text annotations to the plots using ● text() function ● mtext() function
  • 4.
    dataCrunchText Annotations: Introduction Slide4 The text() and the mtext() functions allow the user to add text annotations to the plots. While the text() function places the text inside the plot, the mtext() function places the text on the margins of the plot. Below is the syntax for both the functions: # the text function text(x, y = NULL, labels = seq_along(x), adj = NULL, pos = NULL, offset = 0.5, vfont = NULL, cex = 1, col = NULL, font = NULL, ...) # the mtext function mtext(text, side = 3, line = 0, outer = FALSE, at = NA, adj = NA, padj = NA, cex = NA, col = NA, font = NA, ...) Let us explore each function and its arguments one by one:
  • 5.
    dataCrunchText Annotations: text() Slide5 To add text annotations using the text() function, the following 3 arguments must be supplied: ● x: x axis coordinate ● y: y axis coordinate ● text: the text to be added to the plot Below is a simple example: # create a basic plot plot(mtcars$disp, mtcars$mpg) # add text text(340, 30, "Sample Text") The text appears at the coordinates (340, 30) on the plot. Ensure that the text is enclosed in double quotes and the coordinates provided are within the range of the X and Y axis variable.
  • 6.
    dataCrunchtext(): Color Slide 6 #create a basic plot plot(mtcars$disp, mtcars$mpg) # modify the color of the text text(340, 30, "Sample Text", col = "red") Description The color of the text can be modified using the col argument in the text() function. Code
  • 7.
    dataCrunchtext(): Color Slide 7 Thebelow plot depicts the appearance of the text when different options for col are applied:
  • 8.
    dataCrunchtext(): Font Slide 8 #create a basic plot plot(mtcars$disp, mtcars$mpg) # modify the font of the text text(340, 30, "Sample Text", font = 2) Description The font of the text can be modified using the font argument in the text() function. Code
  • 9.
    dataCrunchtext(): Font Slide 9 Thebelow plot depicts the appearance of the text when different options for font are applied:
  • 10.
    dataCrunchtext(): Font Family Slide10 # create a basic plot plot(mtcars$disp, mtcars$mpg) # modify the font family of the text text(340, 30, "Sample Text", family = mono) Description The font family of the text can be modified using the family argument in the text() function. Code
  • 11.
    dataCrunchtext(): Font Family Slide11 The below plot depicts the appearance of the text when different options for font family are applied:
  • 12.
    dataCrunchtext(): Font Size Slide12 # create a basic plot plot(mtcars$disp, mtcars$mpg) # modify the size of the text text(340, 30, "Sample Text", cex = 1.5) Description The size of the text can be modified using the cex argument in the text() function. Code
  • 13.
    dataCrunchtext(): Font Size Slide13 The below plot depicts the appearance of the text when different options for font size are applied:
  • 14.
    dataCrunchmtext(): Introduction Slide 14 Themtext() function places text annotations on the margins of the plot instead of placing them inside the plot. It allows the user to modify the location of the text in multiple ways and we will explore them one by one. Below is a simple example: # create a basic plot plot(mtcars$disp, mtcars$mpg) # add text mtext("Sample Text") As you can see, the text is placed on the margin of the plot and not inside the plot. Next, we will learn to specify the margin where the text should be placed.
  • 15.
    dataCrunchmtext(): Margin Slide 15 #create a basic plot plot(mtcars$disp, mtcars$mpg) # specify the margin on which the text should appear mtext("Sample Text", side = 1) Description The margin on which we want to place the text can be specified using the side argument. It takes 4 values from 1-4 each representing one side of the plot. Code
  • 16.
    dataCrunchmtext(): Margin Options Slide16 The side argument can be used to specify the margin on which the text should be placed. side Margin 1 Bottom 2 Left 3 Top 4 Right
  • 17.
    dataCrunchmtext(): Margin Slide 17 Thebelow plot depicts the appearance of the text when different options for side are applied:
  • 18.
    dataCrunchmtext(): Line Slide 18 #create a basic plot plot(mtcars$disp, mtcars$mpg) # place the text away from the margin mtext("Sample Text", line = 1) Description The line argument places the text at the specified distance from the margin. The default value is 0 and as the value increases the text is placed farther from the margin and outside the plot, and as the value decreases the text is placed inside the plot and farther from the margin. Code
  • 19.
    dataCrunchmtext(): Line Slide 19 #create a basic plot plot(mtcars$disp, mtcars$mpg) # place the text away from the plot mtext("Sample Text", line = -1) Description The line argument places the text inside the plot when the values is less than zero. Code
  • 20.
    dataCrunchmtext(): Line Slide 20 Thebelow plot depicts the appearance of the text when different options for line are applied:
  • 21.
    dataCrunchmtext(): adj Slide 21 #create a basic plot plot(mtcars$disp, mtcars$mpg) # align the text to the left mtext("Sample Text", adj= 0) Description The adj argument is used for horizontal alignment of the text. If set to 0, the text will be left aligned and at 1, it will be right aligned. Code
  • 22.
    dataCrunchmtext(): adj Slide 22 #create a basic plot plot(mtcars$disp, mtcars$mpg) # align the text to the right mtext("Sample Text", adj= 1) Description When the value is set to 1, the text will be right aligned. Code
  • 23.
    dataCrunchmtext(): adj Slide 23 Thebelow plot depicts the appearance of the text when different options for text() are applied:
  • 24.
    dataCrunch Slide 24 Visit dataCrunchfor tutorials on: → R Programming → Business Analytics → Data Visualization → Web Applications → Package Development → Git & GitHub