Download to read offline

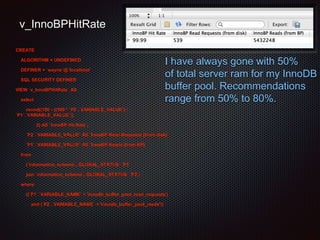
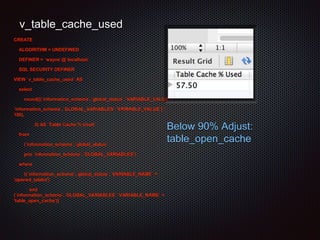
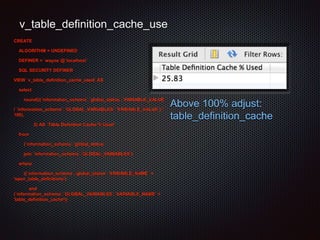
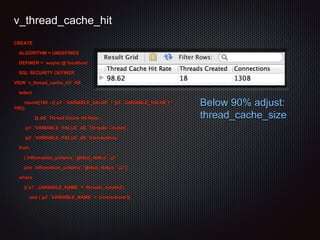
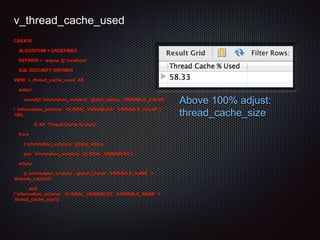
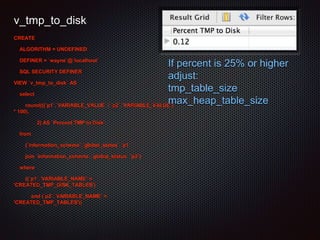
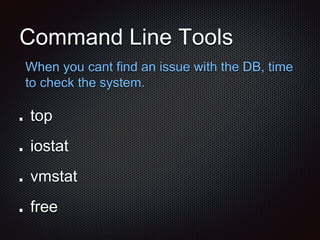


This document summarizes a MySQL Meetup that took place on September 8th, 2014. It includes the agenda for the meetup which involved registration, a speaker presentation on quick performance checks, and a networking session. The speaker Wayne Leutwyler presented on useful views for checking database performance and provided thresholds and recommendations for optimizing various MySQL variables if certain metrics were not within acceptable ranges. The document also briefly discussed some command line tools for system monitoring and ended by thanking the event sponsors.


![Hacking-Uncovered-How-People-Get-Hacked-and-How-to-Stay-Safe[1].pptx](https://cdn.slidesharecdn.com/ss_thumbnails/hacking-uncovered-how-people-get-hacked-and-how-to-stay-safe1-260130170011-4883a9c7-thumbnail.jpg?width=640&height=640&fit=bounds)


![제 23회 보아즈(BOAZ) 빅데이터 컨퍼런스 - [MBOAX] : ABSA를 활용한 소비자 반응 분석 기반 운영 효율화 대시보드 설계](https://cdn.slidesharecdn.com/ss_thumbnails/3-1boaz23rdconferencemboax-260203102709-9d519923-thumbnail.jpg?width=640&height=640&fit=bounds)
