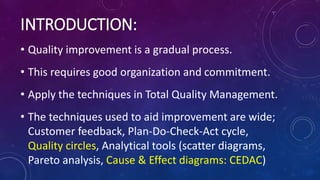
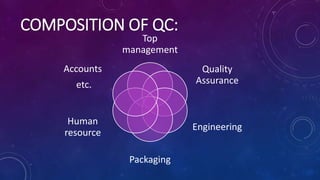
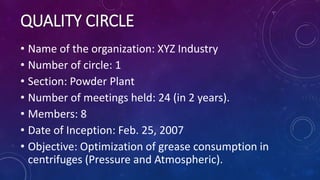
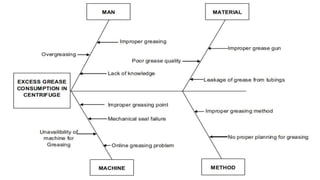
USING QUALITY CIRCLES AND
CEDAC TO IMPROVE QUALITY
IN THE FOOD PROCESSING
INDUSTRY
PRESENTED BY : EMMANUEL BERKO
(10386416)
• Quality improvement is a gradual process.
• This requires good organization and commitment.
• Apply the techniques in Total Quality Management.
• The techniques used to aid improvement are wide;
Customer feedback, Plan-Do-Check-Act cycle,
Quality circles, Analytical tools (scatter diagrams,
Pareto analysis, Cause & Effect diagrams: CEDAC)
INTRODUCTION:
inspired by Edwards Deming
(1900-1993)
• Quality circles (QC) are voluntary work groups.
• Consists of about 6-12 members.
• Meet to discuss how to improve the quality of
products and work processes.
• They are essentially problem-solving groups.
INTRODUCTION contd.
• QCs are formed occasionally to solve a problem that
is foreseen.
• It is not intended for an emergency solution.
• They work without being put under pressure and
are not time bound.
COMPOSITION OF QC:
Top
management
Quality
Assurance
Engineering
Packaging
Human
resource
Accounts
etc.
• Encourage positive change in attitude
• Get to learn additional skills
• Development of team spirit
• Aid in productivity improvement
• Build confidence of members
• Brings trust between members and management
PURPOSE OF QC
• It must be staffed entirely by volunteers.
• Each participant should be representative of different
departments.
• Problem to be addressed should be chosen by the
circle, not by management.
• Management must be supportive of the circle.
CHARACTERISTICS OF THE QC:
CHARACTERISTICS contd.:
• Circle members must have received appropriate training
in problem solving.
• The circle must choose its own leader from within its
own members.
Source: Basu et al. 2003
• Come up with number of problems.
• Decide on a particular problem to work on.
• Explanation among members the analysis to be done in
solving the problem.
• Obtaining a number of solutions to the problem.
STEPS TO PRODUCTIVITY IN A QC:
• Discussing and evaluating the best solution for the
problem.
• Preparing a plan of action.
• Implementing the plan and solution when
approved.
Source: (Welekar & Kulkarni, 2013)
STEPS contd.:
• Brain storming
• PDCA (Plan Do Check Act)
TECHNIQUES FOR PROBLEM SOLVING:
TECHNIQUES contd.:
• Data Collection and Analysis
CEDAC
• CEDAC (Cause and Effect Diagram with the Addition
of Cards)
• It is a very specific way of building a fishbone
diagram (developed by Ishikawa).
• Team members contribute ideas written on sticky
notes or Post-it notes.
INTRODUCTION
• In the operations of a quality circle, CEDAC can be
used as a tool to aid in solving a problem.
INTRODUCTION contd.
• Effect (Head)
• Causes (Main branches)
• Specific causes (Subcategories)
COMPONENTS OF THE DIAGRAM:
Causes (Main Branches)
Manufacturing industries;
Machines, Methods, Environment, Materials,
Measurement, Manpower
Administrative;
People, Process, Policy, Plant, Programs and
Products
COMPONENTS contd.:
Areas where this can be applied are:
– Customer complaints
– Design problems
– Rework
– Poor communications
– Setup problems
– Downtime problems etc.
APPLICATION OF CEDAC:
Source: (Performance Technology Group Inc., 2003)
• Define the problem – specific and clear
• Assess information needs – data, research, SOPs etc.
• Plan fish bone diagram – stating the main categories, use
of sticky notes (CEDAC), white board etc.
• Gather information – act upon obtaining the required
info.
PROCEDURE TO DEVELOPING A CE DIAGRAM :
• Develop the CE diagram – Brain storming and putting
down the ideas.
• Review the Diagram – Remove non-causes.
• Act on the findings – Seek approval before solutions are
implemented.
PROCEDURE contd.:
INDUSTRIAL APPLICATION
This fishbone diagram was drawn by a manufacturing
team to try to understand the source of periodic iron
contamination.
Source: (Nancy R., 2005)
In a powder plant, consumption pattern of grease in
centrifuges was not uniform. To optimize the grease
consumption, a quality circle was formed and root-cause
of the non-uniform grease consumption was identified,
and recommendations were implemented to optimize
the consumption.
Source: (Prasanna & Desai, 2011)
CASE STUDY OF QUALITY CIRCLE & CEDAC
QUALITY CIRCLE
• Name of the organization: XYZ Industry
• Number of circle: 1
• Section: Powder Plant
• Number of meetings held: 24 (in 2 years).
• Members: 8
• Date of Inception: Feb. 25, 2007
• Objective: Optimization of grease consumption in
centrifuges (Pressure and Atmospheric).
• To develop proper greasing method.
• To develop proper greasing schedule as per vendor
recommendation.
• Grease leak to be eliminated from trunnion seal ‘O’ rings.
• To review design of trunnion seals.
• Grease quantity to be decided.
• Inlet and outlet to be plugged after greasing.
• Grease gun tubing leak to be arrested.
BRAIN STORMING POSSIBLE SOLUTIONS
• Grease consumption is reduced to 5 kg from 8 kg in
atmospheric centrifuge.
• Grease consumption is reduced to 8 kg from 10 kg in
pressure centrifuge.
• No abnormalities are observed in any of the machines.
• Greasing time is reduced.
• Down time is decreased.
• Quality of grease is improved in removed centrifuge
OBSERVATIONS AFTER IMPLEMENTATION:
REFERENCES:
• Basu, Ron, and J. Nevan Wright, 2003. Quality Beyond Six Sigma.
Elsevier.
• Nancy R., T. (2005). The Quality Toolbox (Second Edi). ASQ Quality
Press.
• PerformanceTechnology, G. I. (2003). Welcome to CEDAC Learning
Cause-and- Effect D iagram with the Addition of Cards.
• Prasanna, N. K. K., & Desai, T. N. (2011). Quality Circle
Implementation for Maintenance Management in petrochemical
industry. Journal of Engineering Research and Studies, 2(1), 155–162.
• Welekar, S., & Kulkarni, S. (2013). Quality Circle To Improve
Productivity. International Journal of Engineering Research and
Application, 3(2), 814–819. Retrieved from www.ijera.com
THANK YOU
QUESTIONS??

Quality Circle and CEDAC in the Food Processing Industry

  • 1.
    USING QUALITY CIRCLESAND CEDAC TO IMPROVE QUALITY IN THE FOOD PROCESSING INDUSTRY PRESENTED BY : EMMANUEL BERKO (10386416)
  • 2.
    • Quality improvementis a gradual process. • This requires good organization and commitment. • Apply the techniques in Total Quality Management. • The techniques used to aid improvement are wide; Customer feedback, Plan-Do-Check-Act cycle, Quality circles, Analytical tools (scatter diagrams, Pareto analysis, Cause & Effect diagrams: CEDAC) INTRODUCTION:
  • 3.
    inspired by EdwardsDeming (1900-1993)
  • 4.
    • Quality circles(QC) are voluntary work groups. • Consists of about 6-12 members. • Meet to discuss how to improve the quality of products and work processes. • They are essentially problem-solving groups. INTRODUCTION contd.
  • 5.
    • QCs areformed occasionally to solve a problem that is foreseen. • It is not intended for an emergency solution. • They work without being put under pressure and are not time bound.
  • 6.
  • 7.
    • Encourage positivechange in attitude • Get to learn additional skills • Development of team spirit • Aid in productivity improvement • Build confidence of members • Brings trust between members and management PURPOSE OF QC
  • 8.
    • It mustbe staffed entirely by volunteers. • Each participant should be representative of different departments. • Problem to be addressed should be chosen by the circle, not by management. • Management must be supportive of the circle. CHARACTERISTICS OF THE QC:
  • 9.
    CHARACTERISTICS contd.: • Circlemembers must have received appropriate training in problem solving. • The circle must choose its own leader from within its own members. Source: Basu et al. 2003
  • 10.
    • Come upwith number of problems. • Decide on a particular problem to work on. • Explanation among members the analysis to be done in solving the problem. • Obtaining a number of solutions to the problem. STEPS TO PRODUCTIVITY IN A QC:
  • 11.
    • Discussing andevaluating the best solution for the problem. • Preparing a plan of action. • Implementing the plan and solution when approved. Source: (Welekar & Kulkarni, 2013) STEPS contd.:
  • 12.
    • Brain storming •PDCA (Plan Do Check Act) TECHNIQUES FOR PROBLEM SOLVING:
  • 13.
    TECHNIQUES contd.: • DataCollection and Analysis
  • 14.
  • 15.
    • CEDAC (Causeand Effect Diagram with the Addition of Cards) • It is a very specific way of building a fishbone diagram (developed by Ishikawa). • Team members contribute ideas written on sticky notes or Post-it notes. INTRODUCTION
  • 16.
    • In theoperations of a quality circle, CEDAC can be used as a tool to aid in solving a problem. INTRODUCTION contd.
  • 17.
    • Effect (Head) •Causes (Main branches) • Specific causes (Subcategories) COMPONENTS OF THE DIAGRAM:
  • 18.
    Causes (Main Branches) Manufacturingindustries; Machines, Methods, Environment, Materials, Measurement, Manpower Administrative; People, Process, Policy, Plant, Programs and Products COMPONENTS contd.:
  • 19.
    Areas where thiscan be applied are: – Customer complaints – Design problems – Rework – Poor communications – Setup problems – Downtime problems etc. APPLICATION OF CEDAC: Source: (Performance Technology Group Inc., 2003)
  • 20.
    • Define theproblem – specific and clear • Assess information needs – data, research, SOPs etc. • Plan fish bone diagram – stating the main categories, use of sticky notes (CEDAC), white board etc. • Gather information – act upon obtaining the required info. PROCEDURE TO DEVELOPING A CE DIAGRAM :
  • 21.
    • Develop theCE diagram – Brain storming and putting down the ideas. • Review the Diagram – Remove non-causes. • Act on the findings – Seek approval before solutions are implemented. PROCEDURE contd.:
  • 22.
    INDUSTRIAL APPLICATION This fishbonediagram was drawn by a manufacturing team to try to understand the source of periodic iron contamination. Source: (Nancy R., 2005)
  • 24.
    In a powderplant, consumption pattern of grease in centrifuges was not uniform. To optimize the grease consumption, a quality circle was formed and root-cause of the non-uniform grease consumption was identified, and recommendations were implemented to optimize the consumption. Source: (Prasanna & Desai, 2011) CASE STUDY OF QUALITY CIRCLE & CEDAC
  • 25.
    QUALITY CIRCLE • Nameof the organization: XYZ Industry • Number of circle: 1 • Section: Powder Plant • Number of meetings held: 24 (in 2 years). • Members: 8 • Date of Inception: Feb. 25, 2007 • Objective: Optimization of grease consumption in centrifuges (Pressure and Atmospheric).
  • 27.
    • To developproper greasing method. • To develop proper greasing schedule as per vendor recommendation. • Grease leak to be eliminated from trunnion seal ‘O’ rings. • To review design of trunnion seals. • Grease quantity to be decided. • Inlet and outlet to be plugged after greasing. • Grease gun tubing leak to be arrested. BRAIN STORMING POSSIBLE SOLUTIONS
  • 28.
    • Grease consumptionis reduced to 5 kg from 8 kg in atmospheric centrifuge. • Grease consumption is reduced to 8 kg from 10 kg in pressure centrifuge. • No abnormalities are observed in any of the machines. • Greasing time is reduced. • Down time is decreased. • Quality of grease is improved in removed centrifuge OBSERVATIONS AFTER IMPLEMENTATION:
  • 29.
    REFERENCES: • Basu, Ron,and J. Nevan Wright, 2003. Quality Beyond Six Sigma. Elsevier. • Nancy R., T. (2005). The Quality Toolbox (Second Edi). ASQ Quality Press. • PerformanceTechnology, G. I. (2003). Welcome to CEDAC Learning Cause-and- Effect D iagram with the Addition of Cards. • Prasanna, N. K. K., & Desai, T. N. (2011). Quality Circle Implementation for Maintenance Management in petrochemical industry. Journal of Engineering Research and Studies, 2(1), 155–162. • Welekar, S., & Kulkarni, S. (2013). Quality Circle To Improve Productivity. International Journal of Engineering Research and Application, 3(2), 814–819. Retrieved from www.ijera.com
  • 30.

Editor's Notes

  • #3 Willing to apply the techniques.
  • #5 This is a form of management technique, a human resource development technique, a problem-solving technique.
  • #6 No deadline is given…But must be within reasonable time.
  • #7 Depends on the Organogram of company
  • #8 Positive energy (contagious) to affect rest of workers.
  • #13 Individual perception helps brainstorming.
  • #14 Experience in ABL, the audit of Brewhouse to check for specification problems. (Cooking Time)
  • #17 Since this tool is aimed at involving everyone, a wide variety of problems and solutions can be identified.
  • #21 Effect (this must be specific and clear to understand) Items required to justify the problem
  • #22 Placing the various causes at respect points, potential causes and winnow it down. Flag unfinished causes and Confirm real causes. Serves as an improvement plan. Communicate to management the findings and seek approval before solutions are implemented.
  • #24 After penning down all possible causes, audits and analysis will aid in cutting down non-causes. Finalized causes are then looked at for further solutions.