Download to read offline


![Example: DOMAIN AND RANGE
State the domain and range for g(x)= −2(x−1) + 3.
Determine the domain
The domain is {x:x∈R} because there is no value of x for which g(x) is
undefined.
Determine the range
The range of g(x) can be calculated from:
(x-1) 0
-2(x-1) 0
-2 (x-1) +3 3
g(x) 3
Therefore the range is {g(x):g(x)≤3} or in interval notation (−∞;3].](https://image.slidesharecdn.com/quadraticequation-230815123406-9bd90a82/85/Quadratic-equation-pptx-11-320.jpg)
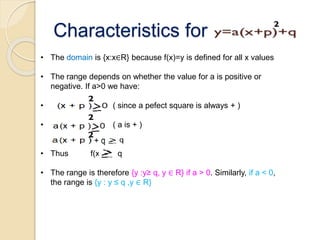
![Turning points
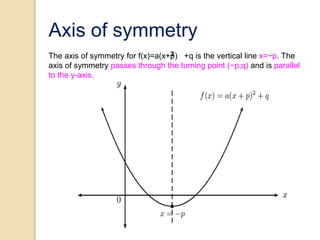
The turning point of the function f(x)=a(x+p) +q is determined by examining
the range of the function:
If a>0, f(x) has a minimum turning point and the range is [q;∞):
• The minimum value of f(x) is q.
• If f(x)=q, then a(x+p) =0, and therefore x=−p.
• This gives the turning point (−p;q).
If a<0, f(x) has a maximum turning point and the range is (−∞;q]:
• The maximum value of f(x) is q.
• If f(x)=q, then a(x+p) =0, and therefore x=−p.
• This gives the turning point (−p;q).
• Therefore the turning point of the quadratic function f(x)=a(x+p) +q is
(−p;q)](https://image.slidesharecdn.com/quadraticequation-230815123406-9bd90a82/85/Quadratic-equation-pptx-13-320.jpg)


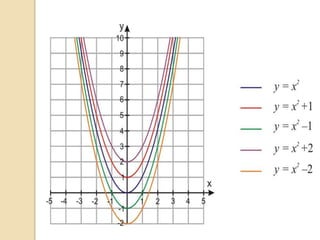
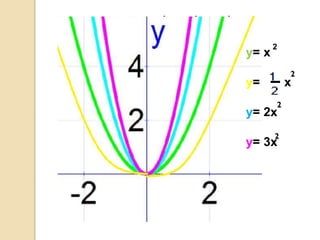
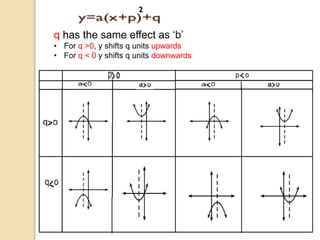
- The document discusses revising and sketching parabolic functions of the form y=ax+b, including how the parameters a and b affect the graph shape and position. - It introduces parabolic equations in standard form y=a(x-p)+q and turning point form, identifying characteristics like the turning point, axes of symmetry, intercepts, and asymptotes. - Examples are provided to demonstrate how to determine these characteristics, sketch the graph, and state the domain and range for parabolic functions given in equation form.


