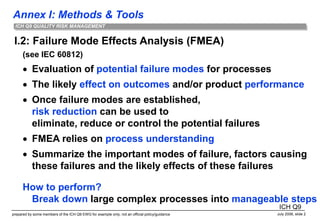
This document provides an overview of Failure Mode and Effects Analysis (FMEA) as a quality risk management tool. It discusses how FMEA can be used to evaluate potential failure modes in processes, identify likely effects on product quality, and prioritize risks. The document provides guidance on performing an FMEA, including establishing a team, identifying failure modes and causes, characterizing severity, probability and detectability of risks, defining actions, and documenting results. Examples of applying FMEA to a drying process and granulation process step are also presented to illustrate the methodology.


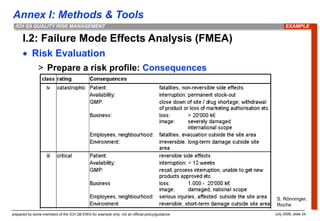
![Annex I: Methods & Tools
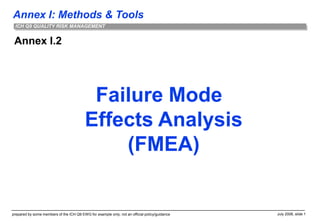
prepared by some members of the ICH Q9 EWG for example only; not an official policy/guidance July 2006, slide 20
ICH Q9 QUALITY RISK MANAGEMENT
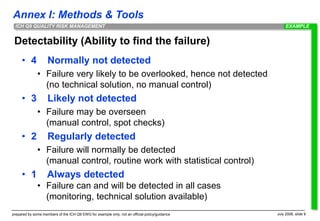
Risk Assessment Risk Reduction
Sub-Step
Event
(Failure mode)
Effect
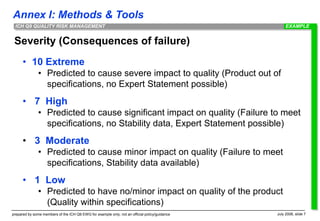
Severity
(S)
[1<2<3]
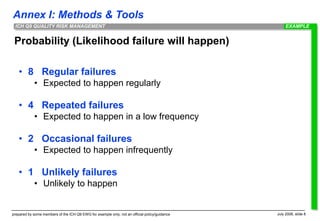
Probability
(P)
[1<2<3<4]
Detectability
(D)
[1<2<3]
Risk
factor
(S*P*D)
Actions:
Risk reduction strategy
Severity
(S)
[1<2<3]
Probability
(P)
[1<2<3<4]
Detectability
(D)
[1<2<3]
Risk
factor
(S*P*D)
Risk
reduction
Comments
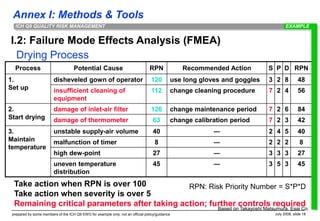
Wet seving Drying Temperature
not meet specification of
degradation
2 4 1 8 implement 2 temperature measures 1 1 1 1 7
automatically interruption
by not meeting range;
Temperatur monitoring in
batch record
Granulation Drying water content
not meet specification of
degradation
2 3 1 6 introduce online NIR 2 1 1 2 4 indirect measurment
introduce IPC analytic 2 2 1 4 2
direct measurement; time
consuming
humidity measurement in the exausting
air
2 1 2 4 2
indirect measurment;
unspecifoc
Granulation kneeding time
not meet specification of
dissolution
3 3 1 9 reduce personnal fluctuation 3 3 1 9 0
operator knowledge;
depending on power
consumption;
automatisation not possible
at that time
Granulation power consumption
not meet specification of
dissolution
3 2 1 6
try to get to a minumum an optimum of
kneeding time
3 2 1 6 0
depending on kneeding
time depending on material
properties
Pre-mixing mixing time
not meet specification of
content uniformity
3 2 3 18 IPC measure on content uniformity 3 2 1 6 12 influence on efficacy
Pre-mixing Granulation speed of adding water
not meet specification of
disolution and
desintegration
3 3 3 27
Analyse (seeving of granulate sieve
analysis); use of dosage pumps
3 2 1 6 21
to get fine appropriate
granulate
Pre-mixing Granulation manner of adding water
not meet specification of
disolution and
desintegration
3 1 1 3 install spray nozzles 1 1 1 1 2
to get fine appropriate
granulate
Granulation Quality of Excipients
all parameters have to be
re-evaluated
3 4 3 36
Adapt internal specification of physical
parameters (e.g. density, metability
wetability)
1 2 2 4 32 contact supplier
Granulation Quality of API
all parameters have to be
re-evaluated
3 4 3 36
Adapt internal specification of physical
parameters (e.g. density, metability
wetatility)
1 2 2 4 32 contact supplier
Overview Risk before cotrol Max 36 Risk after control Max 9 32
Average 17 Average 4 10
Min 3 Min 1 0
Failure
Mode
Effects
Analysis
(FMEA)
EXAMPLE
S. Rönninger, Roche](https://image.slidesharecdn.com/q9failuremodeeffectsa-230330074534-373e6f8e/85/Q9_Failure_Mode_Effects_A-ppt-20-320.jpg)
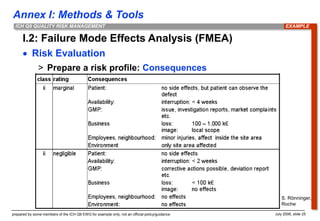
![Annex I: Methods & Tools
prepared by some members of the ICH Q9 EWG for example only; not an official policy/guidance July 2006, slide 21
ICH Q9 QUALITY RISK MANAGEMENT
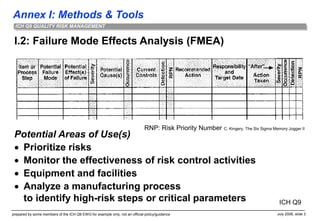
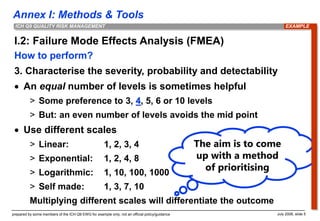
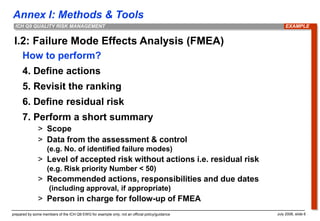
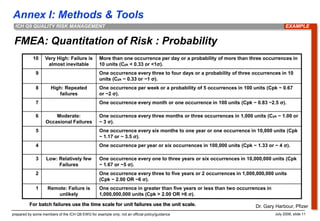
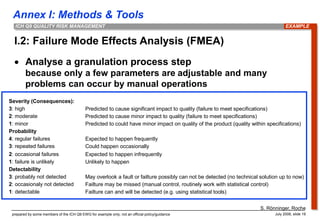
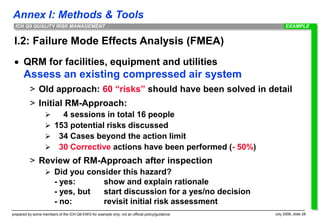
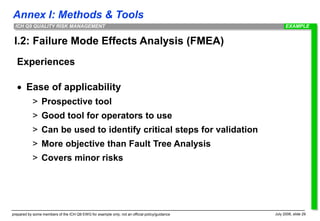
I.2 Failure Mode Effects Analysis (FMEA)
Risk Assessment
Sub-Step
Event
(Failure mode)
Effect
Severity
(S)
[1<2<3]
Probability
(P)
[1<2<3<4]
Detectability
(D)
[1<2<3]
Risk
factor
(S*P*D)
Granulation Drying water content
not meet specification of
degradation
2 3 1 6
Risk Reduction
Actions:
Risk reduction strategy
Severity
(S)
[1<2<3]
Probability
(P)
[1<2<3<4]
Detectability
(D)
[1<2<3]
Risk
factor
(S*P*D)
Risk
reduction
Comments
introduce online NIR 2 1 1 2 4 indirect measurment
introduce IPC analytic 2 2 1 4 2
direct measurement; time
consuming
humidity measurement in the exaust air 2 1 2 4 2
indirect measurment;
unspecific
EXAMPLE
S. Rönninger, Roche](https://image.slidesharecdn.com/q9failuremodeeffectsa-230330074534-373e6f8e/85/Q9_Failure_Mode_Effects_A-ppt-21-320.jpg)


![ONFH[AVN HIP] -TRIPLE REGIME -A NOVAL SURGICAL CONCEPT .pptx](https://cdn.slidesharecdn.com/ss_thumbnails/onfhavnhip2026koaconcalicutdrgokuldevdrmashraf-260210064517-213ec005-thumbnail.jpg?width=640&height=640&fit=bounds)


