Download to read offline

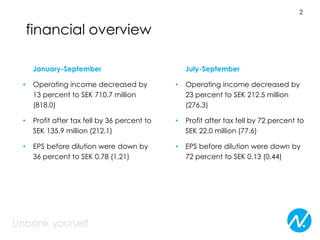
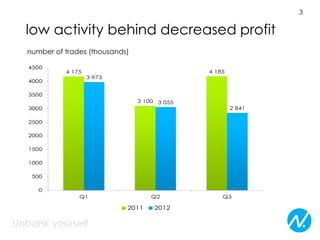
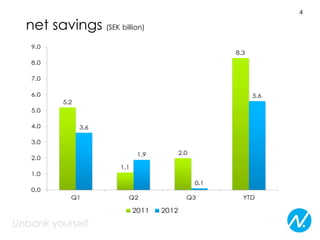

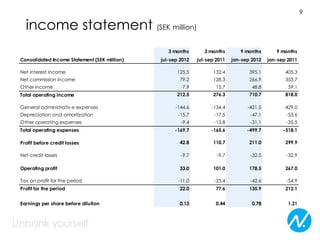
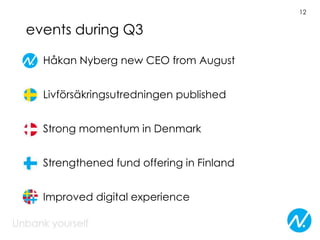


This document summarizes the financial performance of Nordnet for the first three quarters of 2012. Key points include: - Operating income and profit after tax decreased by 13% and 36% respectively for the first three quarters compared to the same period in 2011, due to lower trading activity. - EPS fell by 36% for the first three quarters. - Total operating income and profit for the third quarter alone decreased by 23% and 72% respectively compared to Q3 2011. - Nordnet saw lower numbers of trades and net savings in the period. - Håkan Nyberg became the new CEO in August 2012. - The document outlines Nordnet's vision to become the leading bank for savings in the


