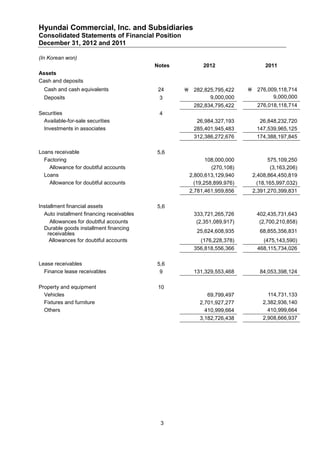
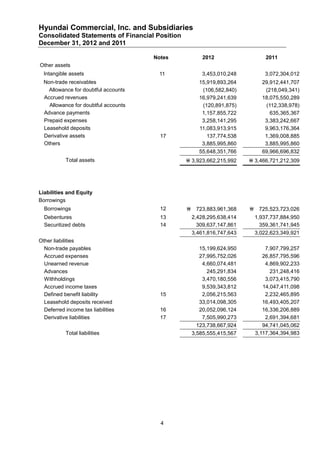
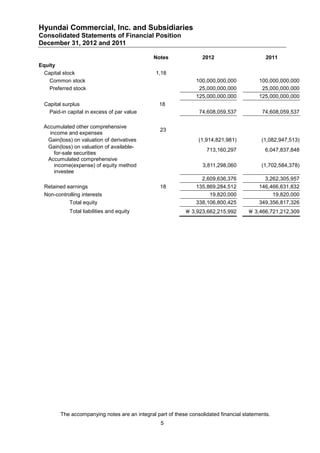
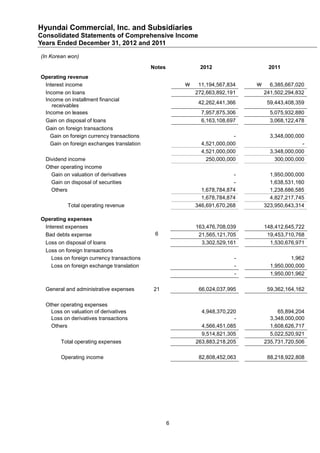
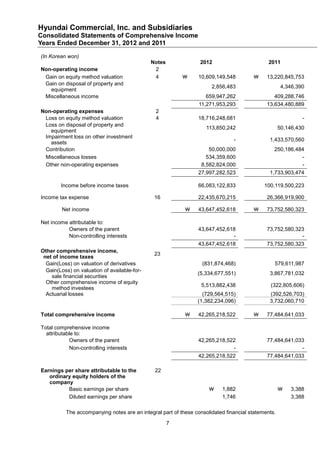
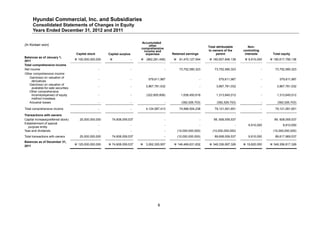
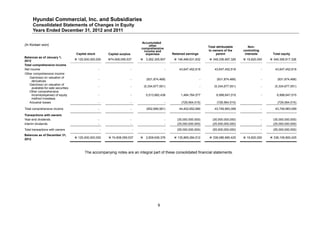
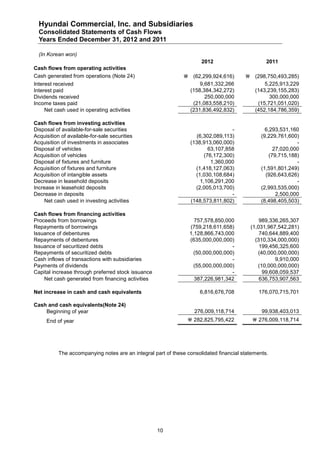
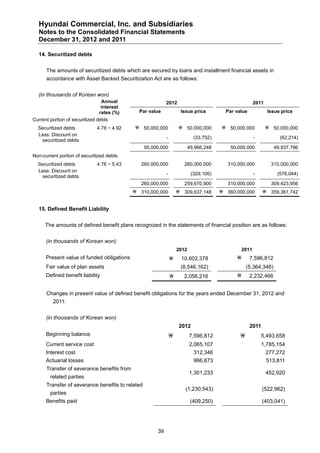
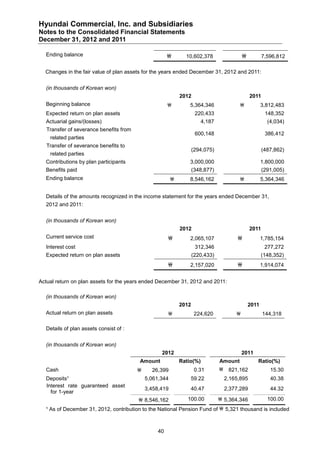
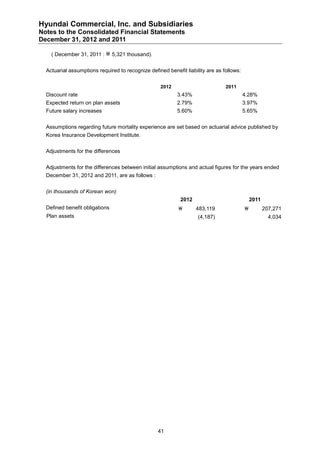
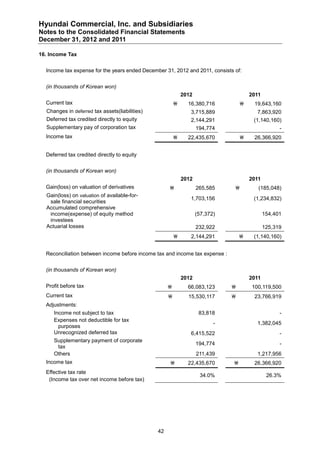
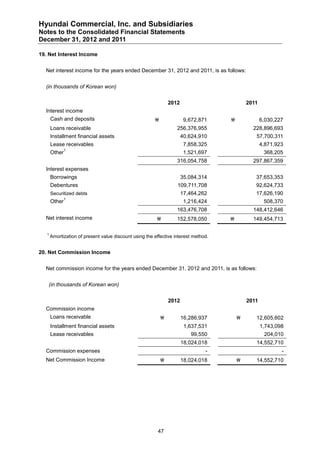
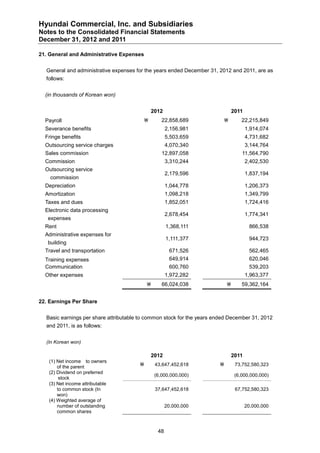
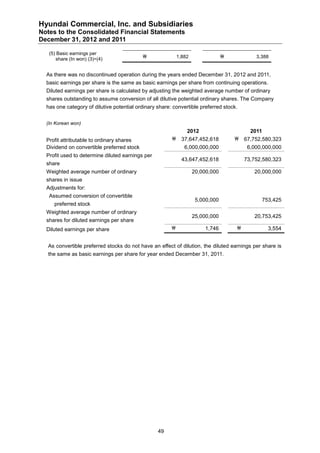
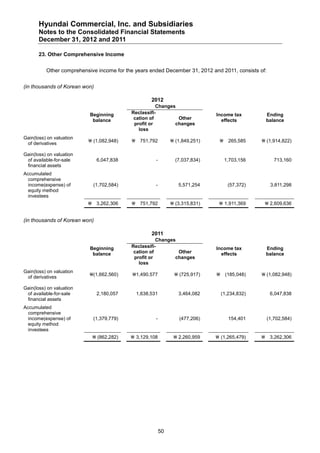
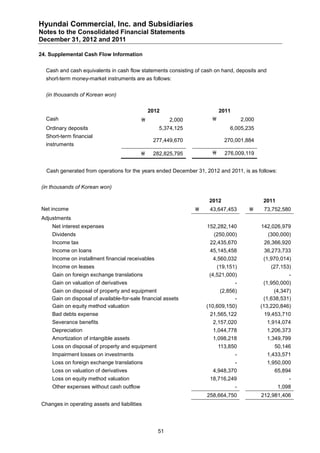
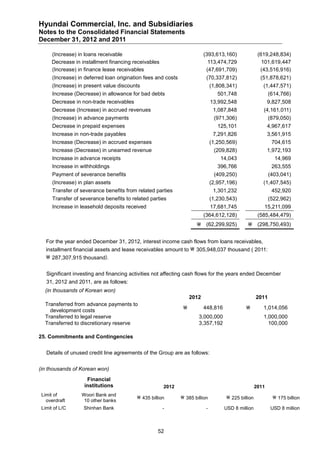
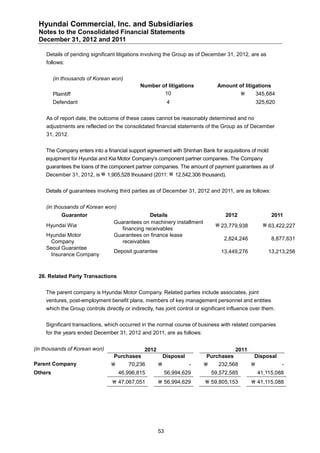
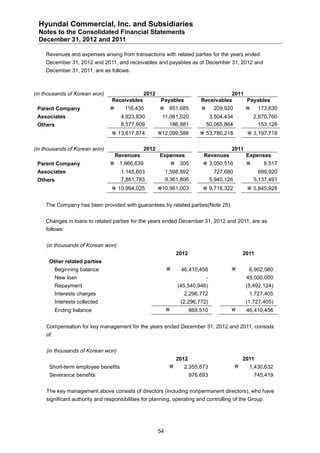
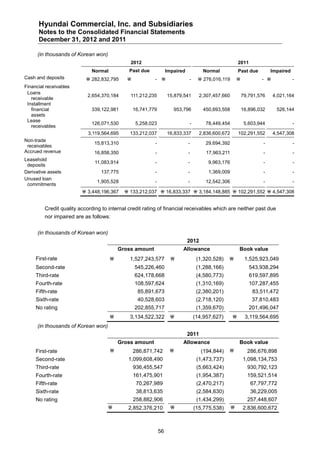
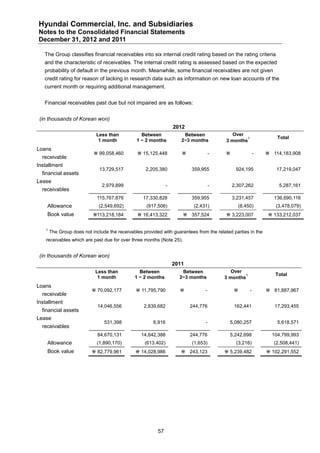
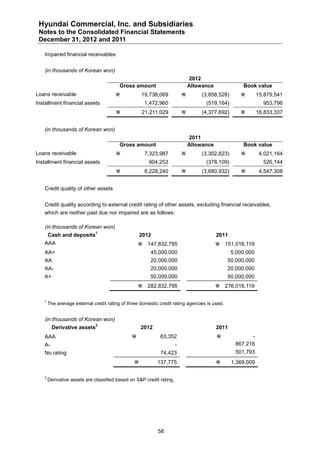
Currently pi network is not tradable on binance or any other exchange because we are still in the enclosed mainnet.
Right now the only way to sell pi coins is by trading with a verified merchant.
What is a pi merchant?
A pi merchant is someone verified by pi network team and allowed to barter pi coins for goods and services.
Since pi network is not doing any pre-sale The only way exchanges like binance/huobi or crypto whales can get pi is by buying from miners. And a merchant stands in between the exchanges and the miners.
I will leave the telegram contact of my personal pi merchant. I and my friends has traded more than 6000pi coins successfully
Tele-gram
@Pi_vendor_247
The secret way to sell pi coins effortlessly.DOT TECH
Well as we all know pi isn't launched yet. But you can still sell your pi coins effortlessly because some whales in China are interested in holding massive pi coins. And they are willing to pay good money for it. If you are interested in selling I will leave a contact for you. Just telegram this number below. I sold about 3000 pi coins to him and he paid me immediately.
Telegram: @Pi_vendor_247
USDA Loans in California: A Comprehensive Overview.pptxmarketing367770
USDA Loans in California: A Comprehensive Overview
If you're dreaming of owning a home in California's rural or suburban areas, a USDA loan might be the perfect solution. The U.S. Department of Agriculture (USDA) offers these loans to help low-to-moderate-income individuals and families achieve homeownership.
Key Features of USDA Loans:
Zero Down Payment: USDA loans require no down payment, making homeownership more accessible.
Competitive Interest Rates: These loans often come with lower interest rates compared to conventional loans.
Flexible Credit Requirements: USDA loans have more lenient credit score requirements, helping those with less-than-perfect credit.
Guaranteed Loan Program: The USDA guarantees a portion of the loan, reducing risk for lenders and expanding borrowing options.
Eligibility Criteria:
Location: The property must be located in a USDA-designated rural or suburban area. Many areas in California qualify.
Income Limits: Applicants must meet income guidelines, which vary by region and household size.
Primary Residence: The home must be used as the borrower's primary residence.
Application Process:
Find a USDA-Approved Lender: Not all lenders offer USDA loans, so it's essential to choose one approved by the USDA.
Pre-Qualification: Determine your eligibility and the amount you can borrow.
Property Search: Look for properties in eligible rural or suburban areas.
Loan Application: Submit your application, including financial and personal information.
Processing and Approval: The lender and USDA will review your application. If approved, you can proceed to closing.
USDA loans are an excellent option for those looking to buy a home in California's rural and suburban areas. With no down payment and flexible requirements, these loans make homeownership more attainable for many families. Explore your eligibility today and take the first step toward owning your dream home.
Resume
• Real GDP growth slowed down due to problems with access to electricity caused by the destruction of manoeuvrable electricity generation by Russian drones and missiles.
• Exports and imports continued growing due to better logistics through the Ukrainian sea corridor and road. Polish farmers and drivers stopped blocking borders at the end of April.
• In April, both the Tax and Customs Services over-executed the revenue plan. Moreover, the NBU transferred twice the planned profit to the budget.
• The European side approved the Ukraine Plan, which the government adopted to determine indicators for the Ukraine Facility. That approval will allow Ukraine to receive a EUR 1.9 bn loan from the EU in May. At the same time, the EU provided Ukraine with a EUR 1.5 bn loan in April, as the government fulfilled five indicators under the Ukraine Plan.
• The USA has finally approved an aid package for Ukraine, which includes USD 7.8 bn of budget support; however, the conditions and timing of the assistance are still unknown.
• As in March, annual consumer inflation amounted to 3.2% yoy in April.
• At the April monetary policy meeting, the NBU again reduced the key policy rate from 14.5% to 13.5% per annum.
• Over the past four weeks, the hryvnia exchange rate has stabilized in the UAH 39-40 per USD range.
US Economic Outlook - Being Decided - M Capital Group August 2021.pdfpchutichetpong
The U.S. economy is continuing its impressive recovery from the COVID-19 pandemic and not slowing down despite re-occurring bumps. The U.S. savings rate reached its highest ever recorded level at 34% in April 2020 and Americans seem ready to spend. The sectors that had been hurt the most by the pandemic specifically reduced consumer spending, like retail, leisure, hospitality, and travel, are now experiencing massive growth in revenue and job openings.
Could this growth lead to a “Roaring Twenties”? As quickly as the U.S. economy contracted, experiencing a 9.1% drop in economic output relative to the business cycle in Q2 2020, the largest in recorded history, it has rebounded beyond expectations. This surprising growth seems to be fueled by the U.S. government’s aggressive fiscal and monetary policies, and an increase in consumer spending as mobility restrictions are lifted. Unemployment rates between June 2020 and June 2021 decreased by 5.2%, while the demand for labor is increasing, coupled with increasing wages to incentivize Americans to rejoin the labor force. Schools and businesses are expected to fully reopen soon. In parallel, vaccination rates across the country and the world continue to rise, with full vaccination rates of 50% and 14.8% respectively.
However, it is not completely smooth sailing from here. According to M Capital Group, the main risks that threaten the continued growth of the U.S. economy are inflation, unsettled trade relations, and another wave of Covid-19 mutations that could shut down the world again. Have we learned from the past year of COVID-19 and adapted our economy accordingly?
“In order for the U.S. economy to continue growing, whether there is another wave or not, the U.S. needs to focus on diversifying supply chains, supporting business investment, and maintaining consumer spending,” says Grace Feeley, a research analyst at M Capital Group.
While the economic indicators are positive, the risks are coming closer to manifesting and threatening such growth. The new variants spreading throughout the world, Delta, Lambda, and Gamma, are vaccine-resistant and muddy the predictions made about the economy and health of the country. These variants bring back the feeling of uncertainty that has wreaked havoc not only on the stock market but the mindset of people around the world. MCG provides unique insight on how to mitigate these risks to possibly ensure a bright economic future.
how can i use my minded pi coins I need some funds.DOT TECH
If you are interested in selling your pi coins, i have a verified pi merchant, who buys pi coins and resell them to exchanges looking forward to hold till mainnet launch.
Because the core team has announced that pi network will not be doing any pre-sale. The only way exchanges like huobi, bitmart and hotbit can get pi is by buying from miners.
Now a merchant stands in between these exchanges and the miners. As a link to make transactions smooth. Because right now in the enclosed mainnet you can't sell pi coins your self. You need the help of a merchant,
i will leave the telegram contact of my personal pi merchant below. 👇 I and my friends has traded more than 3000pi coins with him successfully.
@Pi_vendor_247
how to swap pi coins to foreign currency withdrawable.DOT TECH
As of my last update, Pi is still in the testing phase and is not tradable on any exchanges.
However, Pi Network has announced plans to launch its Testnet and Mainnet in the future, which may include listing Pi on exchanges.
The current method for selling pi coins involves exchanging them with a pi vendor who purchases pi coins for investment reasons.
If you want to sell your pi coins, reach out to a pi vendor and sell them to anyone looking to sell pi coins from any country around the globe.
Below is the contact information for my personal pi vendor.
Telegram: @Pi_vendor_247
Empowering the Unbanked: The Vital Role of NBFCs in Promoting Financial Inclu...Vighnesh Shashtri
In India, financial inclusion remains a critical challenge, with a significant portion of the population still unbanked. Non-Banking Financial Companies (NBFCs) have emerged as key players in bridging this gap by providing financial services to those often overlooked by traditional banking institutions. This article delves into how NBFCs are fostering financial inclusion and empowering the unbanked.
how can I sell pi coins after successfully completing KYCDOT TECH
Pi coins is not launched yet in any exchange 💱 this means it's not swappable, the current pi displaying on coin market cap is the iou version of pi. And you can learn all about that on my previous post.
RIGHT NOW THE ONLY WAY you can sell pi coins is through verified pi merchants. A pi merchant is someone who buys pi coins and resell them to exchanges and crypto whales. Looking forward to hold massive quantities of pi coins before the mainnet launch.
This is because pi network is not doing any pre-sale or ico offerings, the only way to get my coins is from buying from miners. So a merchant facilitates the transactions between the miners and these exchanges holding pi.
I and my friends has sold more than 6000 pi coins successfully with this method. I will be happy to share the contact of my personal pi merchant. The one i trade with, if you have your own merchant you can trade with them. For those who are new.
Message: @Pi_vendor_247 on telegram.
I wouldn't advise you selling all percentage of the pi coins. Leave at least a before so its a win win during open mainnet. Have a nice day pioneers ♥️
#kyc #mainnet #picoins #pi #sellpi #piwallet
#pinetwork
Poonawalla Fincorp and IndusInd Bank Introduce New Co-Branded Credit Cardnickysharmasucks
The unveiling of the IndusInd Bank Poonawalla Fincorp eLITE RuPay Platinum Credit Card marks a notable milestone in the Indian financial landscape, showcasing a successful partnership between two leading institutions, Poonawalla Fincorp and IndusInd Bank. This co-branded credit card not only offers users a plethora of benefits but also reflects a commitment to innovation and adaptation. With a focus on providing value-driven and customer-centric solutions, this launch represents more than just a new product—it signifies a step towards redefining the banking experience for millions. Promising convenience, rewards, and a touch of luxury in everyday financial transactions, this collaboration aims to cater to the evolving needs of customers and set new standards in the industry.
how to sell pi coins in South Korea profitably.DOT TECH
Yes. You can sell your pi network coins in South Korea or any other country, by finding a verified pi merchant
What is a verified pi merchant?
Since pi network is not launched yet on any exchange, the only way you can sell pi coins is by selling to a verified pi merchant, and this is because pi network is not launched yet on any exchange and no pre-sale or ico offerings Is done on pi.
Since there is no pre-sale, the only way exchanges can get pi is by buying from miners. So a pi merchant facilitates these transactions by acting as a bridge for both transactions.
How can i find a pi vendor/merchant?
Well for those who haven't traded with a pi merchant or who don't already have one. I will leave the telegram id of my personal pi merchant who i trade pi with.
Tele gram: @Pi_vendor_247
#pi #sell #nigeria #pinetwork #picoins #sellpi #Nigerian #tradepi #pinetworkcoins #sellmypi
how can I sell my pi coins for cash in a pi APPDOT TECH
You can't sell your pi coins in the pi network app. because it is not listed yet on any exchange.
The only way you can sell is by trading your pi coins with an investor (a person looking forward to hold massive amounts of pi coins before mainnet launch) .
You don't need to meet the investor directly all the trades are done with a pi vendor/merchant (a person that buys the pi coins from miners and resell it to investors)
I Will leave The telegram contact of my personal pi vendor, if you are finding a legitimate one.
@Pi_vendor_247
#pi network
#pi coins
#money
1. Hyundai Commercial, Inc. and
Subsidiaries
Consolidated Financial Statements
December 31, 2012 and 2011
2. Hyundai Commercial, Inc. and Subsidiaries
Index
December 31, 2012 and 2011
Report of Independent Auditors .........................................................................................................1-2
Consolidated Financial Statements
Consolidated Statements of Financial Position......................................................................................3-5
Consolidated Statements of Comprehensive Income............................................................................6-7
Consolidated Statements of Changes in Equity ................................................................................... 8-9
Consolidated Statements of Cash Flows ................................................................................................10
Notes to the Consolidated Financial Statements ...............................................................................11-62
3. Report of Independent Auditors
To the Shareholders and Board of Directors of
Hyundai Commercial, Inc.
We have audited the accompanying consolidated statements of financial position of Hyundai
Commercial, Inc. (the ”Company”) and its subsidiaries as of December 31, 2012 and 2011,
and the related statements of comprehensive income, changes in equity and cash flows for
the years then ended, expressed in Korean won. These financial statements are the
responsibility of the Company’s management. Our responsibility is to express an opinion on
these consolidated financial statements based on our audits.
We conducted our audits in accordance with auditing standards generally accepted in the
Republic of Korea. Those standards require that we plan and perform the audit to obtain
reasonable assurance about whether the consolidated financial statements are free of
material misstatement. An audit includes examining, on a test basis, evidence supporting the
amounts and disclosures in the financial statements. An audit also includes assessing the
accounting principles used and significant estimates made by management, as well as
evaluating the overall financial statement presentation. We believe that our audits provide a
reasonable basis for our opinion.
In our opinion, the consolidated financial statements, referred to above, present fairly, in all
material respects, the financial position of Hyundai Commercial, Inc. and its subsidiaries as of
December 31, 2012 and 2011, and their financial performance and cash flows for the years
then ended, in conformity with International Financial Reporting Standards as adopted by the
Republic of Korea (“Korean IFRS”).
1
4. Auditing standards and their application in practice vary among countries. The procedures and
practices used in the Republic of Korea to audit such financial statements may differ from
those generally accepted and applied in other countries. Accordingly, this report is for use by
those who are informed about Korean auditing standards and their application in practice.
Seoul, Korea
March 19, 2013
This report is effective as of March 19, 2013, the audit report date. Certain subsequent
events or circumstances, which may occur between the audit report date and the time of
reading this report, could have a material impact on the accompanying consolidated
financial statements and notes thereto. Accordingly, the readers of the audit report should
understand that there is a possibility that the above audit report may have to be revised to
reflect the impact of such subsequent events or circumstances, if any.
2
5. Hyundai Commercial, Inc. and Subsidiaries
Consolidated Statements of Financial Position
December 31, 2012 and 2011
(In Korean won)
Notes 2012 2011
Assets
Cash and deposits
Cash and cash equivalents 24 282,825,795,422 276,009,118,714
Deposits 3 9,000,000 9,000,000
282,834,795,422 276,018,118,714
Securities 4
Available-for-sale securities 26,984,327,193 26,848,232,720
Investments in associates 285,401,945,483 147,539,965,125
312,386,272,676 174,388,197,845
Loans receivable 5,6
Factoring 108,000,000 575,109,250
Allowance for doubtful accounts (270,108) (3,163,206)
Loans 2,800,613,129,940 2,408,864,450,819
Allowance for doubtful accounts (19,258,899,976) (18,165,997,032)
2,781,461,959,856 2,391,270,399,831
Installment financial assets 5,6
Auto installment financing receivables 333,721,265,726 402,435,731,643
Allowances for doubtful accounts (2,351,089,917) (2,700,210,858)
Durable goods installment financing
receivables 25,624,608,935 68,855,356,831
Allowances for doubtful accounts (176,228,378) (475,143,590)
356,818,556,366 468,115,734,026
Lease receivables 5,6
Finance lease receivables 9 131,329,553,468 84,053,398,124
Property and equipment 10
Vehicles 69,799,497 114,731,133
Fixtures and furniture 2,701,927,277 2,382,936,140
Others 410,999,664 410,999,664
3,182,726,438 2,908,666,937
3
6. Hyundai Commercial, Inc. and Subsidiaries
Consolidated Statements of Financial Position
December 31, 2012 and 2011
Notes 2012 2011
Other assets
Intangible assets 11 3,453,010,248 3,072,304,012
Non-trade receivables 15,919,893,264 29,912,441,707
Allowance for doubtful accounts (106,582,840) (218,049,341)
Accrued revenues 16,979,241,639 18,075,550,289
Allowance for doubtful accounts (120,891,875) (112,338,978)
Advance payments 1,157,855,722 635,365,367
Prepaid expenses 3,258,141,295 3,383,242,667
Leasehold deposits 11,083,913,915 9,963,176,364
Derivative assets 17 137,774,538 1,369,008,885
Others 3,885,995,860 3,885,995,860
55,648,351,766 69,966,696,832
Total assets 3,923,662,215,992 3,466,721,212,309
Liabilities and Equity
Borrowings
Borrowings 12 723,883,961,368 725,523,723,026
Debentures 13 2,428,295,638,414 1,937,737,884,950
Securitized debts 14 309,637,147,861 359,361,741,945
3,461,816,747,643 3,022,623,349,921
Other liabilities
Non-trade payables 15,199,624,950 7,907,799,257
Accrued expenses 27,995,752,026 26,857,795,596
Unearned revenue 4,660,074,481 4,869,902,233
Advances 245,291,834 231,248,416
Withholdings 3,470,180,556 3,073,415,790
Accrued income taxes 9,539,343,812 14,047,411,098
Defined benefit liability 15 2,056,215,563 2,232,465,895
Leasehold deposits received 33,014,098,305 16,493,405,207
Deferred income tax liabilities 16 20,052,096,124 16,336,206,889
Derivative liabilities 17 7,505,990,273 2,691,394,681
123,738,667,924 94,741,045,062
Total liabilities 3,585,555,415,567 3,117,364,394,983
4
7. Hyundai Commercial, Inc. and Subsidiaries
Consolidated Statements of Financial Position
December 31, 2012 and 2011
Notes 2012 2011
Equity
Capital stock 1,18
Common stock 100,000,000,000 100,000,000,000
Preferred stock 25,000,000,000 25,000,000,000
125,000,000,000 125,000,000,000
Capital surplus 18
Paid-in capital in excess of par value 74,608,059,537 74,608,059,537
Accumulated other comprehensive
23
income and expenses
Gain(loss) on valuation of derivatives (1,914,821,981) (1,082,947,513)
Gain(loss) on valuation of available-
713,160,297 6,047,837,848
for-sale securities
Accumulated comprehensive
income(expense) of equity method 3,811,298,060 (1,702,584,378)
investee
2,609,636,376 3,262,305,957
Retained earnings 18 135,869,284,512 146,466,631,832
Non-controlling interests 19,820,000 19,820,000
Total equity 338,106,800,425 349,356,817,326
Total liabilities and equity 3,923,662,215,992 3,466,721,212,309
The accompanying notes are an integral part of these consolidated financial statements.
5
8. Hyundai Commercial, Inc. and Subsidiaries
Consolidated Statements of Comprehensive Income
Years Ended December 31, 2012 and 2011
(In Korean won)
Notes 2012 2011
Operating revenue
Interest income ₩ 11,194,567,834 ₩ 6,385,667,020
Income on loans 272,663,892,191 241,502,294,832
Income on installment financial
42,262,441,366 59,443,408,359
receivables
Income on leases 7,957,875,306 5,075,932,880
Gain on disposal of loans 6,163,108,697 3,068,122,478
Gain on foreign transactions
Gain on foreign currency transactions - 3,348,000,000
Gain on foreign exchanges translation 4,521,000,000 -
4,521,000,000 3,348,000,000
Dividend income 250,000,000 300,000,000
Other operating income
Gain on valuation of derivatives - 1,950,000,000
Gain on disposal of securities - 1,638,531,160
Others 1,678,784,874 1,238,686,585
1,678,784,874 4,827,217,745
Total operating revenue 346,691,670,268 323,950,643,314
Operating expenses
Interest expenses 163,476,708,039 148,412,645,722
Bad debts expense 6 21,565,121,705 19,453,710,768
Loss on disposal of loans 3,302,529,161 1,530,676,971
Loss on foreign transactions
Loss on foreign currency transactions - 1,962
Loss on foreign exchange translation - 1,950,000,000
- 1,950,001,962
General and administrative expenses 21 66,024,037,995 59,362,164,162
Other operating expenses
Loss on valuation of derivatives 4,948,370,220 65,894,204
Loss on derivatives transactions - 3,348,000,000
Others 4,566,451,085 1,608,626,717
9,514,821,305 5,022,520,921
Total operating expenses 263,883,218,205 235,731,720,506
Operating income 82,808,452,063 88,218,922,808
6
9. Hyundai Commercial, Inc. and Subsidiaries
Consolidated Statements of Comprehensive Income
Years Ended December 31, 2012 and 2011
(In Korean won)
Notes 2012 2011
Non-operating income 2
Gain on equity method valuation 4 ₩ 10,609,149,548 ₩ 13,220,845,753
Gain on disposal of property and
2,856,483 4,346,390
equipment
Miscellaneous income 659,947,262 409,288,746
11,271,953,293 13,634,480,889
Non-operating expenses 2
Loss on equity method valuation 4 18,716,248,681 -
Loss on disposal of property and
113,850,242 50,146,430
equipment
Impairment loss on other investment
- 1,433,570,560
assets
Contribution 50,000,000 250,186,484
Miscellaneous losses 534,359,600 -
Other non-operating expenses 8,582,824,000 -
27,997,282,523 1,733,903,474
Income before income taxes 66,083,122,833 100,119,500,223
Income tax expense 16 22,435,670,215 26,366,919,900
Net income ₩ 43,647,452,618 ₩ 73,752,580,323
Net income attributable to:
Owners of the parent 43,647,452,618 73,752,580,323
Non-controlling interests - -
43,647,452,618 73,752,580,323
Other comprehensive income,
23
net of income taxes
Gain(Loss) on valuation of derivatives (831,874,468) 579,611,987
Gain(Loss) on valuation of available-for-
(5,334,677,551) 3,867,781,032
sale financial securities
Other comprehensive income of equity
5,513,882,438 (322,805,606)
method investees
Actuarial losses (729,564,515) (392,526,703)
(1,382,234,096) 3,732,060,710
Total comprehensive income ₩ 42,265,218,522 ₩ 77,484,641,033
Total comprehensive income
attributable to:
Owners of the parent 42,265,218,522 77,484,641,033
Non-controlling interests - -
42,265,218,522 77,484,641,033
Earnings per share attributable to the 22
ordinary equity holders of the
company
Basic earnings per share ₩ 1,882 ₩ 3,388
Diluted earnings per share 1,746 3,388
The accompanying notes are an integral part of these consolidated financial statements.
7
10. Hyundai Commercial, Inc. and Subsidiaries
Consolidated Statements of Changes in Equity
Years Ended December 31, 2012 and 2011
Accumulated
(In Korean won) other Total attributable Non-
comprehensive
income and to owners of the controlling
Capital stock Capital surplus expenses Retained earnings parent interests Total equity
Balances as of January 1,
2011 100,000,000,000 - (862,281,456) 81,470,127,594 180,607,846,138 9,910,000 180,617,756,138
Total comprehensive income
Net income - - - 73,752,580,323 73,752,580,323 - 73,752,580,323
Other comprehensive income
Gain(loss) on valuation of
- - 579,611,987 - 579,611,987 - 579,611,987
derivatives
Gain(loss) on valuation of
- - 3,867,781,032 - 3,867,781,032 - 3,867,781,032
available-for-sale securities
Other comprehensive
income(expense) of equity - - (322,805,606) 1,636,450,618 1,313,645,012 - 1,313,645,012
method investees
Actuarial losses - - - (392,526,703) (392,526,703) - (392,526,703)
Total comprehensive income - - 4,124,587,413 74,996,504,238 79,121,091,651 - 79,121,091,651
Transactions with owners
Capital increase(preferred stock) 25,000,000,000 74,608,059,537 - - 99, 608,059,537 - 99, 608,059,537
Establishment of special
- - - - - 9,910,000 9,910,000
purpose entity
Year-end dividends - - - (10,000,000,000) (10,000,000,000) - (10,000,000,000)
Total transactions with owners 25,000,000,000 74,608,059,537 - (10,000,000,000) 89,608,059,537 9,910,000 89,617,969,537
Balances as of December 31,
125,000,000,000 74,608,059,537 3,262,305,957 146,466,631,832 349,336,997,326 19,820,000 349,356,817,326
2011
8
11. Hyundai Commercial, Inc. and Subsidiaries
Consolidated Statements of Changes in Equity
Years Ended December 31, 2012 and 2011
Accumulated
(In Korean won) other Total attributable Non-
comprehensive
income and to owners of the controlling
Capital stock Capital surplus expenses Retained earnings parent interests Total equity
Balances as of January 1,
2012 125,000,000,000 74,608,059,537 3,262,305,957 146,466,631,832 349,336,997,326 19,820,000 349,356,817,326
Total comprehensive income
Net income - - - 43,647,452,618 43,647,452,618 - 43,647,452,618
Other comprehensive income
Gain(loss) on valuation of
- - (831,874,468) - (831,874,468) - (831,874,468)
derivatives
Gain(loss) on valuation of
- - (5,334,677,551) - (5,334,677,551) - (5,334,677,551)
available-for-sale securities
Other comprehensive
income(expense) of equity - - 5,513,882,438 1,484,764,577 6,998,647,015 - 6,998,647,015
method investees
Actuarial losses - - - (729,564,515) (729,564,515) (729,564,515)
Total comprehensive income - - (652,669,581) 44,402,652,680 43,749,983,099 - 43,749,983,099
Transactions with owners
Year-end dividends - - - (30,000,000,000) (30,000,000,000) - (30,000,000,000)
Interim dividends - - - (25,000,000,000) (25,000,000,000) - (25,000,000,000)
Total transactions with owners - - - (55,000,000,000) (55,000,000,000) - (55,000,000,000)
Balances as of December 31,
2012 125,000,000,000 74,608,059,537 2,609,636,376 135,869,284,512 338,086,980,425 19,820,000 338,106,800,425
The accompanying notes are an integral part of these consolidated financial statements.
9
12. Hyundai Commercial, Inc. and Subsidiaries
Consolidated Statements of Cash Flows
Years Ended December 31, 2012 and 2011
(In Korean won)
2012 2011
Cash flows from operating activities
Cash generated from operations (Note 24) (62,299,924,616) (298,750,493,285)
Interest received 9,681,332,266 5,225,913,229
Interest paid (158,384,342,272) (143,239,155,283)
Dividends received 250,000,000 300,000,000
Income taxes paid (21,083,558,210) (15,721,051,020)
Net cash used in operating activities (231,836,492,832) (452,184,786,359)
Cash flows from investing activities
Disposal of available-for-sale securities - 6,293,531,160
Acquisition of available-for-sale securities (6,302,089,113) (9,229,761,600)
Acquisition of investments in associates (138,913,060,000) -
Disposal of vehicles 63,107,858 27,020,000
Acquisition of vehicles (76,172,300) (79,715,188)
Disposal of fixtures and furniture 1,360,000 -
Acquisition of fixtures and furniture (1,418,127,063) (1,591,801,249)
Acquisition of intangible assets (1,030,108,684) (926,643,626)
Decrease in leasehold deposits 1,106,291,200 -
Increase in leasehold deposits (2,005,013,700) (2,993,535,000)
Decrease in deposits - 2,500,000
Net cash used in investing activities (148,573,811,802) (8,498,405,503)
Cash flows from financing activities
Proceeds from borrowings 757,578,850,000 989,336,265,307
Repayments of borrowings (759,218,611,658) (1,031,967,542,281)
Issuance of debentures 1,128,866,743,000 740,644,889,400
Repayments of debentures (635,000,000,000) (310,334,000,000)
Issuance of securitized debts - 199,456,325,600
Repayments of securitized debts (50,000,000,000) (40,000,000,000)
Cash inflows of transactions with subsidiaries - 9,910,000
Payments of dividends (55,000,000,000) (10,000,000,000)
Capital increase through preferred stock issuance - 99,608,059,537
Net cash generated from financing activities 387,226,981,342 636,753,907,563
Net increase in cash and cash equivalents 6,816,676,708 176,070,715,701
Cash and cash equivalents(Note 24)
Beginning of year 276,009,118,714 99,938,403,013
End of year 282,825,795,422 276,009,118,714
The accompanying notes are an integral part of these consolidated financial statements.
10
13. Hyundai Commercial, Inc. and Subsidiaries
Notes to the Consolidated Financial Statements
December 31, 2012 and 2011
1. General Information
Hyundai Commercial, Inc. (the “Company”) was established on March 27, 2007, by taking over all
the assets, liabilities, rights and obligations related with the loans of the industrial product division
of Hyundai Capital Services, Inc. and its installment financing and lease financing division. It is
engaged in installment financing, and leasing of facilities. The Company’s operations are
headquartered in Yeouido, Seoul. Its shareholders of common stock are as follows:
2012 2011
Shareholders
Ownership Ownership
Hyundai Motor Company 50.00% 50.00%
Myung-yi Chung 33.33% 33.33%
Tae-young Chung 16.67% 16.67%
Total 100.00% 100.00%
2. Summary of Significant Accounting Policies
The consolidated financial statements have been prepared and presented which included the
accounts of Hyundai Commercial, Inc., as the parent company according to the Korean IFRS
1027, and Commercial Auto First SPC(trust) and another subsidiary(collectively the “Group”), while
Hyundai Card Co., Ltd. and Hyundai Life Insurance Co., Ltd. are accounted for under the equity
method.
Subsidiaries as of December 31, 2012 and 2011 are as follows. The Company has the substantial
power over the subsidiaries established as special purpose entities for asset securitization even
though its ownership interests over the subsidiaries do not exceed 50%.
2012 2011
Commercial Auto First SPC(trust) Commercial Auto First SPC(trust)
Special Purpose
Commercial Auto Second Commercial Auto Second
Entities
SPC(trust) SPC(trust)
The Group’s financial statements for the annual period beginning on January 1, 2011, have been
prepared in accordance with Korean IFRS. These are the standards and related interpretations
issued by the International Accounting Standards Board ("IASB") that have been adopted by the
Republic of Korea.
The preparation of financial statements requires the use of certain critical accounting estimates. It
also requires management to exercise judgment in the process of applying the Group’s accounting
policies. The areas involving a higher degree of judgment or complexity, or areas where
assumptions and estimates are significant to the consolidated financial statements are disclosed in
Note 2.3.
The Group has adopted the method of calculating operating income retroactively in accordance
11
14. Hyundai Commercial, Inc. and Subsidiaries
Notes to the Consolidated Financial Statements
December 31, 2012 and 2011
with amendment of Korean IFRS 1001, Presentation of financial statements, and the related
consolidated statements of comprehensive income was rewritten with reflecting changed facts as
Korean IFRS 1001 has been adopted.
Effects on change of the Group’s accounting policies for the years ended December 31, 2012 and
2011, are as follows:
(In thousands of
Korean won, except
earnings per share) 2012 2011
1 1
Before Effect After Before Effect After
Operating income
2
81,810,559 35,407 81,845,966 86,380,810 1,320,268 87,701,078
2
Net income 42,917,888 - 42,917,888 73,360,054 - 73,360,054
2
Earnings per share 1,846 1,846 3,368 3,368
1
The amounts of effect previously classified as operating income(loss) before amendment of Korean IFRS
1001, and excluded from operating income(loss) after amendment of Korean IFRS 1001 are as follows:
Type 2012 2011
Non-operating income
Gain on disposal of property and
2,856 4,346
equipment
Miscellaneous income 659,947 409,289
662,803 413,635
Non-operating income
Loss on disposal of property and
113,850 50,146
equipment
Impairment loss on other investment
- 1,433,571
assets
Contribution 50,000 -
Miscellaneous loss 534,360 250,186
698,210 1,733,903
2
The amendments to Korean IFRS 1019 are not applied.
The amendments to K-IFRS 1019, Employee Benefits were early adopted in 2012. The approach
for the recognition of actuarial gains and losses has changed and the effects on financial
statements are as follows. The Group has recognized the effects incurred from the amendments
retroactively.
The consolidated statement of comprehensive income for year ended December 31, 2011, has
been restated to reflect all the changes comparatively.
(In thousands of
Korean won) 2012 2011
Before Effect After Before Effect After
Operating income
1
81,845,966 962,486 82,808,452 87,701,078 517,845 88,218,923
1
Income tax expense 22,202,749 232,921 22,435,670 26,241,601 125,319 26,366,920
12
15. Hyundai Commercial, Inc. and Subsidiaries
Notes to the Consolidated Financial Statements
December 31, 2012 and 2011
1
Net income 42,917,888 729,565 43,647,453 73,360,054 392,526 73,752,580
Retained earnings 135,869,285 - 135,869,285 146,466,632 - 146,466,632
1
The amendments to Korean IFRS 1001, Presentation of financial statements, are applied.
New standards, amendments and interpretations issued but not effective for the financial year
beginning January 1, 2012, and not early adopted by the Group are as follows:
- Amendment of Korean IFRS 1001, Presentation of financial statements
Korean IFRS 1001, Presentation of financial statements, was amended to require the other
comprehensive income items to be presented into two groups on the basis of whether they are
potentially reclassificable to profit or loss subsequently. An entity shall apply those amendments
for annual periods beginning on or after July 1, 2012. Earlier application is permitted. The Group
expects the application of the above amended Korean IFRS requirement would not have a
material impact on its consolidated financial statements.
- Enactment of Korean IFRS 1113, Fair value measurement
Korean IFRS 1113, Fair value measurement, aims to improve consistency and reduce complexity
by providing a precise definition of fair value and a single source of fair value measurement and
disclosure requirements for use across Korean IFRS. Korean IFRS1113 does not extend the use
of fair value accounting but provides guidance on how it should be applied where its use is already
required or permitted by other standards within Korean IFRS. This amendment will be effective for
the Group as of January 1, 2013, and the Group is assessing the impact of application of the
amended Korean IFRS 1113 on its consolidated financial statements.
- Enactment of Korean IFRS 1110, Consolidated Financial Statements
Korean IFRS 1110, Consolidated Financial Statements, builds on existing principles by identifying
the concept of control as the determining factor in whether an entity should be included in the
consolidated financial statements of the Parent Company. An investor controls an investee when it
is exposed, or has rights, to variable returns from its involvement with the investee and has the
ability to affect those returns through its power over the investee. The standard provides additional
guidance to assist in the determination of control where this is difficult to assess. This enactment
will be effective for annual periods beginning on or after January 1, 2013, and the Group is
reviewing the impact of this standard.
- Enactment of Korean IFRS 1112, Disclosures of Interests in Other Entities
Korean IFRS 1112, Disclosures of Interests in Other Entities, provides the disclosure requirements
for all forms of interests in other entities, including a subsidiary, a joint arrangement, an associate,
a consolidated structured entity and an unconsolidated structured entity. This enactment will be
effective for annual periods beginning on or after January 1, 2013, and the Group is reviewing the
impact of this standard.
13
16. Hyundai Commercial, Inc. and Subsidiaries
Notes to the Consolidated Financial Statements
December 31, 2012 and 2011
The following is a summary of significant accounting policies followed by the Group in the
preparation of its consolidated financial statements. These policies have been consistently applied
to all the periods presented, unless otherwise stated.
2.1 Consolidation
a. Subsidiaries
Subsidiaries are all entities (including special purpose entities) over which the Company has the
power to govern the financial and operating policies generally accompanying a shareholding of
more than one-half of the voting rights. The existence and effect of potential voting rights that are
currently exercisable or convertible are considered when assessing whether the Company controls
another entity. The Group also assesses existence of control where it does not have more than 50%
of the voting power but is able to govern the financial and operating policies by virtue of de-facto
control. De-facto control may arise in circumstances where the size of the Group’s voting rights
relative to the size and dispersion of holdings of other shareholders give the Group the power to
govern the financial and operating policies and others. Subsidiaries are fully consolidated from the
date on which control is transferred to the Company. They are de-consolidated from the date that
control ceases.
The Group uses the acquisition method to account for business combinations. The consideration
transferred is measured as the fair values of the assets transferred, equity interests issued and
liabilities incurred or assumed at the acquisition date. Acquisition-related costs are expensed as
incurred. Identifiable assets acquired and liabilities and contingent liabilities assumed in a business
combination are measured initially at their fair values at the acquisition date. On an acquisition-by-
acquisition basis, the Group recognizes any non-controlling interest in the acquiree at the non-
controlling interest’s proportionate share of the acquiree’s net assets.
The excess of the consideration transferred and the amount of any non-controlling interest in the
acquiree and the acquisition-date fair value of any previous equity interest in the acquiree over the
fair value of the Group’s share of the identifiable net assets acquired is recorded as goodwill. If this
is less than the fair value of the net assets of the subsidiary acquired in the case of a bargain
purchase, the difference is recognized directly in the statement of comprehensive income.
Intercompany transactions, balances and unrealized gains on transactions between Group
companies are eliminated.
b. Special purpose entities
The Group established several SPEs for the purpose of asset-backed securitization, but owns none
of the shares directly or indirectly. The Group consolidates the SPEs when the risks, rewards and
substance of the relationship indicated that the Group consolidates the SPEs. SPEs controlled by
the Group are created with conditions that impose strict limits on the decision-making power over
the operations therefore the Group obtains all benefits from the SPEs’ operation and net assets,
and that the Group may be exposed to risks incident to the activities of the SPEs or the Group
retains the majority of the residual or ownership risks related to the SPEs’ assets.
14
17. Hyundai Commercial, Inc. and Subsidiaries
Notes to the Consolidated Financial Statements
December 31, 2012 and 2011
c. Transactions with non-controlling interests
The Group treats transactions with non-controlling interests as transactions with equity owners of
the Group. For purchases from non-controlling interests, the difference between any consideration
paid and the relevant share acquired of the carrying value of net assets of the subsidiary is
recorded in equity. Gains or losses on disposals to non-controlling interests are also recorded in
equity.
d. Associates
Associates are all entities over which the Group has significant influence but not control, generally
accompanying a shareholding of between 20% and 50% of the voting rights. Investments in
associates are accounted for using the equity method of accounting and are initially recognized at
cost. The Group’s investment in associates includes goodwill identified on acquisition, net of any
accumulated impairment loss.
The Group’s share of its associates’ post-acquisition profits or losses is recognized in the income
statement, and its share of post-acquisition movements in other comprehensive income is
recognized in other comprehensive income. The cumulative post-acquisition movements are
adjusted against the carrying amount of the investment. When the Group’s share of losses in an
associate equals or exceeds its interest in the associate, including any other unsecured
receivables, the Group does not recognize further losses, unless it has incurred obligations or made
payments on behalf of the associate.
Unrealized gains on transactions between the Group and its associates are eliminated to the extent
of the Group’s interest in the associates. Unrealized losses are also eliminated unless the
transaction provides evidence of an impairment of the asset transferred. Accounting policies of
associates have been changed where necessary to ensure consistency with the policies adopted by
the Group.
2.2 Foreign currency translation
a. Functional and presentation currency
Items included in the financial statements of each of the Group’s entities are measured using the
currency of the primary economic environment in which the entity operates (the “functional
currency”). The consolidated financial statements are presented in Korean won, which is the
Group’s functional currency.
b. Transactions and balances
Foreign currency transactions are translated into the functional currency using the exchange rates
prevailing at the dates of the transactions or valuation where items are remeasured. Foreign
exchange gains and losses resulting from the settlement of such transactions and from the
translation at year-end exchange rates of monetary assets and liabilities denominated in foreign
15
18. Hyundai Commercial, Inc. and Subsidiaries
Notes to the Consolidated Financial Statements
December 31, 2012 and 2011
currencies are recognized in the income statement, except when deferred in other comprehensive
income as qualifying cash flow hedges.
2.3 Critical accounting estimates and assumptions
Estimates and judgments are continually evaluated and are based on historical experience and
other factors, including expectations of future events that are believed to be reasonable under the
circumstances. The resulting accounting estimates will, by definition, seldom equal the related
actual results. The estimates and assumptions that have a significant risk of causing a material
adjustment to the carrying amounts of assets and liabilities within the next financial year are
addressed below.
a. Allowance for doubtful accounts
The Group presents the allowance for doubtful accounts calculated based on the best estimates
that are necessary to reflect the impairment incurred at each reporting date. Allowance for doubtful
accounts is recognized as individual and collective units considering the financial circumstances of
customers, net realizable value, credit quality, size of portfolio, concentrativeness, economic factors
and others. According to the change in these factors, the allowance for doubtful accounts will be
changed in a future period.
b. Fair value of financial instruments
Fair value of financial assets and liabilities is based on quoted market prices, exchange-broker
prices of financial instruments traded in an active market. If there is no quoted price for a financial
instrument, the Group establishes fair value by using valuation techniques and advanced self-
valuation techniques.
Valuation techniques include the Discount Cash Flow method using variables observable in market,
comparison method with similar instruments that have observable market transactions, and option
pricing model. For more complicated financial instruments, the Group uses advanced self-valuation
techniques. Parts of or all the variables used in this valuation technique may not be observable in
market, or may be derived from quoted prices and market ratio, or may be measured based on
specific assumption.
At initial recognition if the difference between the fair value of valuation technique and transaction
price occurs, then the transaction price as the best estimate of fair value is recognized as fair value.
This fair value difference presents in profit immediately on any available observable market data
according to individual factors and changes of environment.
c. Defined benefit liability
The present value of the defined benefit liability depends on a number of factors that are
determined on an actuarial basis using a number of assumptions. The assumptions used in
determining the net cost (income) for pensions include the discount rate. Any changes in these
16
19. Hyundai Commercial, Inc. and Subsidiaries
Notes to the Consolidated Financial Statements
December 31, 2012 and 2011
assumptions will impact the carrying amount of the defined benefit liability. The Group determines
the appropriate discount rate at the end of each year. This is the interest rate that is used to
determine the present value of estimated future cash outflows expected to be required to settle the
defined benefit liability. In determining the appropriate discount rate, the Group considers the
interest rates of high-quality corporate bonds that are denominated in the currency in which the
pension benefits will be paid, and that have terms to maturity approximating to the terms of the
related pension liability. Other key assumptions for defined benefit liability are based in part on
current market conditions. Additional information is disclosed in Note 2.16.
2.4 Revenue recognition
The Group recognizes capital lent to customers as loans receivable. While installment financial
capital paid by the Group to manufacturers or sellers on behalf of customers is recognized as
installment financial assets. Financial lease receivables classified as financial leases are
recognized as lease receivables.
The expected future cash flows from loans receivable, installment financial assets and lease
receivables (“Financial receivables”) described above are amortized under the effective interest
method over the period of the financial receivables being used by customers.
2.5 Statements of cash flows
The Group prepares statements of cash flows using indirect method.
2.6 Cash and cash equivalents
Cash and cash equivalents include cash in hand, deposits held at call with banks and other short-
term highly liquid investments with original maturities of three months or less.
2.7 Financial assets
a. Classification
The Group classifies its financial assets as financial assets at fair value through profit or loss, loans
and receivables and available-for-sale financial assets. Management determines the classification
of its financial assets at initial recognition.
Financial assets at fair value through profit or loss
Financial assets at fair value through profit or loss are financial assets held for trading. A financial
asset is classified in this category if acquired principally for the purpose of selling in the short term.
Derivatives are also categorized as held for trading unless they are designated as hedges.
Meanwhile, the Group has no financial asset at fair value through profit or loss other than financial
assets held for trading.
17
20. Hyundai Commercial, Inc. and Subsidiaries
Notes to the Consolidated Financial Statements
December 31, 2012 and 2011
Loans and receivables
Loans and receivables are non-derivative financial assets with fixed or determinable payments that
are not quoted in an active market.
Available-for-sale financial assets
Available-for-sale financial assets are non-derivatives that are either designated in this category or
not classified in any of the other categories.
b. Recognition and measurement
Regular purchases and sales of financial assets are recognized on the trade-date. Investments are
initially recognized at fair value plus transaction costs for all financial assets not carried at fair value
through profit or loss. Financial assets carried at fair value through profit or loss are initially
recognized at fair value, and transaction costs are expensed in the income statement. Available-for-
sale financial assets and financial assets at fair value through profit or loss are subsequently carried
at fair value. Loans and receivables are subsequently carried at amortized cost using the effective
interest method.
Changes in the fair value of financial assets at fair value through profit or loss are recognized in
income statement as gain or loss. When securities classified as available-for-sale are sold or
impaired, the accumulated fair value adjustments recognized in equity are transferred to the income
statement as gain or loss on disposal of securities. Interest on available-for-sale securities
calculated using the effective interest method is recognized in the income statement as part of
interest income. Dividends on available-for sale equity instruments are recognized in the income
statement as dividend income when the Group’s right to receive payments is established.
c. Derecognition of financial assets
A financial asset is derecognized only if the contractual rights on cash flow of the financial asset
terminate or all the risks and rewards of ownership of the financial asset are substantially
transferred.
If the Group transfers substantially all the risks and rewards of ownership of the financial asset, the
Group shall derecognize the financial asset and recognize separately as assets or liabilities any
rights and obligations created or retained in the transfer. If the Group retains substantially all the
risks and rewards of ownership of the financial asset, the Group shall continue to recognize the
financial asset.
d. Impairment of financial assets
(1) Assets carried at amortized cost
18
21. Hyundai Commercial, Inc. and Subsidiaries
Notes to the Consolidated Financial Statements
December 31, 2012 and 2011
The Group assesses at the end of each reporting period whether there is objective evidence that a
financial asset is impaired. Impairment losses are incurred only if there is objective evidence of
impairment and that loss event has an impact on the estimated future cash flows of the financial
asset. The amount of the loss is measured as the difference between the asset’s carrying amount
and the present value of estimated future cash flows discounted at the financial asset’s original
effective interest rate.
If, in a subsequent period, the amount of the impairment loss decreases and the decrease can be
related objectively to an event occurring after the impairment was recognized, the reversal of the
previously recognized impairment loss is recognized in the income statement.
(2) Available-for-sale financial assets
The Group assesses at the end of each reporting period whether there is objective evidence that a
financial asset or a group of financial assets is impaired. For equity securities classified as
available-for-sale, a significant or prolonged decline in the fair value of the security below its cost is
also evidence that the assets are impaired. If any such evidence exists for available-for-sale
financial assets, the difference between carrying amount and current fair value is recognized in
profit or loss. Impairment losses recognized in profit or loss for an investment in an equity
instrument classified as available for sale are not be reversed through profit or loss. If, in a
subsequent period, the fair value of a debt instrument classified as available-for-sale increases and
the increase can be objectively related to an event occurring after the impairment loss was
recognized in profit or loss, the impairment loss is reversed.
2.8 Deferral of loan origination fee and loan origination cost
Loan origination fee, which is a processing fee in relation to the loan origination process such as
upfront fee, is deferred and deducted from the loan account, adjusted over the life of the loan based
on the effective interest rate method. Loan origination cost, which relates to activities performed by
the lender such as soliciting potential borrowers, is deferred and added to the loan account,
adjusted over the life of the loan based on the effective interest rate method when the future
economic benefit in connection with the cost incurred can be identified on a per loan basis.
2.9 Allowances for financial receivables
a. Calculation of allowances for doubtful accounts
The Group recognizes the impairment of receivables as an allowance for doubtful accounts. It is
based on the impairment estimates made through impairment assessment of receivables carried at
amortized cost. Allowance for doubtful accounts consists of impairments related to individually
material financial receivables and allowances of collective assessment for impairment incurred in
homogeneous assets.
Individually material receivables undertake the individual assessment of the difference between the
assets’ carrying amount and the present value of estimated future cash flows. Unimpaired assets
19
22. Hyundai Commercial, Inc. and Subsidiaries
Notes to the Consolidated Financial Statements
December 31, 2012 and 2011
from individual assessments and individually immaterial assets undertake the collective assessment
classified by asset groups that have analogous risk attributes. The Group uses statistical model in
the collective assessment based on the expected probability of default, periodic collect amounts,
loss-given default based on the past losses, loss emergency period, and management’s decision
about the current economy and credit circumstances. The material factors used in statistical model
for the collective assessment are evaluated to compare with actual data regularly.
The amount of impairment loss is reflected in allowance for doubtful accounts as profit or loss.
b. Write-off policy
The Group writes off the doubtful receivables when the assets are deemed unrecoverable. This
decision considers the information about significant changes of financial position such that a
borrower or an obligor is in default, or the amount recoverable from security is not enough. Write-off
decision of standard small loan is generally made based on the delinquent status of loan.
2.10 Leases
a. Classification
The Group classifies leases based on the extent to which risks and rewards incidental to ownership
of a leased asset lie with the lessor or the lessee.
The lease arrangement classified as a financial lease is where: ①the lease transfers ownership of
the asset to the lessee by the end of the lease term, ②the lessee has the option to purchase the
asset at a price that is expected to be sufficiently lower than the fair value at the date the option
becomes exercisable for it to be reasonably certain, at the inception of the lease, that the option will
be exercised, ③the lease term is for the major part of the economic life of the asset even if the title
is not transferred, ④at the inception of the lease the present value of the minimum lease payments
amounts to at least substantially all of the fair value of the leased asset, or ⑤the leased assets are
of such a specialized nature that only the lessee can use them without major modifications.
Minimum lease payments include that part of the residual value that is guaranteed by the lessee,
by a party related to the lessee or by a third party unrelated to the Group that is financially capable
of discharging the obligations under the guarantee.
b. Finance leases
Where the Group has substantially all the risks and rewards of ownership, leases of property, and
equipment are classified as finance lease. An amount equal to the net investment in the lease is
presented as a receivable. Expenses that are incurred with regard to the lease contract made but
not executed at the date of the statement of financial position are accounted for as prepaid leased
assets and are reclassified as finance lease receivables at the inception of the lease. Lease
receivables include amounts such as commissions, legal fees and internal costs that are
incremental and directly attributable to negotiating and arranging a lease. Each lease payment is
20
23. Hyundai Commercial, Inc. and Subsidiaries
Notes to the Consolidated Financial Statements
December 31, 2012 and 2011
allocated between principal and finance income. Financial income on an uncollected part of net
investment shall be allocated to each period during the lease term so as to produce a constant
periodic rate of interest on the remaining balance of the liability.
2.11 Property and equipment
Property and equipment are stated at historical cost less accumulated depreciation and
accumulated impairment losses. Historical cost includes expenditure that is directly attributable to
the acquisition of the items. Subsequent costs are included in the asset’s carrying amount or
recognized as a separate asset, as appropriate, only when it is probable that future economic
benefits associated with the item will flow to the Group and the cost of the item can be measured
reliably.
Depreciation method and estimated useful lives used by the Group are as follows:
Depreciation Method Useful life
Vehicles Straight-line 4 years
Fixtures and furniture Straight-line 4 years
Works of art classified under other tangible assets are not amortized due to their indefinite useful
life in nature.
The assets’ residual values and useful lives are reviewed, and adjusted if appropriate, at the end of
each reporting period. An asset’s carrying amount is written down immediately to its recoverable
amount if the asset’s carrying amount is greater than its estimated recoverable amount. Gains and
losses on disposals are determined by comparing the proceeds with the carrying amount and are
recognized within other operating income (expenses) in the consolidated statements of
comprehensive income.
2.12 Intangible assets
Intangible assets are stated at cost, which includes acquisition cost and directly related costs
required to prepare the asset for its intended use. Intangible assets are stated net of accumulated
amortization calculated based on using the following amortization method and estimated useful
lives:
Amortization Method Useful life
Development costs Straight-line 5 years
Software Straight-line 4 years
Other intangible assets Straight-line 5 years
2.13 Impairment of non-financial assets
Assets that have an indefinite useful life are not subject to amortization and are tested annually for
impairment. Assets that are subject to amortization are reviewed for impairment whenever events
21
24. Hyundai Commercial, Inc. and Subsidiaries
Notes to the Consolidated Financial Statements
December 31, 2012 and 2011
or changes in circumstances indicate that the carrying amount may not be recoverable. An
impairment loss is recognized for the amount by which the asset’s carrying amount exceeds its
recoverable amount. The recoverable amount is the higher of an asset’s fair value less costs to sell
and value in use. For the purposes of assessing impairment, assets are grouped at the lowest
levels for which there are separately identifiable cash flows (cash-generating units). Non-financial
assets that are subject to amortization suffered impairment are reviewed for possible reversal of the
impairment at each reporting date.
2.14 Financial Liabilities
(a) Financial liabilities at fair value through profit or loss
Financial liabilities at fair value through profit or loss are financial instruments held for trading.
Financial liabilities are classified as financial liabilities at fair value through profit or loss when
incurred principally for the purpose of repurchasing it in the near term. Derivatives or embedded
derivatives are also categorized as this category unless they are designated as hedges.
(b) Financial liabilities carried at amortized cost
The Group classifies non-derivative financial liabilities, except for financial liabilities at fair value
through profit or loss and financial liabilities that arise when a transfer of a financial asset does not
qualify for derecognition, as financial liabilities carried at amortized cost and as ‘trade payables’,
‘borrowings’, and ‘other financial liabilities’ in the statement of financial position. In case when a
transfer of a financial asset does not qualify for derecognition, the transferred asset is continuously
recognized as asset and the consideration received is recognized as financial liabilities.
2.15 Financial Guarantee Contract
Financial guarantee contracts are contracts that require the issuer to make specified payments to
reimburse the holder for a loss it incurs because a specified debtor fails to make payments when
due, in accordance with the terms of a debt instrument.
Financial guarantees are initially recognized in the financial statements at fair value on the date the
guarantee was given. Subsequent to initial recognition, the Group’s liabilities under such
guarantees are measured at the higher of the amounts below. Any increase in the liability relating
to guarantees is reported as other financial liabilities.
- The amount calculated in accordance with Korean IFRS 1037, Provisions, Contingent
Liabilities and Contingent Assets; or
- The initial amount, less accumulated amortization recognized in accordance with Korean
IFRS 1018, Revenue.
2.16 Pension obligations
The Group operates a defined benefit plan. The liability recognized in the statement of financial
position in respect of defined benefit pension plans is the present value of the defined benefit
22
25. Hyundai Commercial, Inc. and Subsidiaries
Notes to the Consolidated Financial Statements
December 31, 2012 and 2011
obligation at the end of the reporting period less the fair value of plan assets, together with
adjustments for unrecognized past-service costs. The defined benefit obligation is calculated
annually by independent actuaries using the projected unit credit method. The present value of the
defined benefit obligation is determined by discounting the estimated future cash outflows using
interest rates of high-quality corporate bonds that are denominated in the currency in which the
benefits will be paid, and that have terms to maturity approximating to the terms of the related
pension obligation.
Actuarial gains and losses arising from experience adjustments and changes in actuarial
assumptions are recognized in other comprehensive income or loss in the period in which they
arise.
2.17 Provisions and contingent liabilities
When there is a probability that an outflow of economic benefits will occur due to a present
obligation resulting from a present legal or as a result of past events, and whose amount is
reasonably estimable, a corresponding amount of provision is recognized in the financial
statements. Where there are a number of similar obligations, the likelihood that an outflow will be
required in settlement is determined by considering the class of obligations as a whole. A provision
is recognized even if the likelihood of an outflow with respect to any one item included in the same
class of obligations may be small.
Provisions are the best estimate of the expenditure required to settle the present obligation that
consider the risks and uncertainties inevitably surround many events and circumstances at the
reporting date. Where the effect of the time value of money is material, the amount of a provision is
the present value of the expenditures expected to be required to settle the obligation.
A possible obligation that arises from past events and whose existence will be confirmed only by
the occurrence or non-occurrence of uncertain future events, or a present obligation that arises
from past events but is not certain to occur, or cannot be reliably estimated, a disclosure regarding
the contingent liability is made in the notes to the financial statements.
2.18 Derivative financial instruments
The Group has applied hedging policies using derivatives to deal with the risk of changes in foreign
currency exchange rates and interest rates arising from liabilities. The Group has contracted
currency swap and interest swap derivative financial instruments to deal with the risk of changes in
foreign currency exchange rates arising from foreign currency liabilities and the risk of changes in
interest rates arising from floating-rate liabilities.
Derivatives are initially recognized at fair value on the date a derivative contract is entered into and
are subsequently re-measured at their fair value. The method of recognizing the resulting gain or
loss depends on whether the derivative is designated as a hedging instrument, and if so, the nature
of the item being hedged. The Group applies cash flow hedge, which are hedges of a particular risk
associated with a recognized asset or liability or a highly probable forecast transaction.
23
26. Hyundai Commercial, Inc. and Subsidiaries
Notes to the Consolidated Financial Statements
December 31, 2012 and 2011
The Group documents at the inception of the transaction the relationship between hedging
instruments and hedged items, as well as its risk management objectives and strategy for
undertaking various hedging transactions to apply hedging accounting. The Group also documents
its assessment, both at hedge inception and on an ongoing basis, of whether the derivatives that
are used in hedging transactions are highly effective in offsetting changes in fair values or cash
flows of hedged items.
The effective portion of changes in the fair value of derivatives that are designated and qualify as
cash flow hedges is recognized in other comprehensive income and profits and losses reclassified
from equity. The gain or loss relating to the ineffective portion is recognized immediately in profits
or losses. The cumulative gain or loss that was reported in equity is recognized when the hedged
items affect profits and losses. When applying hedging accounting, the relative profits or losses are
reclassified to interest expenses and gain or loss on foreign exchange translation.
When a hedging instrument expires or is sold, or when a hedge no longer meets the criteria for
hedge accounting, any cumulative gain or loss existing in equity at that time remains in equity and
is recognized when the forecast transaction is ultimately recognized in the income statement. When
a forecast transaction is no longer expected to occur, the cumulative gain or loss that was reported
in equity is immediately transferred to profits or losses.
2.19 Current and deferred income tax
The tax expense for the period comprises current and deferred tax. Tax is recognized in the income
statement, except to the extent that it relates to items recognized in other comprehensive income or
directly in equity. In this case, the tax is also recognized in other comprehensive income or directly
in equity.
The current income tax charge is calculated on the basis of the tax laws enacted or substantively
enacted at the statement of financial position date in the countries where the Group operates and
generates taxable income. Management periodically evaluates positions taken in tax returns with
respect to situations in which applicable tax regulation is subject to interpretation. It establishes
provisions where appropriate on the basis of amounts expected to be paid to the tax authorities.
Deferred income tax is recognized, using the liability method, on temporary differences arising
between the tax bases of assets and liabilities and their carrying amounts in the consolidated
financial statements. However, deferred tax assets and liabilities are not recognized if they arise
from initial recognition of an asset or liability in a transaction other than a business combination that
at the time of the transaction affects neither accounting nor taxable profit or loss. Deferred income
tax is determined using tax rates and laws that have been enacted or substantially enacted by the
statement of financial position date and are expected to apply when the related deferred income tax
asset is realized or the deferred income tax liability is settled.
Deferred income tax assets are recognized only to the extent that it is probable that future taxable
profit will be available against which the temporary differences can be utilized.
24
27. Hyundai Commercial, Inc. and Subsidiaries
Notes to the Consolidated Financial Statements
December 31, 2012 and 2011
Deferred income tax is provided on temporary differences arising on investments in subsidiaries,
associates and joint ventures except for deferred income tax liability where the timing of the
reversal of the temporary difference is controlled by the Group and it is probable that the temporary
difference will not reverse in the foreseeable future.
Deferred income tax assets and liabilities are offset when there is a legally enforceable right to
offset current tax assets against current tax liabilities and when the deferred income taxes assets
and liabilities relate to income taxes levied by the same taxation authority on either the same
taxable entity or different taxable entities where there is an intention to settle the balances on a net
basis.
2.20 Earnings per share
Basic earnings per share is calculated by dividing the profit attributable to equity holders of the
Group by the weighted average number of ordinary shares in issue during the period excluding
ordinary shares purchased by the Group and held as treasury shares.
Diluted earnings per share is calculated by adjusting the weighted average number of ordinary
shares outstanding to assume conversion of all dilutive potential ordinary shares. Only dilutive
potential ordinary shares are dilutive, they are added to the number of ordinary shares outstanding
in the calculation of diluted earnings per share.
2.21 Dividend Distribution
Dividend distribution to the Company’s shareholders is recognized as a liability in the financial
statements in the period in which the dividends are approved by the Company’s shareholders.
2.22 Approval of Issuance of the Financial Statements
The issuance of the December 31, 2012 consolidated financial statements of the Group was
approved by the Board of Directors on February 28, 2013.
3. Restricted Financial Instruments
Restricted financial instruments are as follows:
(in thousands of Korean won)
Type Entities 2012 2011 Restriction
Kookmin Bank Maintaining deposits for
Deposits 9,000 9,000
and 2 others checking account
25
28. Hyundai Commercial, Inc. and Subsidiaries
Notes to the Consolidated Financial Statements
December 31, 2012 and 2011
4. Securities
Securities are as follows:
(in thousands of Korean won)
Type 2012 2011
Available-for-sale securities
Marketable equity
10,650,000 18,200,000
Equity securities
securities Unlisted equity
5,607,645 3,083,604
securities
16,257,645 21,283,604
Debt securities 10,726,682 5,564,629
26,984,327 26,848,233
Investments in associates 285,401,945 147,539,965
312,386,272 174,388,198
Available-for-sale securities
Available-for-sale securities are as follows:
(in thousands of Korean won)
Book Value
Number of Ownership Acquisition
2012 2011
shares (%) cost
Marketable equity securities
JNK Heaters Co., Ltd. 1,000,000 12.5 10,126,881 10,650,000 18,200,000
Unlisted equity securities
1
Leehan Corp. 136,000 12.3 3,199,762 3,304,936 3,082,984
Anyang KDC Project Corp. 389,999 15.0 2,293,275 2,293,275 -
Anyang KDC Asset
1,499 15.0 8,814 8,814 -
Management Corp.
Isung Eng, Corp. 24 - 620 620 620
5,502,471 5,607,645 3,083,604
Debt securities
2
Leehan Corp. - - 5,469,801 6,726,682 5,564,629
Commercial Auto Third SPC - - 4,000,000 4,000,000 -
9,469,801 10,726,682 5,564,629
25,099,153 26,984,327 26,848,233
1
The fair value of the securities of Leehan Corp. is the valuation price provided by an external appraiser,
Korea Asset Pricing. The external appraisers valuated the fair value as the average of valuation prices
using the discounted cash flow model and the imputed market value model.
2
The debt security is a convertible bond issued by Leehan Corp. The fair value of the convertible bond for
Leehan Corp. is the valuation price provided by an external appraiser, Korea Asset Pricing. The difference
26
29. Hyundai Commercial, Inc. and Subsidiaries
Notes to the Consolidated Financial Statements
December 31, 2012 and 2011
between the fair value of convertible bond and the book value of normal bond by effective interest rate is
recognized in the gain or loss on valuation of debt securities, and the fluctuation of conversion right and
advanced redemption right is recognized in the gain or loss on embedded derivatives.
Investments in associates
Investments in associates are as follows:
(in thousands of Korean won)
2012
Number of Ownership Acquisition Net asset
Book value
shares (%) cost value
Hyundai Card
1 8,889,622 5.54 113,820,162 121,460,539 158,386,190
Co., Ltd.
Hyundai Life
Insurance 10,685,620 39.07 138,913,060 102,391,658 127,015,755
Co., Ltd.
252,733,222 223,852,197 285,401,945
(in thousands of Korean won)
2011
Number of Ownership Acquisition Net asset
Book value
shares (%) cost value
Hyundai Card
1 8,889,622 5.54 113,820,162 110,613,215 147,539,965
Co., Ltd.
1
The Group’s shareholding in Hyundai Card Co., Ltd. is less than 20%. However, the Group is able to
participate in the management and significantly influence the financial and operating processes. Thus, the
equity method is applied.
Valuations of equity method investment are as follows:
(in thousands of Korean won)
2012
Changes in
accumulated Changes in
Beginning Gain (loss) Ending
Acquisition other retained
Balance on valuation Balance
comprehen- earnings
1
sive income
Hyundai Card
147,539,965 - 10,609,150 237,075 - 158,386,190
Co., Ltd.
Hyundai Life
Insurance - 138,913,060 (18,716,249) 5,334,179 1,484,765 127,015,755
Co., Ltd.
147,539,965 138,913,060 (8,107,099) 5,571,254 1,484,765 285,401,945
27
30. Hyundai Commercial, Inc. and Subsidiaries
Notes to the Consolidated Financial Statements
December 31, 2012 and 2011
(in thousands of Korean won)
2011
Changes in
accumulated Changes in
Beginning Gain (loss) on
other retained Others Ending Balance
Balance valuation
comprehen- earnings
1
sive income
Hyundai Card
133,160,973 13,220,846 (477,206) 1,636,450 (1,098) 147,539,965
Co., Ltd.
1
Tax effects are not deducted.
Summary of financial information of investees follows:
(in thousands of Korean won)
2012
Closing Operating Net income
Assets Liabilities
month revenue (loss)
Hyundai Card
December 11,252,488,244 9,060,021,557 2,524,941,896 191,504,230
Co., Ltd.
Hyundai Life
Insurance March 3,824,606,629 3,562,563,039 885,330,384 (6,045,704)
1
Co., Ltd.
1
Hyundai Life Insurance Co., Ltd. is a corporation with fiscal year ending on March 31. But its assets and
liabilities above are as of December 31, 2012, and the results of its operations are for the nine-month period
ended December 31, 2012. The recognition of deemed cost was on February 29, 2012.
2011
Closing Operating
Assets Liabilities Net income
month revenue
Hyundai Card
December 10,851,933,716 8,855,250,685 2,407,597,301 238,647,582
Co., Ltd.
5. Financial Receivables
Financial receivables are as follows:
(in thousands of Korean won)
2012
Deferred loan
Allowance for
origination Present value
Principal doubtful Book value
fees and discounts
accounts
costs
Loans receivable
Factoring
108,000 - - (270) 107,730
Receivables
Loans 2,764,943,740 35,870,003 (200,613) (19,258,900) 2,781,354,230
2,765,051,740 35,870,003 (200,613) (19,259,170) 2,781,461,960
Installment financial assets
Auto 331,018,925 2,702,341 - (2,351,090) 331,370,176
Durable goods 25,765,456 (140,848) - (176,228) 25,448,380
356,784,381 2,561,493 - (2,527,318) 356,818,556
28
31. Hyundai Commercial, Inc. and Subsidiaries
Notes to the Consolidated Financial Statements
December 31, 2012 and 2011
Lease receivables
Finance lease
132,355,777 687 - (1,026,911) 131,329,553
receivables
3,254,191,898 38,432,183 (200,613) (22,813,399) 3,269,610,069
2011
Deferred loan
Allowance for
origination Present value
Principal doubtful Book value
fees and discounts
accounts
costs
Loans receivable
Factoring
575,109 - - (3,163) 571,946
Receivables
Loans 2,390,384,894 18,629,791 (150,234) (18,165,997) 2,390,698,454
2,390,960,003 18,629,791 (150,234) (18,169,160) 2,391,270,400
Installment financial assets
Auto 402,751,465 (315,733) - (2,700,211) 399,735,521
Durable goods 69,532,615 (677,259) - (475,143) 68,380,213
472,284,080 (992,992) - (3,175,354) 468,115,734
Lease receivables
Finance lease
84,693,337 (19,542) - (620,397) 84,053,398
receivables
2,947,937,420 17,617,257 (150,234) (21,964,911) 2,943,439,532
6. Allowance for Doubtful Accounts
Changes in allowance for doubtful accounts for the years ended December 31, 2012 and 2011, are
as follows:
(in thousands of Korean won)
2012
Loans Installment Lease
Other assets Total
receivable financial assets receivables
Beginning balance 18,169,160 3,175,354 620,397 330,388 22,295,299
Amounts written off (4,168,839) (396,392) - - (4,565,231)
Recoveries of amounts
772,833 86,527 - - 859,360
previously written off
Disposal of receivables (14,903,755) (1,921,390) (34,163) - (16,859,308)
Unwinding of discount (226,349) (28,019) - - (254,368)
Additional(reversed)
19,616,120 1,611,238 440,677 (102,913) 21,565,122
allowance
Ending balance 19,259,170 2,527,318 1,026,911 227,475 23,040,874
29
32. Hyundai Commercial, Inc. and Subsidiaries
Notes to the Consolidated Financial Statements
December 31, 2012 and 2011
(in thousands of Korean won)
2011
Loans Installment Lease
Other assets Total
receivable financial assets receivables
Beginning balance 12,795,689 3,609,027 214,613 372,974 16,992,303
Amounts written off (2,091,482) (213,575) - - (2,305,057)
Recoveries of amounts
374,021 12 119,541 - 493,574
previously written off
Disposal of receivables (10,613,501) (1,556,907) (977) - (12,171,385)
Unwinding of discount (151,126) (16,612) (108) - (167,846)
Additional(reversed)
17,855,559 1,353,409 287,328 (42,586) 19,453,710
allowance
Ending balance 18,169,160 3,175,354 620,397 330,388 22,295,299
7. Financial Instruments
The fair values of financial instruments are as follows:
(in thousands of Korean won)
2012 2011
Book value Fair value Book value Fair value
Assets
Financial assets
Cash and deposits 282,834,795 282,834,795 276,018,119 276,018,119
Available-for-sale securities 26,984,327 26,984,327 26,848,233 26,848,233
Loans receivable 2,781,461,960 2,775,937,581 2,391,270,400 2,398,975,565
Installment financial assets 356,818,556 357,631,944 468,115,734 473,294,235
Lease receivables 131,329,553 132,353,718 84,053,398 85,401,075
Derivative assets 137,775 137,775 1,369,009 1,369,009
Non-trade receivables 15,813,310 15,813,310 29,694,392 29,694,392
Accrued revenues 16,858,350 16,858,350 17,963,211 17,963,211
Leasehold deposits 11,083,914 11,201,215 9,963,176 9,861,028
3,623,322,540 3,619,753,015 3,305,295,672 3,319,424,867
Liabilities
Financial liabilities
Borrowings 723,883,961 730,188,793 725,523,723 730,010,502
Debentures 2,428,295,638 2,494,275,095 1,937,737,885 1,983,599,328
Securitized debts 309,637,148 319,737,569 359,361,742 367,266,231
Derivative liabilities 7,505,990 7,505,990 2,691,395 2,691,395
Non-trade payables 15,199,625 15,199,625 7,907,799 7,907,799
Accrued expenses 27,995,752 27,995,752 26,857,796 26,857,796
1
Withholdings 3,045,893 3,045,893 2,731,628 2,731,628
Leasehold deposits received 33,014,098 33,618,900 16,493,405 16,677,090
3,548,578,105 3,631,567,617 3,079,305,373 3,137,741,769
1
Excluding taxes.
30